Window Levels
- Indikatoren
- Version: 1.25
- Aktualisiert: 17 Juli 2024
- Aktivierungen: 10

Beschreibung
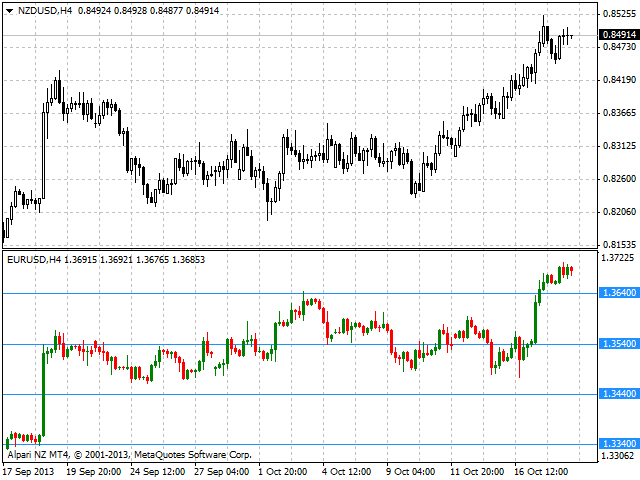
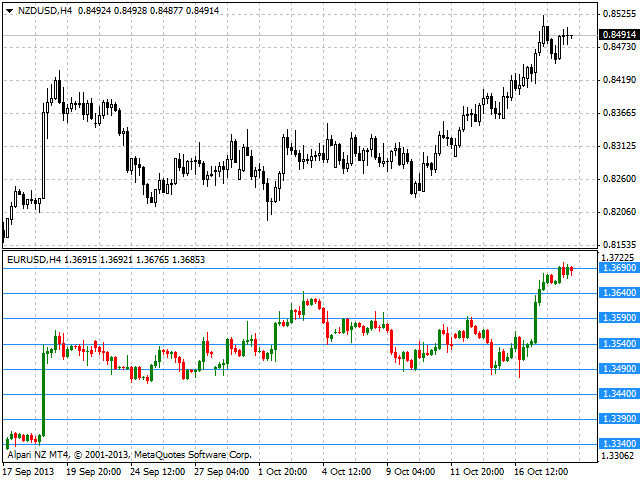
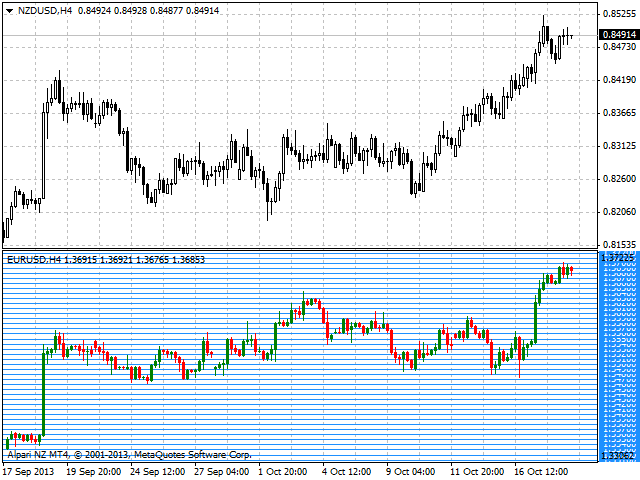
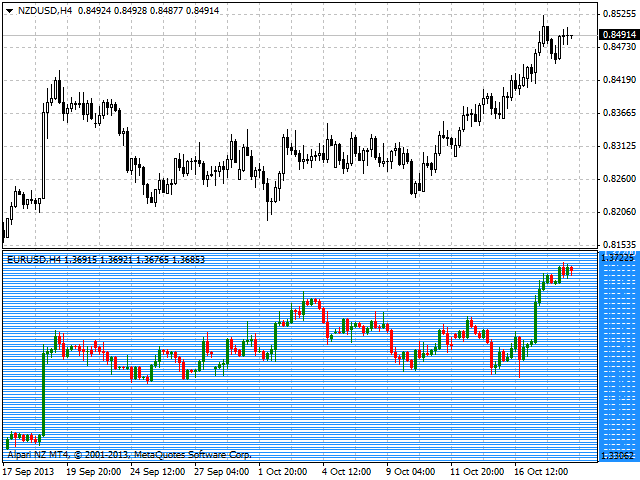
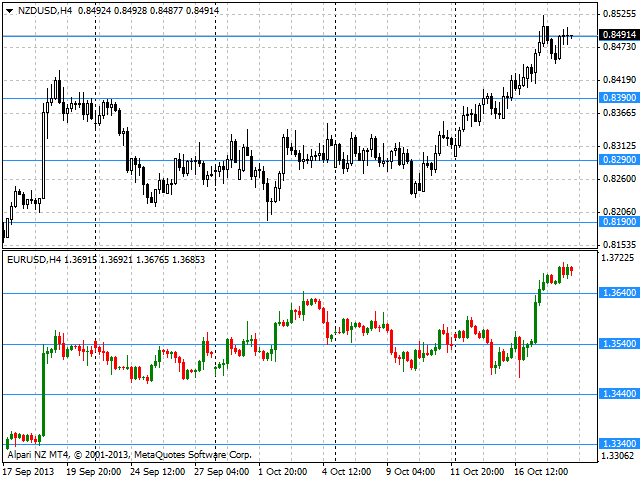
Der Indikator zeichnet ein Layout als horizontale Ebenen von runden und/oder halbrunden Preisen in einem separaten Fenster unterhalb des Hauptcharts.
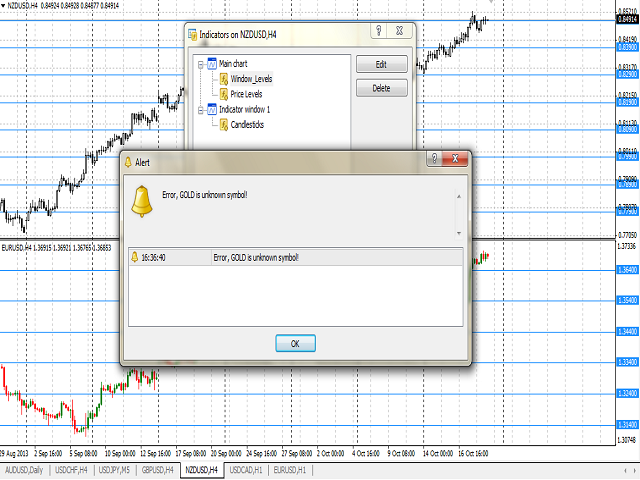
Der Indikator kann mit jedem Broker verwendet werden, unabhängig vom Namen des Finanzinstruments, da die manuelle Eingabe des Namens als Eingabeparameter notwendig ist. Wenn Sie einen nicht existierenden oder falschen Namen eines Finanzinstruments eingeben, erhalten Sie eine Fehlermeldung, dass dieses Finanzinstrument unbekannt ist (nicht existiert).
Sie können die Indikatorlinien einfärben.
Eingaben
- Currency_Name - der Name des Finanzinstruments.
- Calc_Method - Methode zur Berechnung des Levels:
- runde Kursniveaus.
- halbrunde Preisniveaus.
- Digits_Accepted - ein Flag zur Berechnung der Levels mit der Anzahl der Ziffern im Kurs des Finanzinstruments:
- true - unter Berücksichtigung der Anzahl der Ziffern.
- false - die Anzahl der Ziffern wird nicht berücksichtigt.
- Level_Color - die Farbe der angezeigten Levels.
- Bars_Number - die Anzahl der Bars, die in einem separaten Fenster angezeigt werden sollen.
- Bid_Line_Color - Farbe der Bid-Linie.
- Bars_Flag - ein Flag, das die Anzeige der im Parameter Bars_Number angegebenen Anzahl von Bars erlaubt:
- true - entsprechend der Bars_Number.
- false - maximal verfügbare Balken in der Historie.
- Bulls_Color - die Farbe der bullischen Candlesticks.
- Bears_Color - die Farbe der bearish candlestick.
Standardmäßig berechnet und baut das System runde Kursniveaus, unter Berücksichtigung der Anzahl der Ziffern in der Notierung.
Zweck
Der Indikator kann für den manuellen oder automatisierten Handel in einem Expert Advisor verwendet werden. Die Werte der Indikatorpuffer vom Typ Double können für den automatisierten Handel verwendet werden:
- Das höchste Niveau - der Puffer 4.
- Das niedrigste Niveau - der Puffer 5.
Die Zwischenstände sollten mit einem Schritt berechnet werden, der dem Wert eines runden oder halbrunden Kurses entspricht, wobei der Parameter Digits_Accepted zu berücksichtigen ist, ausgehend von den Werten des niedrigsten und des höchsten Standes, die aus den Indikatorpuffern beim entsprechenden Balken erhalten wurden.
Beschränkungen
Der Indikator benötigt nicht weniger als fünfzig Balken historischer Daten für ein Instrument. Andernfalls erhalten Sie eine Fehlermeldung mit der Aufforderung, eine Datenbank mit historischen Daten zu aktualisieren.