Price Levels

Description

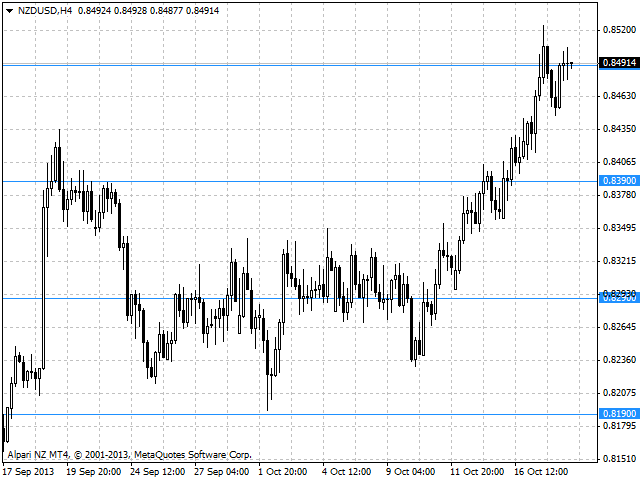
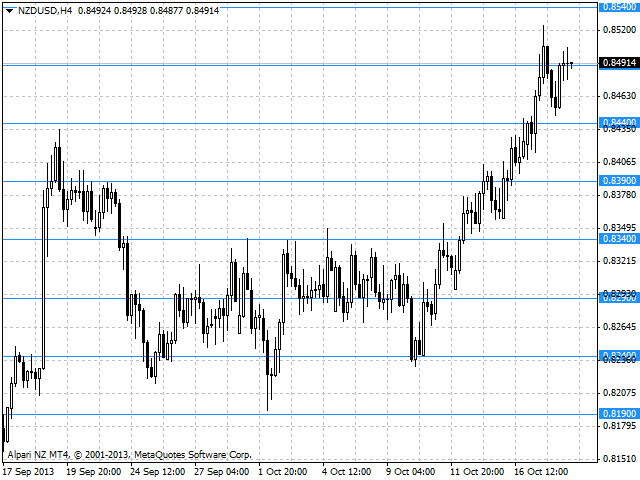
The indicator is intended for labeling the chart using horizontal levels and/or half-round prices. The indicator works on any financial instrument regardless of the name and the number of digits.

A user can choose colors for the indicator lines.


Input Parameters

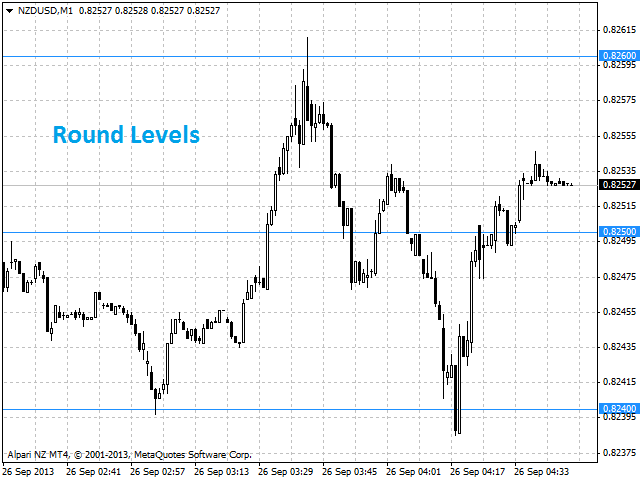
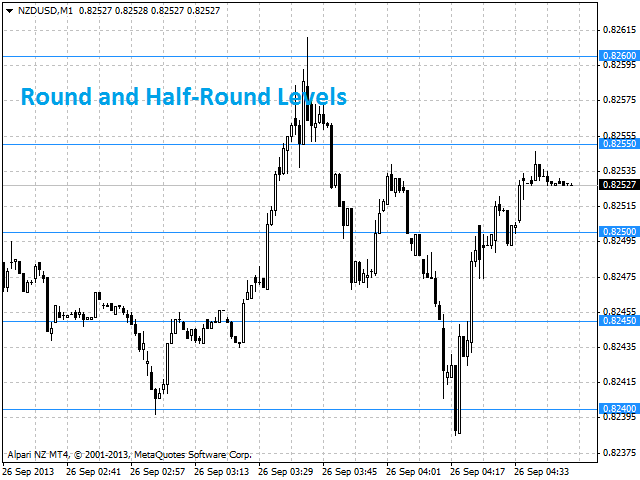
  1. Calc_Method - method of calculation of the lines:
    • levels of round prices.
    • levels of half-round prices.
  2. Digits_Accepted - flag for calculating the levels according to number of decimal places in the quotes of a financial instrument:
    • true - considering the number of decimal places.
    • false - without considering the number of decimal places.
  3. Level_Color - color of the lines displayed.

    On default, the system calculates and plots the levels of half-round prices.


    Purpose

    The indicator can be used for manual or automated trading within an Expert Advisor. For automated trading, use any indicator buffer of the double type:

    1. Highest level - buffer 0.
    2. Lowest level - buffer 1.

    Intermediate levels should be calculated using a step that corresponds to a half round or round price values and considering the highest and lowest levels obtained by examining the values of the indicator buffers on the corresponding bar.
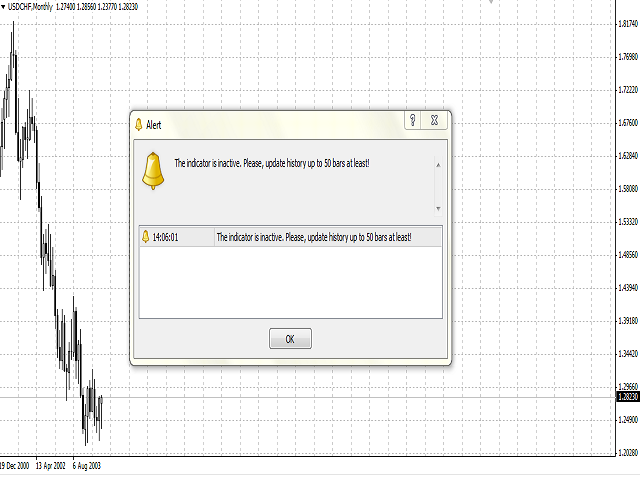

    Limitations

    For the indicator to work there should be at least 50 bars available for the financial instrument. Otherwise it will show an error message suggesting to update the price history data base. 

    Önerilen ürünler
    Asterysc SL & TP Values Info, is an indicator which will allow you to see on the chart in a visual way the potential profit/loss you could have if your trade touches TP or SL. It will also allow you to see the total accumulated TP/SL of all open trades in a very simple way on each chart. You will also be able to quickly visualize the current Drawdown of your account. *The indicator is customizable, so you can change the colors, size and fonts of each section.
    This panel is designed for quick visual search for the price action patterns on several instruments simultaneously. It is possible to add and remove instruments. Clicking the signal button allows you to quickly move to the chart with the identified pattern and timeframe. The panel searches for 8 candlestick patterns: PIN-BAR, EXTERNAL BAR, INSIDE BAR, DOJI, LEVEL, HIGH/LOW OF N BAR, FAKEY, ONE-WAY N BAR. Any of the patterns or the periods can be disabled by clicking its title. It can also search
    Rainbow Price Visualizer v1.21 See where the market really breathes. Turns your MT4 chart into an ultra-precise heatmap that highlights price zones favored by big players. Why it matters 300 price levels at 0.2‑pip resolution — microscopic detail. 8 visual themes (Rainbow, Fire, Ocean…) for instant readibility. Smart opacity: low noise fades, real zones pop. Lightweight rendering with automatic cleanup. Fully customizable: saturation, opacity, resolution, history depth. Bands project into the f
    Hi. The main obstacle for multi timeframe traders or traders who use multiple indicators on multiple charts is when they want to do analysis on multiple pairs quickly. You can imagine if there are 3 or 10 charts that must be opened when you want to do analysis. and each chart has its own template. of course it will take a long time to replace one by one before analysis. how many opportunities are lost due to the time spent changing charts. or maybe when a mentor wants to explain to his students
    Singal Engulfing Candle
    Cristobal Hidalgo Soriano
    Indicador: Engulfing Candle Strategy  El indicador "Engulfing Candle Strategy"! Este indicador personalizado para MetaTrader 4 identifica y resalta automáticamente las formaciones de velas "Engulfing", una poderosa señal técnica utilizada por traders de todo el mundo. ¿Qué es una vela "Engulfing"? Una vela "Engulfing" es una formación de dos velas consecutivas en un gráfico de precios. La primera vela es más pequeña y está completamente contenida dentro del rango de la segunda vela, que es sign
    When the price is moving Up/Down rapidly majority of brokers are increasing the Spread. This indicator will show the Spread for 9 currency pairs by your choice ( Yellow digits ) - you allow to change all input parameters, including changing the name of the currency pairs. This indicator also shows classical indicator RSI (Relative Strength Index) for defined currency pairs and will be helpful for those who love and know how to use not a visual but digital representation of the indicator.
    Description The indicator draws a layout as horizontal levels of round and/or half-round prices in a separate window below the main chart. The indicator may be used with any broker, irrespective of the name of the financial instrument since it is necessary to manually enter the name as an input parameter. If you enter a non-existent or incorrect name of a financial instrument, you will receive an error message that this financial instrument is unknown (does not exist). You can color the indicato
    MamchenkoTrend Complex - высокоточный индикатор, показывающий смену тенденций на рынке. Индикатор не перерисовывает сигнал после закрытия свечи. Дает вам уровень стопа для вашей сделки по его сигналам. Отлично подходит для ручной торговли и в разработке в АТС (автоматические торговые системы)   Настройки можно использовать по умолчанию , а также подбирать самостоятельно . На скриншотах изображен один и тот же участок графика пары GBPUSD на тайме Н4 но с разными настройками . На первом рисунке зн
    This is the linear regression indicator for basic indicators included in the standard package of the MetaTrader 4 terminal. It is used for the analysis of price movements and market mood. The market mood is judged by the slope of the linear regression and price being below or above this line. Regression line breakthrough by the indicator line may serve as a market entry signal. There is possibility of setting the color for bullish and bearish sentiments of the basic indicators as well as plottin
    Tornado Profit EA Please use the testing   set   on 1H EURUSD If you have bought ANY of my Products then you are ELIGIBLE TO JOIN the Private group !!! TELEGRAM group:   send me   message to add you to our community PRIVATE GROUP(unfortunately there are a lot of scammers to public ones...) BENEFITS: 1. Discounts and Hot DEALS    Tornado Profit EA is   full automated expert advisor that   uses a revolutionary grid system with an advanced risk reduction logic. The essence of Tornado Profit EA i
    Bears CD HTB  (Bears Convergence/Divergence High Top Bottom) is a universal analytical bears convergence/divergence indicator between a financial instrument and any of the twenty two standard indicators included in МetaTrader 4 package. The indicator is the second out of the two possible versions (HBT and HTB) of the bearish convergence/divergence origins. Due to its multiple use feature, the indicator allows you to find convergences/divergences between the price and various standard indicators
    This indicator compares the pips of the current day with the average of pips made in the previous three days. The "Percentage today range" is red if today's figure is less than the range of the previous three days, but turns green when the percentage exceeds 100%. When the range exceeds 100% there are good trading opportunities because we are in the presence of increased volatility of the past three days. Best use with Banks Day Levels indicator. Parameters settings corner (indicator display po
    Indicator that alerts by push  notification to the mobile phone or by alert on the platform of the touch of the candle with the selected average. The alarm can be set to receive "x" seconds before the candle closes. Specially suitable for those who cannot or want to spend a lot of time in front of the screens to see a movement start from a moving average and therefore miss the movement. You can configure any average method and the time to receive the alert before the candle closes.
    The most effective signals generated by Ichimoku strategies. Ichimoku Trade Alarm is a supplement for Ichimoku Trade Panel and it shows the signals that Expert Advisor reacts to. Visualization of signals:  Price / Kijun sen cross - the candle body must be between Min_Candlestick_Body and Max_Candlestick_Body. The candle must close above / below Kijun sen, minimum in 1/3 of its body. Open candle must be located above / below Kijun sen. Chinkou span must be under the price of 26 periods in advanc
    RadarPriceAction
    Roman Lipatov
    4.2 (5)
    This panel is designed for quick visual search for the price action patterns on several instruments simultaneously. It is possible to add and remove instruments. Clicking the signal button allows you to quickly move to the chart with the identified pattern and timeframe. The panel searches for 8 candlestick patterns: PIN-BAR, EXTERNAL BAR, INSIDE BAR, DOJI, LEVEL, HIGH/LOW OF N BAR, FAKEY, ONE-WAY N BAR. Any of the patterns can be disabled by clicking its title. It can also search in history (by
    Edge Finder 10
    Hassan Al-banna Ahmed Mohamed Ahmed Abdullah
    (Strikingly Simple, Powerfully Profitable) Edge Finder i s your all-in-one visual trading assistant, designed to cut through the market noise and highlight high-probability trading opportunities at a glance. How It Works (The Core Idea): Instead of overloading your chart with complex numbers,  Edge Finder uses a unique, color-coded system to paint the market picture clearly. Trend & Momentum Visualization:  The indicator analyzes the market and dynamically colors the price bars. Specific colors
    Forex Daily Percentage Calculator
    Opengates Success International
    Forex Daily Percentage Calculator Forex Daily Percentage Calculator indicator is created for the Trader who cherishes the discipline of choosing only a percentage of their Trading account balance as profit per trade, per time or day. All you need to do is enter your desired percentage of your account balance, enable the notification popup alert to know when it has been attained so as to get out of the market till another day or trade. This helps the traders who are using it to determine a certai
    The Daily Range and ADR Reversal Indicator shows you where price is currently trading in relation to its normal average daily range. You will received alerts via pop-ups when price exceeds its average daily range. This alert is a signal for a potential pullback or reversal. This gives you an edge on identifying and trading pullbacks and reversals quickly. The Indicator also shows you the Daily Range of Price for the current market session as well as previous market sessions. It shows you the AT
    Bu, bir mumun kapanış fiyatını tahmin eden bir göstergedir. Gösterge öncelikle D1 çizelgelerinde kullanılmak üzere tasarlanmıştır. Bu gösterge hem geleneksel forex ticareti hem de ikili opsiyon ticareti için uygundur. Gösterge, bağımsız bir ticaret sistemi olarak kullanılabilir veya mevcut ticaret sisteminize ek olarak hareket edebilir. Bu gösterge, mevcut mumu analiz ederek mumun gövdesi içindeki belirli güç faktörlerini ve önceki mumun parametrelerini hesaplar. Böylece gösterge, piyasa hareket
    Description Bulls CD LBT (Bulls Convergence/Divergence Low Bottom Top) is a universal analytical bulls convergence/divergence indicator between a financial instrument and any of the twenty two standard indicators included in МT4 package. The indicator is the first out of the two possible versions (LBT and LTB) of the bullish convergence/divergence origins. Due to its multiple use feature, the indicator allows you to find convergences/divergences between the price and various standard indicators
    Know2fly
    Kristian Gulin Kucan
    Know2fly - unique modular add-ons for Metatrader 4 The quickest therefore the first of a series of as fun as strong modules thoroughly designed to give you a more deep insight into the dynamics of the financial markets and, as a result, improve your trading performance in case you are into this. Module 1:  fun fast alround leightweight ask bid spread rsi dynamics on-onchart visualisation indicator fun = imagine a quickly flying dog with carpet ... leaving a trail of fire and smoke ...  fast
    BONUS INDICATOR HERE :  https://linktr.ee/ARFXTools Trading Flow Using Fibo Eminence Signal 1️⃣ Wait for the Fibonacci to Auto-Draw The system automatically detects swings (from high to low or vice versa) Once the Fibonacci levels appear, the indicator sends an alert notification “Fibonacci detected! Zone is ready.” 2️⃣ Check the Entry Zone Look at the ENTRY LINE (blue zone) This is the recommended SELL entry area (if the Fibonacci is drawn from top to bottom) Wait for the price to enter
    Break Even Trailing
    Emmanuel Lovski Ijeawele Maduagwuna
    Break Even Trailing - A Simple Swing Trade & Scalp Trade Solution Break Even Trailing is an effective and simple program designed to enable a trader achieve break even and basic dynamic trailing stops on all positions. BET  represents  Break Even  Trailing   in the instructions below.  (*) General Settings Overview: Trailing Mode : There are only two trailing modes. The Default Mode is set to Pip Based Dynamic, Mode One. This mode is the same as the typical Meta Trader Trailing feature that is
    Description Pivot System  is a universal color multicurrency/multisymbol indicator of the  Pivot Points  levels systems. You can select one of its three versions:  Standard   Old ,  Standard New  and  Fibo . It plots pivot levels in a separate window. The system will automatically calculate the  Pivot Point  on the basis of market data for the previous day ( PERIOD_D1 ) and the system of support and resistance levels, three in each. It can also display price tags for each level. You can color th
    Easy RSI divergences
    Carlos Mendez Sanchez
    Easy RSI Divergences – Unlock Professional-Level Divergence Trading Easy RSI Divergences is a cutting-edge indicator for MetaTrader 4, crafted for traders who want to gain a competitive edge by accurately identifying RSI (Relative Strength Index) divergences in real time. Whether you are a beginner or a professional, this tool transforms complex market signals into clear, actionable insights. The indicator automatically detects both classic divergences (indicating potential trend reversals) a
    Range-Bound & Reversal Strategies Dashboard (MT4) Trade clean reversals with confidence. This MT4 indicator scans 20 major instruments in real time and pinpoints high-probability range and mean-reversion opportunities—then lays everything out in a simple, professional dashboard. Why traders love it 10 Proven Setups in One Tool Support/Resistance bounce, Bollinger mean reversion, RSI OB/OS, MACD turn, Stochastic OB/OS, CCI extremes, Daily Pivot S/R, Keltner touch, Donchian extremes, and Envelop
    The moment when the MACD line crosses the signal line often leads to a significant price movement and trend changes. MACD Cross Prediction is an indicator that uses OSMA(MACD oscillator) and a red line. You can change the level of the red line on the indicator setting popup(and the red line moves up and down). The alerts(email, mobile push, sound, MT5 alert) will be sent when the MACD histogram touches the red line, which means the alerts can be sent just before/around the time when the MACD lin
    Scalper Strike
    Yaroslav Varankin
    works great with the trend, ideal for traders who trade using the scalping system. This is a pointer indicator. how to make deals. when the blue one appears, you need to open a trade to increase by 1 candle if the timeframe is m1 then for 1 minute, etc. if a red dot appears, you should make a deal to reduce it by 1 candle. Indicator signals appear along with a new candle; the working candle is the one on which the signal is located.
    OP CD LTB (Opposite Prices Convergence/Divergence Low Top Bottom) is an indicator of convergence/divergence of the bullish sentiment among the mirrored financial instruments. The indicator is the second out of the two possible versions (LBT and LTB) of the bullish convergence/divergence origins. Multiple use of the indicator allows you to find convergences/divergences between the price of the main financial instrument and any other financial instruments simultaneously. Users can select the sell
    EA Liuk Trend Limited
    Maulana Dihaan Tadiska
    2 (1)
    This is the free version of EA LIUK TREND. The different is only this is limited use only, maximum 100 trades. But not limited for back test purpose. Lot will be only 0.01. For more detail in original version, please visit :  https://www.mql5.com/en/market/product/86874 EA LIUK TREND The best way to get profit in trading is to follow the Market trend. Good money management is important too to keep your investment save, by minimizing the Draw Down. With this EA LIUK TREND, you will be able to co
    FREE
    Bu ürünün alıcıları ayrıca şunları da satın alıyor
    Gann Made Easy
    Oleg Rodin
    4.83 (152)
    Gann Made Easy , bay teorisini kullanarak ticaretin en iyi ilkelerine dayanan, profesyonel ve kullanımı kolay bir Forex ticaret sistemidir. WD Gann. Gösterge, Zararı Durdur ve Kâr Al Seviyeleri dahil olmak üzere doğru SATIN AL ve SAT sinyalleri sağlar. PUSH bildirimlerini kullanarak hareket halindeyken bile işlem yapabilirsiniz. LÜTFEN ÜCRETSİZ OLARAK TİCARET İPUÇLARI, BONUSLAR VE GANN MADE EA ASİSTANI ALMAK İÇİN SATIN ALIMDAN SONRA BENİMLE İLETİŞİME GEÇİN! Muhtemelen Gann ticaret yöntemlerini b
    Smc Blast Signal
    Mohit Dhariwal
    5 (4)
    NEW YEAR 2026 SALE OFFER PRICE AT JUST 99 DOLLARS FEW COPIES ONLY AT This price From 10th Jan -20th Jan MIDNIGHT Final offer GRAB YOUR COPY ON THIS New Year EVE Prices will be increased to 150 after the offer period ends Full Fledged EA and Alert plus for alerts will also be provided in this offer along with the purchase of Indicator. Limited copies only at this price and Ea too. Grab your copy soon Alert plus for indicator with set file is kept in comment section with the image  SMC Blast Signa
    Şu anda %20 İNDİRİMLİ! Herhangi bir Acemi veya Uzman Tüccar için En İyi Çözüm! Bu gösterge paneli yazılımı 28 döviz çifti üzerinde çalışıyor. Ana göstergelerimizden 2'sine (Gelişmiş Para Birimi Gücü 28 ve Gelişmiş Para Birimi Dürtüsü) dayanmaktadır. Tüm Forex piyasasına harika bir genel bakış sağlar. Gelişmiş Para Birimi Gücü değerlerini, para birimi hareket hızını ve tüm (9) zaman dilimlerinde 28 Forex çifti için sinyalleri gösterir. Trendleri ve / veya scalping fırsatlarını belirlemek için
    Game Changer Indicator
    Vasiliy Strukov
    4.67 (12)
    Game Changer, metatrader'ınızı güçlü bir trend analiz aracına dönüştürmek için herhangi bir finansal enstrümanda kullanılmak üzere tasarlanmış devrim niteliğinde bir trend göstergesidir. Gösterge, yeniden çizim yapmaz ve gecikmez. Herhangi bir zaman diliminde çalışır ve trend tanımlamasına yardımcı olur, olası geri dönüşleri işaret eder, takip eden bir durdurma mekanizması görevi görür ve anında piyasa tepkileri için gerçek zamanlı uyarılar sağlar. İster deneyimli, ister profesyonel, ister avant
    M1 Sniper
    Oleg Rodin
    4.89 (18)
    M1 SNIPER kullanımı kolay bir işlem göstergesi sistemidir. M1 zaman dilimi için tasarlanmış bir ok göstergesidir. Gösterge, M1 zaman diliminde scalping için bağımsız bir sistem olarak kullanılabilir ve mevcut işlem sisteminizin bir parçası olarak kullanılabilir. Bu işlem sistemi özellikle M1'de işlem yapmak için tasarlanmış olsa da, diğer zaman dilimleriyle de kullanılabilir. Başlangıçta bu yöntemi XAUUSD ve BTCUSD ticareti için tasarladım. Ancak bu yöntemi diğer piyasalarda işlem yaparken de ya
    Scalper Inside PRO
    Alexey Minkov
    4.74 (69)
    An exclusive indicator that utilizes an innovative algorithm to swiftly and accurately determine the market trend. The indicator automatically calculates opening, closing, and profit levels, providing detailed trading statistics. With these features, you can choose the most appropriate trading instrument for the current market conditions. Additionally, you can easily integrate your own arrow indicators into Scalper Inside Pro to quickly evaluate their statistics and profitability. Scalper Inside
    GOLD Impulse with Alert
    Bernhard Schweigert
    4.64 (11)
    Bu gösterge, 2 ürünümüz Advanced Currency IMPULSE with ALERT  +   Currency Strength Exotics  'in süper bir kombinasyonudur. Tüm zaman dilimleri için çalışır ve 8 ana para birimi artı bir Sembol için grafiksel olarak güç veya zayıflık dürtüsünü gösterir! Bu Gösterge, Altın, Egzotik Çiftler, Emtialar, Endeksler veya Vadeli İşlemler gibi herhangi bir sembol için para birimi gücü ivmesini göstermek için uzmanlaşmıştır. Türünün ilk örneğidir, Altın, Gümüş, Petrol, DAX, US30, MXN, TRY, CNH vb. içi
    First 25 copies at $80, after that price becomes $149 Gold Signal Pro is a powerful MT4 indicator designed to help traders spot strong price reactions in the market. It focuses on clear wick rejections , showing when price strongly rejects a level and often continues in the same direction. Gold Signal Pro is mainly built for scalping gold (XAUUSD) and works best on lower timeframes like M5 and M15 , where timing matters most. That said, it can also be used on any forex pair, any symbol, and a
    FX Volume
    Daniel Stein
    4.63 (38)
    FX Volume: Bir Broker’ın Perspektifinden Gerçek Piyasa Duyarlılığını Deneyimleyin Kısa Özet Trading yaklaşımınızı bir adım öteye taşımak ister misiniz? FX Volume , perakende traderlar ile brokerların nasıl konumlandığını gerçek zamanlı olarak sunar—COT gibi gecikmeli raporlardan çok daha önce. İster istikrarlı kazançları hedefliyor olun, ister piyasada daha güçlü bir avantaj arayın, FX Volume önemli dengesizlikleri belirlemenize, kırılmaları (breakout) doğrulamanıza ve risk yönetiminizi iyileş
    Atomic Analyst
    Issam Kassas
    5 (3)
    Öncelikle belirtmek gerekir ki bu Ticaret Göstergesi Yeniden Çizim Yapmaz, Gecikmez ve Gecikme Göstermez, bu da hem manuel hem de robot ticareti için ideal hale getirir. Kullanıcı kılavuzu: ayarlar, girişler ve strateji. Atom Analisti, Piyasada Daha İyi Bir Avantaj Bulmak İçin Fiyatın Gücünü ve Momentumunu Kullanan PA Fiyat Hareketi Göstergesidir. Gürültüleri ve Yanlış Sinyalleri Kaldırmaya ve Ticaret Potansiyelini Artırmaya Yardımcı Olan Gelişmiş Filtrelerle Donatılmıştır. Birden fazla katman
    Volatility Trend System - girişler için sinyaller veren bir ticaret sistemi. Oynaklık sistemi, trend yönünde doğrusal ve noktasal sinyaller ve ayrıca yeniden çizme ve gecikme olmaksızın trendden çıkmak için sinyaller verir. Trend göstergesi, orta vadeli trendin yönünü izler, yönünü ve değişimini gösterir. Sinyal göstergesi volatilitedeki değişikliklere dayalıdır ve piyasa girişlerini gösterir. Gösterge, çeşitli uyarı türleri ile donatılmıştır. Çeşitli alım satım araçlarına ve zaman dilimlerine
    Currency Strength Exotics
    Bernhard Schweigert
    4.88 (33)
    ŞU ANDA %20 INDIRIMLI! Herhangi bir Acemi veya Uzman Tüccar için En İyi Çözüm! Bu Gösterge, Egzotik Çiftler Emtialar, Endeksler veya Vadeli İşlemler gibi herhangi bir sembol için para birimi gücünü göstermek için uzmanlaşmıştır. Türünün ilk örneğidir, Altın, Gümüş, Petrol, DAX, US30, MXN, TRY, CNH vb. gerçek para birimi gücünü göstermek için 9. satıra herhangi bir sembol eklenebilir. Bu benzersiz, yüksek kaliteli ve uygun fiyatlı bir ticaret aracıdır çünkü bir dizi tescilli özelliği ve yeni b
    Miraculous Göstergesi – Gann Dokuz Kareye Dayalı %100 Tekrarlamayan Forex ve İkili Araç Bu video, Forex ve İkili Opsiyon traderları için özel olarak geliştirilmiş son derece doğru ve güçlü bir ticaret aracı olan Miraculous Göstergesi 'ni tanıtıyor. Bu göstergeyi benzersiz kılan, efsanevi Gann Dokuz Karesi ve Gann Titreşim Yasası 'na dayanmasıdır; bu da onu modern ticarette mevcut en hassas tahmin araçlarından biri yapmaktadır. Miraculous Göstergesi tamamen tekrarlamaz ; yani mum kapandıktan son
    Trend indicator AI
    Ramil Minniakhmetov
    5 (75)
    Trend Ai göstergesi, trend tanımlamasını işlem yapılabilir giriş noktaları ve geri dönüş uyarılarıyla birleştirerek bir yatırımcının piyasa analizini geliştirecek harika bir araçtır. Bu gösterge, kullanıcıların forex piyasasının karmaşıklıklarında güvenle ve hassasiyetle yol almalarını sağlar. Birincil sinyallerin ötesinde, Trend Ai göstergesi geri çekilmeler veya düzeltmeler sırasında ortaya çıkan ikincil giriş noktalarını belirleyerek, yatırımcıların belirlenen trend içindeki fiyat düzeltmele
    Trend Lines PRO
    Roman Podpora
    5 (1)
    TREND ÇİZGİLERİ PRO     Piyasanın gerçek yön değişimini anlamaya yardımcı olur. Gösterge, gerçek trend dönüşlerini ve büyük oyuncuların piyasaya yeniden girdiği noktaları gösterir. Anlıyorsun     BOS hatları  Daha yüksek zaman dilimlerindeki trend değişiklikleri ve önemli seviyeler, karmaşık ayarlar veya gereksiz gürültü olmadan gösterilir. Sinyaller yeniden çizilmez ve çubuk kapandıktan sonra grafikte kalır. Göstergenin gösterdiği şey: Gerçek değişimler  trend (BOS çizgileri) Bir sinyal göründ
    Dynamic Forex28 Navigator
    Bernhard Schweigert
    4.43 (7)
    Dynamic Forex28 Navigator - Yeni Nesil Forex Ticaret Aracı. ŞU ANDA %49 İNDİRİM. Dynamic Forex28 Navigator, uzun zamandır popüler olan göstergelerimizin evrimidir ve üçünün gücünü tek bir göstergede birleştirir: Gelişmiş Döviz Gücü28 Göstergesi (695 inceleme) + Gelişmiş Döviz İMPULS ve UYARI (520 inceleme) + CS28 Kombo Sinyalleri (Bonus). Gösterge hakkında ayrıntılar https://www.mql5.com/en/blogs/post/758844 Yeni Nesil Güç Göstergesi Ne Sunuyor?  Orijinallerde sevdiğiniz her şey, şimdi yeni
    Supply and Demand Dashboard PRO
    Bernhard Schweigert
    4.8 (20)
    Şu anda %20 İNDİRİMLİ! Bu gösterge paneli, birden fazla sembol ve 9 zaman dilimine kadar çalışan çok güçlü bir yazılım parçasıdır. Ana göstergemize dayanmaktadır (En iyi yorumlar: Advanced Supply Demand ).     Gösterge paneli harika bir genel bakış sağlar. Gösterir:    Bölge mukavemet derecesi dahil filtrelenmiş Arz ve Talep değerleri, Bölgelere/ve bölgeler içindeki pip mesafeleri, İç içe geçmiş bölgeleri vurgular, Tüm (9) zaman dilimlerinde seçilen semboller için 4 çeşit uyarı verir. Kişisel
    Trend Screener
    STE S.S.COMPANY
    4.79 (95)
    Trend Göstergesi, Trend Alım Satım ve Filtreleme için Çığır Açan Benzersiz Çözüm, Tüm Önemli Trend Özellikleriyle Tek Bir Araç İçinde Yerleştirildi! Forex, emtialar, kripto para birimleri, endeksler ve hisse senetleri gibi tüm sembollerde/araçlarda kullanılabilen %100 yeniden boyamayan çoklu zaman çerçevesi ve Çoklu para birimi göstergesidir. SINIRLI SÜRELİ TEKLİF: Destek ve Direnç Tarama Göstergesi sadece 50$ ve ömür boyu mevcuttur. (Orijinal fiyat 250$) (teklif uzatıldı) Trend Screener, grafik
    FX Power MT4 NG
    Daniel Stein
    4.95 (20)
    FX Power: Daha Akıllı Ticaret Kararları için Para Birimlerinin Gücünü Analiz Edin Genel Bakış FX Power , her piyasa koşulunda başlıca para birimlerinin ve altının gerçek gücünü anlamak için vazgeçilmez bir araçtır. Güçlü para birimlerini alıp zayıf olanları satarak, FX Power ticaret kararlarınızı basitleştirir ve yüksek olasılıklı fırsatları ortaya çıkarır. İster trendlere sadık kalın ister Delta'nın aşırı değerlerini kullanarak tersine dönüşleri öngörün, bu araç ticaret tarzınıza mükemmel bir
    Apollo SR Master , Destek/Direnç bölgelerinde alım satımı daha kolay ve güvenilir hale getiren özelliklere sahip bir Destek/Direnç göstergesidir. Gösterge, yerel fiyat zirvelerini ve diplerini tespit ederek Destek/Direnç bölgelerini herhangi bir gecikme olmadan gerçek zamanlı olarak hesaplar. Ardından, yeni oluşan Destek/Direnç bölgesini doğrulamak için, Destek/Direnç bölgesinin dikkate alınabileceğini ve gerçek bir SAT veya AL sinyali olarak kullanılabileceğini gösteren özel bir sinyal gösterir
    MQL5マーケットの厳格な「第四条」ガイドラインに完全準拠した英語版の全文です。 MQL5では英語が主言語となるため、このテキストを説明文の冒頭(日本語より上)に配置することを強くお勧めします。専門的かつ冷静なトーンで作成しており、世界中のプロトレーダーに「技術的根拠のあるツール」として認識される構成になっています。 KATANA Scalper for MT4  Product Overview KATANA Scalper for MT4 is a high-performance technical analysis indicator optimized for the MetaTrader 4 platform. It is specifically engineered to address the two most significant challenges in short-term trading (scalping and day trading): Price Noise and Signal Lag . Utilizing a proprietary s
    FX Levels MT4
    Daniel Stein
    5 (2)
    FX Levels: Tüm Piyasalar İçin Son Derece Hassas Destek ve Direnç Hızlı Bakış Döviz kurları, endeksler, hisseler veya emtialar gibi herhangi bir piyasada güvenilir destek ve direnç seviyeleri belirlemek mi istiyorsunuz? FX Levels geleneksel “Lighthouse” yöntemini ileri düzey bir dinamik yaklaşımla birleştirerek neredeyse evrensel bir doğruluk sağlar. Gerçek broker deneyimimize ve otomatik günlük güncellemeler ile gerçek zamanlı güncellemelerin birleşimine dayalı olarak, FX Levels size dönüş nok
    The Super Arrow Indicator provides non-repainting buy and sell signals with exceptional accuracy. Key Features No repainting – confirmed signals remain fixed Clear visual arrows: green for buy, red for sell Real-time alerts via pop-up, sound, and optional email Clean chart view with no unnecessary clutter Works on all markets: Forex, gold, oil, indices, crypto Adjustable Parameters TimeFrame Default: "current time frame" Function: Sets the time frame for indicator calculation Options: Can be set
    Currency Strength Wizard , başarılı ticaret için size hepsi bir arada çözüm sağlayan çok güçlü bir göstergedir. Gösterge, birden çok zaman dilimindeki tüm para birimlerinin verilerini kullanarak şu veya bu forex çiftinin gücünü hesaplar. Bu veriler, şu veya bu para biriminin gücünü görmek için kullanabileceğiniz, kullanımı kolay para birimi endeksi ve para birimi güç hatları biçiminde temsil edilir. İhtiyacınız olan tek şey, işlem yapmak istediğiniz tabloya göstergeyi eklemektir ve gösterge size
    Shogun Trade
    Yuki Miyake
    5 (1)
    SHOGUN Trade - Strategic Market Structure & Multi-Timeframe Dashboard Concept: The Commander’s Perspective In the battlefield of trading, getting lost in localized price fluctuations (noise) is the most significant risk to capital. SHOGUN Trade is engineered to elevate a trader's perspective from "reactive" to "strategic," providing a comprehensive overview of market structures across multiple time horizons. This system monitors seven timeframes (M1 to D1) simultaneously, quantifying market m
    AW Breakout Catcher
    AW Trading Software Limited
    5 (14)
    Fiyat seviyelerinin dökümü, gelişmiş istatistikler, TakeProfit hesaplaması ve 3 tür bildirim. Faydalar: Sonuçlarınızı yeniden çizmeyin Kesinlikle mumun kapanışında sinyal verin Yanlış Arıza Filtreleme Algoritması Herhangi bir trend stratejisiyle iyi gider. Tüm araçlarda ve zaman serilerinde çalışır Kılavuz ve talimat ->   BURAYA   / Problem çözme ->   BURAYA   / MT5 versiyonu ->   BURAYA Gösterge ile nasıl ticaret yapılır? AW Breakout Catcher ile sadece üç kolay adımda işlem yapın: Adım 1 - Pozi
    This is a unique  Gold Indicator On channel trading pullbacks and gives accurate entries on gold and major Fx Pairs on M15tf. It has the ability to pass any prop firm Challenge and get accurate entries on gold and major fx pairs. EA FOR PROP FIRM AND CHANNEL INDICATOR IS FREE ALONG WITH THIS POWERFUL INDICATOR ALONG WITH THE BEST SET FILE FOR FIRST 25 USERS. Strategy tester report is in comment section. INDICATOR FEATURES: INDICATOR IS BEST ON M15 GIVES ACCURATE ENTRIES  EA AND CHANNEL INDICATO
    Bu gösterge paneli, seçilen semboller için mevcut en son harmonik kalıpları gösterir, böylece zamandan tasarruf edersiniz ve daha verimli olursunuz / MT5 sürümü . Ücretsiz Gösterge: Basic Harmonic Pattern Gösterge sütunları Symbol : seçilen semboller görünecektir Trend: yükseliş veya düşüş Pattern : desen türü (gartley, kelebek, yarasa, yengeç, köpekbalığı, cypher veya ABCD) Entry : giriş fiyatı SL: zararı durdur fiyatı TP1: 1. kar alma fiyatı TP2: 2. kar alma fiyatı TP3: 3. kar alma fiyatı
    PRO Renko Sistemi, RENKO grafikleri ticareti için özel olarak tasarlanmış son derece hassas bir ticaret sistemidir. Bu, çeşitli ticaret araçlarına uygulanabilen evrensel bir sistemdir. Sistemi etkin piyasa sana doğru ters sinyallerine erişim hakkı denilen ses nötralize eder. Göstergenin kullanımı çok kolaydır ve sinyal üretiminden sorumlu tek bir parametreye sahiptir. Aracı, seçtiğiniz herhangi bir ticaret aracına ve renko çubuğunun boyutuna kolayca uyarlayabilirsiniz. Yazılımımla karlı bir
    F-16 Uçak Göstergesini tanıtıyoruz, ticaret deneyiminizi devrimleştirmek için tasarlanmış son teknoloji bir MT4 aracı. F-16 savaş uçağının eşsiz hızı ve hassasiyetinden ilham alan bu gösterge, finansal piyasalarda eşi benzeri olmayan performans sunmak için ileri algoritmalar ve son teknoloji teknolojileri bir araya getirir. F-16 Uçak Göstergesi ile gerçek zamanlı analiz sunarak yüksek doğruluklu ticaret sinyalleri üretirken rekabetin üzerine çıkacaksınız. Dinamik özellikleri, farklı varlık sınıf
    Yazarın diğer ürünleri
    The indicator detects the following types of Japanese candlesticks: Doji, Hammer and/or Hanging Man, Shooting Star and/or Inverted Hammer, Spinning Top, Maribozu. The indicator is intended for manual and/or automated trading within an Expert Advisor. There is a possibility to choose colors for bullish and bearish candlesticks. For automated trading, use any indicator buffer of the double type: 0, 1, 2 or 3, whose value is not zero!
    The indicator is intended for detecting big (long) and/or small (short) candlesticks. There is possibility of coloring the bullish and bearish candlesticks. The indicator can be used for manual and/or automated trading within an Expert Advisor. The indicator data that can be used for automated trading can be taken from one of four buffers of the double type: 0, 1, 2 or 3. Values must not be equal to zero. 
    The indicator of DeMark fractals. The indicator can be drawn on the basis of price data and on the basis of a moving average. There is a possibility to color the up and down fractals. The indicator can be used for manual and for automated trading within an Expert Advisor. For automated trading, use any indicator buffer of the double type: 0 - up fractals, 1 - down fractals! Values of the buffers must not be equal to zero.  A moving average is drawn on the basis of input parameters: Calc_Method 
    Stochastic Global
    Igor Semyonov
    4 (1)
    Description A universal colored indicator Stochastic. The rising and falling lines and the levels of the indicator can be colored.   The indicator can be calculated as the standard one on the basis of a price or as a derivative on the basis of the following nineteen other indicators included in the standard package of the MetaTrader 4 terminal: AD - an indicator of accumulation and distribution of volume. OBV - On Balance Volume. Volume - tick volume indicator. AC - indicator of acceleration. AO
    Description A universal colored indicator MACD Histo. The rising and falling of the indicator histogram can be colored.   The indicator can be calculated as the standard one on the basis of a price or as a derivative on the basis of the following twelve other indicators included in the standard package of the MetaTrader 4 terminal: AD - an indicator of accumulation and distribution of volume. OBV - On Balance Volume. Volume - tick volume indicator. Force - Force Index indicator. MFI - Money Flow
    Description A colored universal indicator MACD Line (MA convergence-divergence indicator, shown as a histogram). The rising and falling of the indicator histogram can be colored. The indicator can be calculated as the standard one on the basis of a price or as a derivative on the basis of the following twelve other indicators included in the standard package of the MetaTrader 4 terminal: AD - an indicator of accumulation and distribution of volume. OBV - On Balance Volume. Volume - tick volume i
    Description A universal indicator RSI together with moving averages based on it. Depending on the need, moving averages can be disabled. You can color the indicator lines and levels: lines of RSI, moving average lines and thresholds of overbought and oversold levels.   The indicator can be calculated as the standard one on the basis of a price or as a derivative on the basis of the following eighteen other indicators included in the standard package of the MT4 terminal: AD - an indicator of accu
    CCI Global
    Igor Semyonov
    5 (1)
    Description A universal indicator CCI together with moving averages based on it. Depending on the need, moving averages can be disabled. You can color the indicator lines and levels: lines of CCI, moving average lines and thresholds of overbought and oversold levels.   The indicator can be calculated as the standard one on the basis of a price or as a derivative on the basis of the following eighteen other indicators included in the standard package of the MetaTrader 4 terminal: AD - an indicato
    Description A multi-purpose multi-colored/multi-symbol indicator, which is a set of standard tools from the MetaTrader 4 terminal. The difference is that below the basic price chart it allows to calculate and build in a separate window any of the twenty indicators in a colored form, painting bulls and bears in different colors, for any financial instrument in accordance with the list below:  AD - an indicator of accumulation and distribution of volume. OBV - On Balance Volume. Force - Force Inde
    Description A colored universal indicator AO (Awesome Oscillator). The rising and falling of the indicator histogram can be colored.   The indicator can be calculated as the standard one or as a derivative on the basis of the following eleven other indicators included in the standard package of the MetaTrader 4 terminal: AD - an indicator of accumulation and distribution of volume. OBV - On Balance Volume. Volume - tick volume indicator. Force - Force Index indicator. MFI - Money Flow Index. ATR
    Description A colored universal indicator MACD Classic (MA convergence-divergence indicator) that combines two indicators: MACD Line and MACD Histo. The rising and falling lines, the signal line and the indicator histogram can be colored. The indicator can be calculated as the standard one on the basis of a price or as a derivative on the basis of the following twelve other indicators included in the standard package of the MetaTrader 4 terminal: AD - an indicator of accumulation and distributio
    Description The universal colored multicurrency/multisymbol indicator MACD Classic, consisting of two MACD indicators: MACD Line and MACD Histo. The indicator may be used with any broker, irrespective of the name of the financial instrument since it is necessary to manually enter the name as an input parameter. If you enter a non-existent or incorrect name of a financial instrument, you will receive an error message that this financial instrument is unknown (does not exist). Inputs Currency_Nam
    Description A colored universal indicator/oscillator based on crossing moving averages. The rising and falling lines of the indicator histogram can be colored. The combined use of the line and the histogram increases the level of the analysis when making a decision to open or close deals. The indicator can be calculated as the standard Price Oscillator or as a derivative on the basis of the following eleven other indicators included in the standard package of the MetaTrader 4 terminal: AD - an i
    Description A universal colored multicurrency/multi-symbol indicator RAVI. Was proposed by T. Chand as a trend indicator. RAVI means Range Action Verification Index. The indicator may be used with any broker, irrespective of the name of the financial instrument since it is necessary to manually enter the name as an input parameter. If you enter a non-existent or incorrect name of a financial instrument, you will receive an error message that this financial instrument is unknown (does not exist).
    Description A colored multicurrency/multisymbol oscillator of the market mood. The oscillator is designed for detecting the continuation or change of the market mood prior to its occurrence. An excellent example is the screenshots that show all the features of the oscillator. The oscillator may be used with any broker, irrespective of the name of the financial instrument since it is necessary to manually enter the name as an input parameter. If you enter a non-existent or incorrect name of a fin
    Description The indicator determines the appearance of internal bars on the chart, and paints them in accordance with the bullish and/or bearish mood. The indicator can notify of the appearance of a formed internal bar by playing a beep, as well as display the time remaining until the end of the formation of the current bar in the format of <d:h:m:s, where: < means the current bar. d - days. h - hours. m - minutes. s - seconds. The bullish and bearish mood can be colored. Inputs Sound_Play - a
    Description The indicator determines the appearance of the bars that signal of a reversal of current local moods and plays a beep. It also paints these bars in accordance with the bullish and/or bearish priority. You can select the color for bullish and bearish moods. Inputs Sound_Play - a flag that allows the sound notification. Use Detection of the reversal bar can be a signal to perform appropriate trading activities.  The indicator can be used for manual or automated trading in an Expert A
    Description The indicator determines the appearance of bars that notify of the reversal of the current trend, and paints them in accordance with the bullish and/or bearish mood. The indicator can notify of the appearance of a formed reversal bar by playing a beep, as well as display the time remaining until the end of the formation of the current bar in the format of <d:h:m:s, where: < means the current bar. d - days. h - hours. m - minutes. s - seconds. You can select the color for bullish and
    Description A universal colored multicurrency/multi-symbol indicator of moving averages: Moving Average, Double Moving Average, Triple Moving Average . The indicator is drawn in a separate window, so below the main trading chart a user can see the development of another financial instrument. It is very useful when considering the combined values of various moving averages for different financial instruments below the main trading chart.  The indicator may be used with any broker, irrespective of
    Description A universal colored indicator of moving averages: Moving Average, Double Moving Average, Triple Moving Average . The indicator provides various opportunities for the analysis of prices based on different ways of constructing moving averages in the window of the main financial instrument. You can color bullish and bearish moods. Inputs MA_Type - type of multiplicity: Moving Average. Double Moving Average. Triple Moving Average. MA_Period - the MA period. MA_Method - the averaging met
    Description A colored universal multicurrency/multi-symbol indicator Bollinger Bands to be drawn in a separate window below the main financial instrument. The rising and falling line of the main indicator and Bollinger Bands can be colored. The indicator can be calculated based on one of the eleven basic indicators included in the standard package of the MetaTrader 4 terminal: AD - an indicator of accumulation and distribution of volume. OBV - On Balance Volume. Force - Force Index indicator. MF
    Description A colored universal multicurrency/multi-symbol indicator Channel to be drawn in a separate window below the main financial instrument. The indicator uses the calculation method of the Price Channel indicator. The rising and falling line of the main indicator and the Channel lines can be colored. The indicator can be calculated based on one of the eleven basic indicators included in the standard package of the MetaTrader 4 terminal: AD - an indicator of accumulation and distribution o
    Description Keltner's colored channel indicator,also called STARC band, drawn in the main chart window. The indicator uses the calculation technique of the three drawing options: basic, improved and modified . The first two were proposed by Keltner, the third one - by a successful trader L. Rakshe. You can also search for your own best parameters of the indicator. The upper, middle and lower bands can be colored. The indicator includes the basic analytical tool of the market moods by Keltner. Th
    Description A colored universal multicurrency/multi-symbol indicator ZigZag to be drawn in a separate window below the main financial instrument. The indicator may be used with any broker, irrespective of the name of the financial instrument since it is necessary to manually enter the name as an input parameter. If you enter a non-existent or incorrect name of a financial instrument, you will receive an error message that this financial instrument is unknown (does not exist).  The indicator can
    Description A colored channel indicator Price Channel to be drawn on the main chart of a financial symbol. It can color bullish and bearish moods based on the middle line of the indicator, as well as change the color of the upper and lower lines of the channel. Purpose The indicator can be used for manual or automated trading in an Expert Advisor. Values of indicator buffer of the double type can be used for automated trading:  The middle line of the indicator - buffer 4. The upper line of the
    Description Candlesticks is a colored multicurrency/multy-symbol indicator. It shows a financial instrument as a candlestick chart in a separate window below the chart of the main financial symbo. The indicator may be used with any broker, irrespective of the name of the financial instrument since it is necessary to manually enter the name as an input parameter. If you enter a non-existent or incorrect name of a financial instrument, you will receive an error message that this financial instrume
    Description Candlestick Tools  is a colored multicurrency/multy-symbol indicator. It shows one of four standard indicators as a candlestick chart in a separate window below the chart of the main financial symbol. The indicator is calculated based on one of two indicators included in the standard package of the МetaТrader 4 terminal: CCI - Commodity Channel Index. RSI - Relative Strength Index. The default indicator is Commodity Channel Index. The indicator may be used with any broker, irrespecti
    Description Pivot Pro  is a universal color indicator of the  Pivot Points  levels systems. You can select one of its three versions:  Standard   Old , Standard New  and  Fibo . The system will automatically calculate the  Pivot Point  on the basis of market data for the previous day ( PERIOD_D1 ) and the system of support and resistance levels, three in each. It can also display price tags for each level. You can color the indicator lines. Only a method of calculation of the third level of supp
    Description A colored universal multicurrency/multi-symbol indicator MACD Line Smart (the indicator moving average convergence divergence is displayed as a histogram) based on double or triple moving average .  Comparing to the standard MACD this indicator is more sensitive to what allows generating advance signals. he indicator may be used with any broker, irrespective of the name of the financial instrument since it is necessary to manually enter the name as an input parameter. If you enter a
    Description A colored universal multicurrency/multi-symbol indicator  MACD Histo Smart  (MACD histogram) based on double or triple moving average .  Comparing to the standard MACD Histo this indicator is more sensitive to what allows generating advance signals. he indicator may be used with any broker, irrespective of the name of the financial instrument since it is necessary to manually enter the name as an input parameter. If you enter a non-existent or incorrect name of a financial instrument
    Filtrele:
    İnceleme yok
    İncelemeye yanıt