Spread Display
- Indikatoren
-
Dominik Mandok
 Forex, Commodities, Equities and Indices Trader, Programmer and Developer @ theinvestbay.com
 - Version: 1.1
- Aktualisiert: 30 November 2021
- Aktivierungen: 10
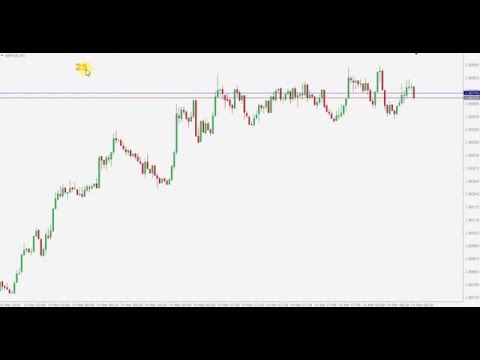
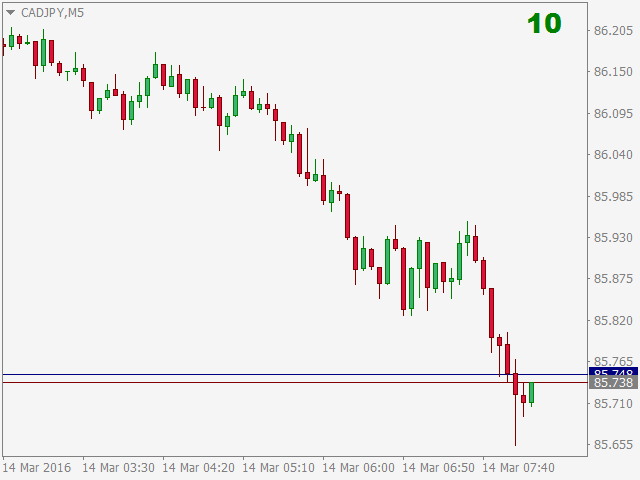
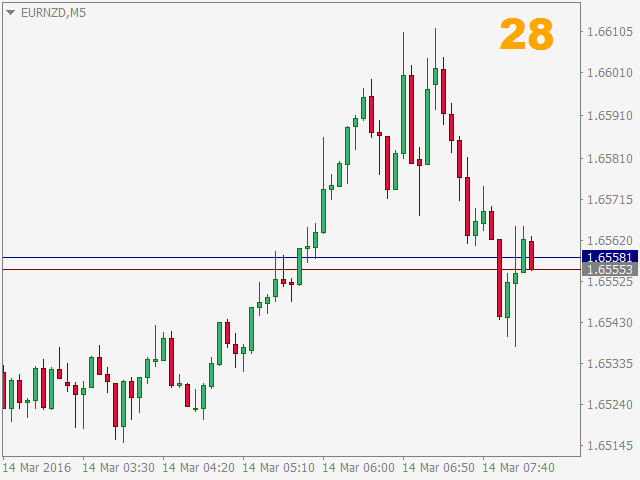
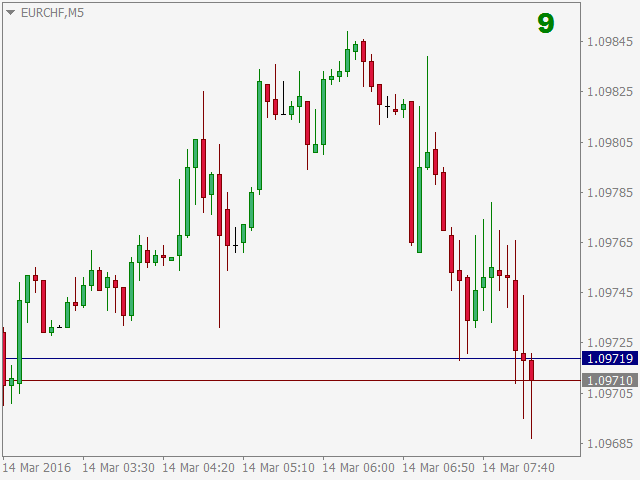
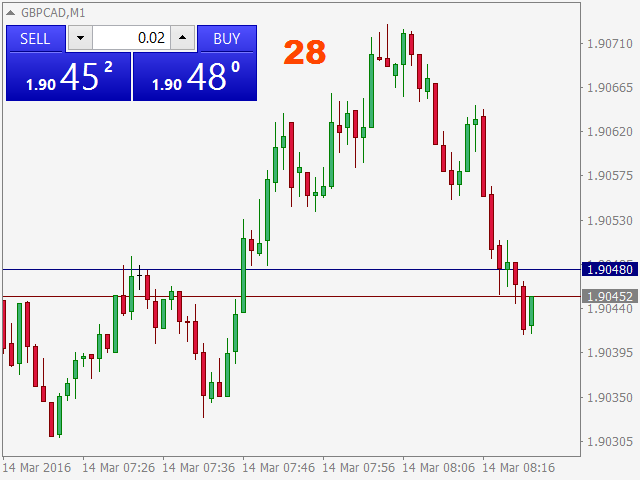
Spread Display ist ein einfacher, aber sehr hilfreicher Indikator, der eine Live-Überwachung des Spreads im Chartfenster ermöglicht. Wenn Sie diesen Indikator verwenden, müssen Sie Ihre Aufmerksamkeit nie wieder ablenken, indem Sie den aktuellen Spread-Wert woanders suchen. Von nun an ist alles klar und auf Augenhöhe, im Chart-Fenster des ausgewählten Währungspaares.
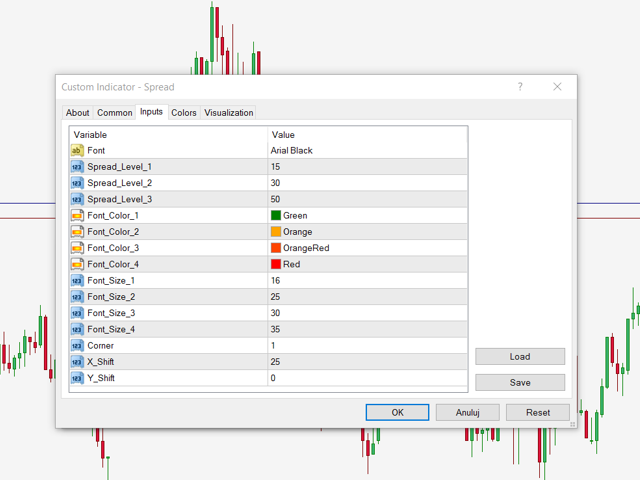
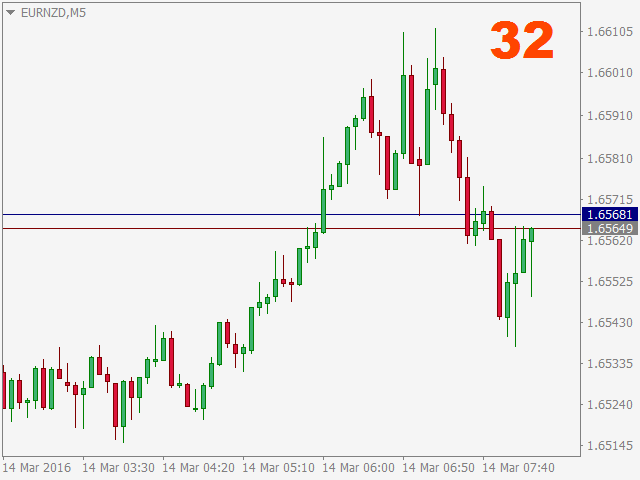
Der Indikator hat viele Einstellungen. Wir können eine beliebige Schriftart wählen und 3 Spread-Levels(Spread_Level_1, Spread_Level_2 und Spread_Level_3) einstellen, zwischen denen sich Größe und Farbe der Schriftart des angezeigten Spreads ändern werden. Wir können 4 verschiedene Werte für Schriftgröße und Schriftfarbe einstellen. Der erste Wert bezieht sich auf Werte, die niedriger als Spread_Level_1 sind, der zweite auf Werte zwischen Spread_Level_1 und 2, der dritte auf Werte zwischen Spread_Level_2 und 3 und der vierte natürlich auf Werte, die höher als Spread_Level_4 sind. Sie können auch die Position des Indikators festlegen, indem Sie die Ecke der Position und die Verschiebungen auf der x- und y-Achse auswählen.


Der Benutzer hat keinen Kommentar hinterlassen