CCI Pointer
- Indikatoren
-
Dominik Mandok
 Forex, Commodities, Equities and Indices Trader, Programmer and Developer @ theinvestbay.com
 - Version: 1.1
- Aktualisiert: 30 November 2021
- Aktivierungen: 10
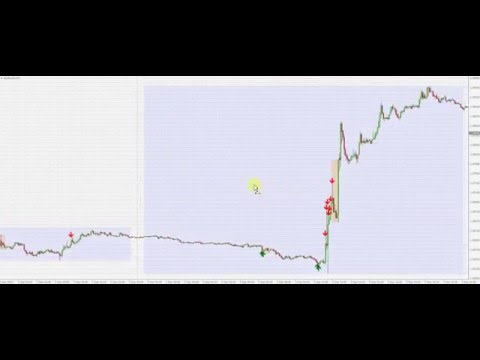
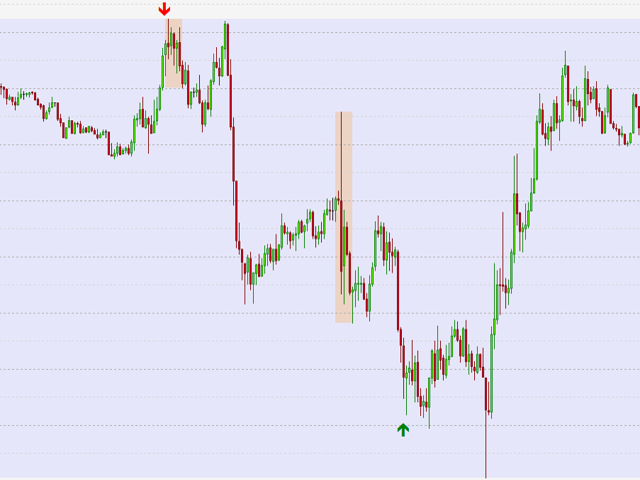
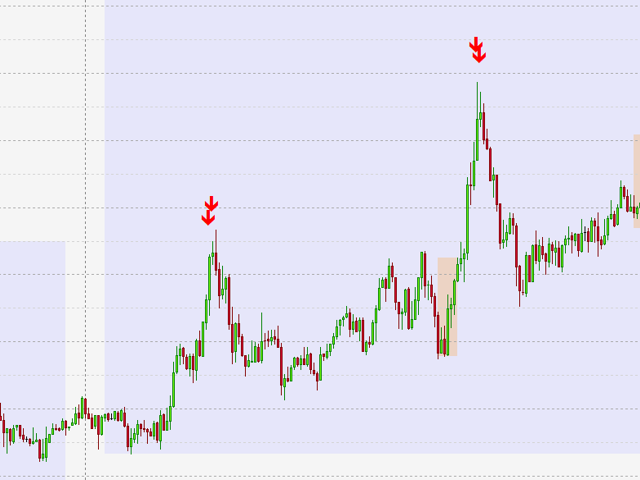
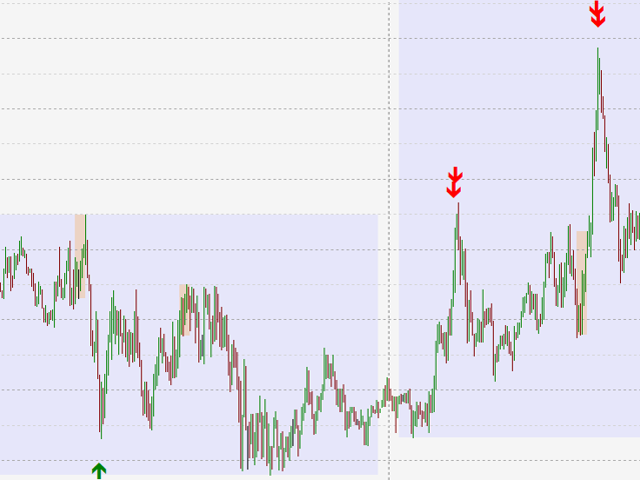
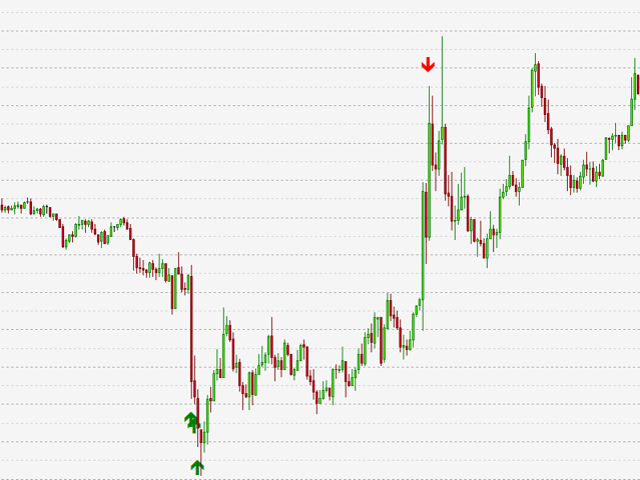
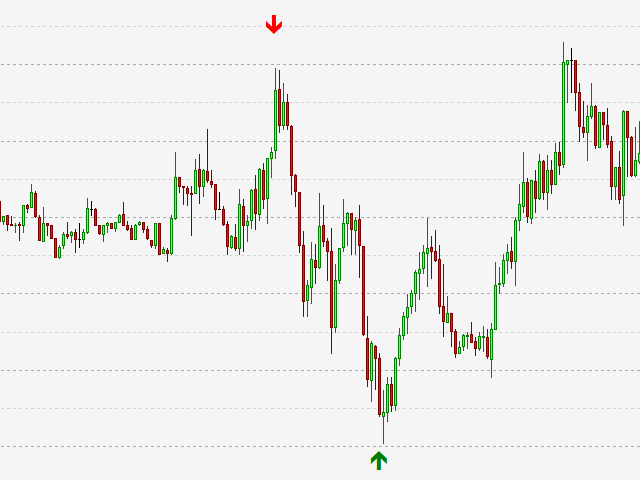
CCI Pointer ist ein Indikator, der einfach Pfeile im Chart-Fenster zeichnet, wenn der Wert des CCI (aus dem Parameter CCI_Period) über dem CCI_Level (roter abwärts gerichteter Pfeil) oder unter dem negativen CCI_Level (grüner aufwärts gerichteter Pfeil) liegt. CCI Pointer funktioniert auf allen Timeframes und allen Währungspaaren, Rohstoffen, Indizes, Aktien usw.
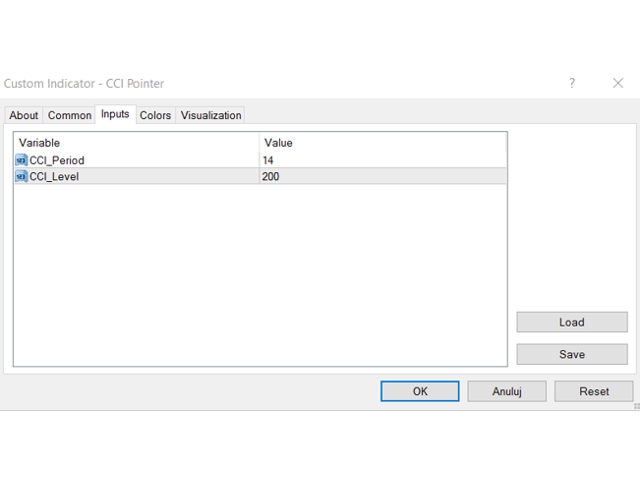
CCI Pointer hat nur zwei Parameter, CCI_Period und CCI_Level. Wenn Sie zum Beispiel CCI_Period=25 und CCI_Level=200 einstellen, zeichnet der Indikator Pfeile für Werte unter -200 (überverkauft) und über 200 (überkauft). Ein niedrigeres CCI-Level ist gleich einem negativen CCI_Level.
Der CCI-Zeiger funktioniert im Chart-Fenster, so dass Sie keinen CCI-Indikator in einem zusätzlichen separaten Fenster benötigen, um überverkaufte oder überkaufte Bedingungen zu erkennen, die oft zu Trendumkehrungen oder Rücksetzern führen. Denken Sie daran, immer vorsichtig zu sein, wenn wichtige politische und makroökonomische Nachrichten veröffentlicht werden, wenn der Kurs um wichtige Unterstützungs- und Widerstandsniveaus, Pivots oder runde Zahlen oszilliert, und natürlich immer besonders auf die Kursentwicklung zu achten.
Denken Sie daran, dass niemand außer Ihnen selbst für die von Ihnen getroffenen Anlageentscheidungen verantwortlich ist. Sie sind für Ihre eigenen Recherchen und Anlageentscheidungen verantwortlich. Viel Glück!
Der Benutzer hat keinen Kommentar hinterlassen