Bollinger Bands Grid
- Indikatoren
-
Dominik Mandok
 Forex, Commodities, Equities and Indices Trader, Programmer and Developer @ theinvestbay.com
 - Version: 1.1
- Aktualisiert: 30 November 2021
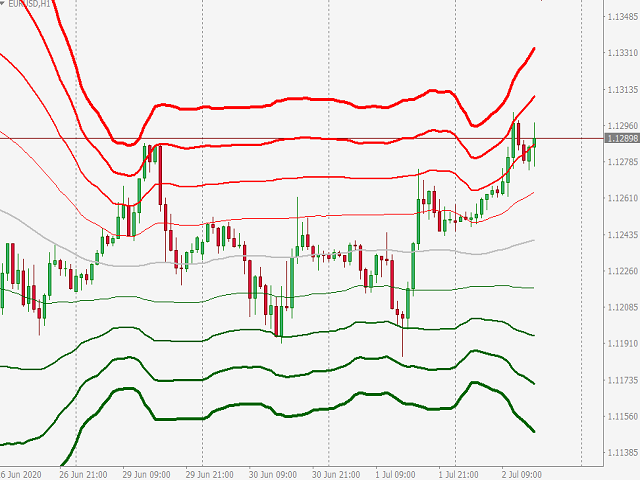
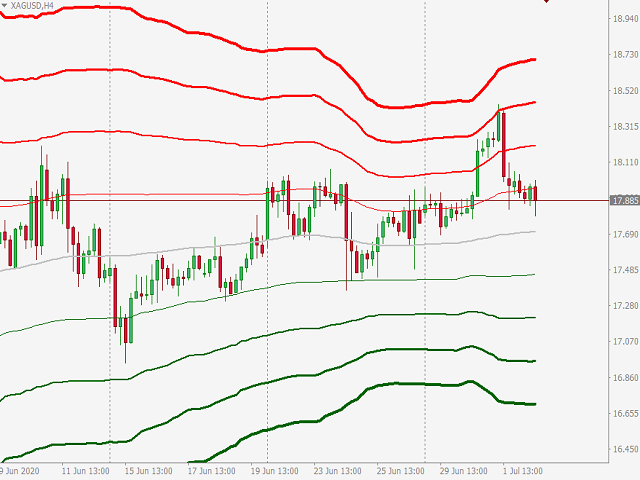
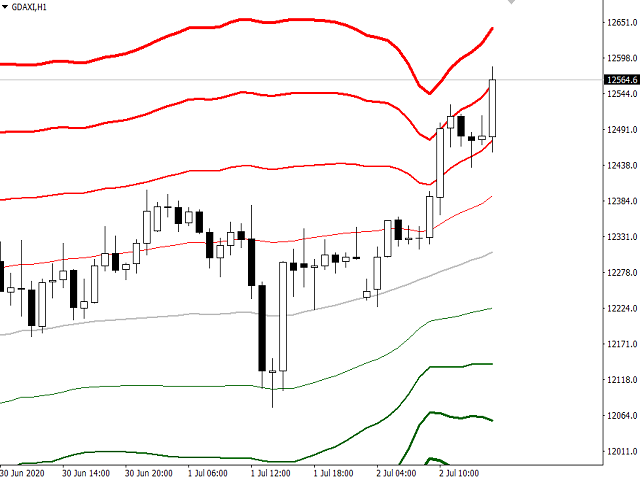
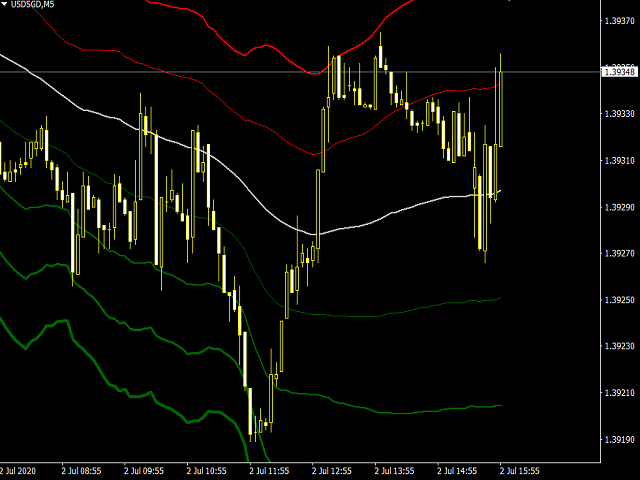
Es ist ein einfaches, aber nützliches Werkzeug zur Erstellung eines Gitters auf der Basis von Bollinger Bändern.
Es können nur 2 Parameter eingestellt werden:
1) "Periode" - die Periode aller sichtbaren Bollinger Bänder (d.h. 4) und 1 Gleitender Durchschnitt (Achse aller Bollinger Bänder),
2) "Abweichungsabstand" - der Abstand zwischen den Bollinger Bändern.
Natürlich können die Farben aller 9 Linien nach Belieben geändert werden.
Es funktioniert mit allem, was in Ihrem Market Watch verfügbar ist.
Viel Erfolg!