PipsFactoryMonthly
- Indikatoren
-
Alfred Kamal
 Hi , i am Alfred
i am MQL4 programmer since 15 years ago
Developing indicators , EAs and scripts
I focused on meeting customers requirements in terms of time, cost and quality - Version: 4.0
- Aktualisiert: 2 Dezember 2021
- Aktivierungen: 5
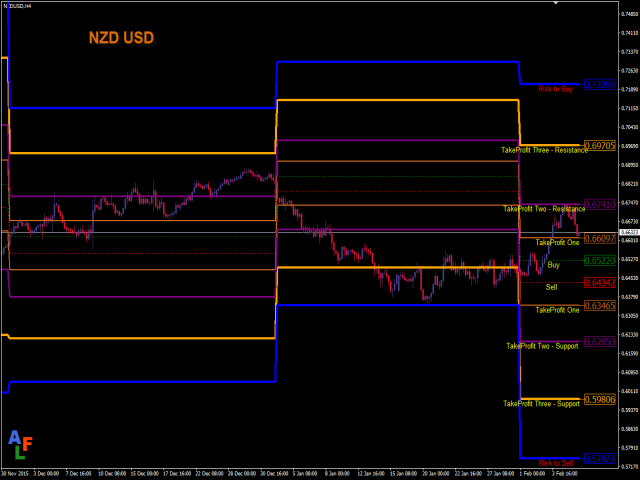
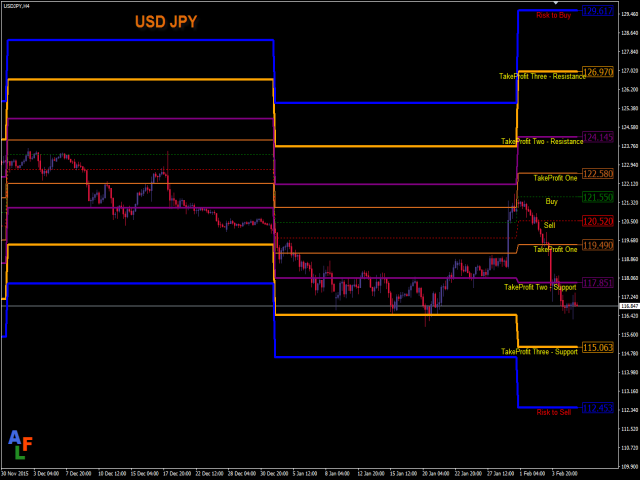
Dieser Indikator hängt von den Höchst- und Tiefstkursen der Währung im letzten Monat ab und dann habe ich einige geheime Gleichungen erstellt, um 10 Linien zu zeichnen.
Eigenschaften
- Sie werden wissen, zu welchem genauen Preis Sie in den Markt einsteigen sollten.
- Sie werden wissen, wann Sie aus dem Markt aussteigen sollten.
- Sie werden wissen, was Sie im Markt tun sollten:
- Kaufen
- Verkaufen
- Gewinn mitnehmen und es gibt 3 Ebenen, um Ihren Gewinn mitzunehmen
- Unterstützung
- Widerstand
- Risiko zu kaufen
- Risiko für den Verkauf
Signalarten und verwendeter Zeitrahmen
- Sie können diesen Indikator nur auf dem H4-Zeitrahmen verwenden und Sie müssen die historischen Daten des MN-Zeitrahmens herunterladen.
- Geben Sie einen Kaufauftrag ein, wenn der Preis auf der Kauflinie liegt, und es gibt 3 Ebenen, um Ihren Gewinn mitzunehmen
- Das erste Niveau ist die Gewinnmitnahme.
- Das zweite Niveau ist ebenfalls eine Gewinnmitnahme, aber es ist auch ein Widerstand.
- Das dritte Niveau ist auch eine Gewinnmitnahme, aber es ist auch ein Widerstand.
- Die vierte Linie ist das Risiko, mit einem Kaufauftrag in den Markt einzusteigen.
- Geben Sie einen Verkaufsauftrag ein, wenn der Preis die Verkaufslinie erreicht und es gibt 3 Niveaus, um Ihren Gewinn mitzunehmen
- Das erste Niveau ist eine Gewinnmitnahme.
- Das zweite Niveau ist auch eine Gewinnmitnahme, aber es ist auch eine Unterstützung.
- Das dritte Niveau ist ebenfalls eine Gewinnmitnahme, aber es ist auch eine Unterstützung.
- Die vierte Linie ist das Risiko, mit einem Verkaufsauftrag in den Markt einzusteigen.
- Währung: Es funktioniert mit jedem Währungspaar, aber die besten Ergebnisse werden mit EURUSD erzielt.
- Es ist sehr einfach zu bedienen.
Parameter
- Benachrichtigungen - wenn es falsch ist, gibt es überhaupt keine Benachrichtigungen, wenn es wahr ist, müssen Sie wählen, wie der Indikator Benachrichtigungen an Sie senden soll.
- Alert - Zeigt eine Meldung in einem separaten Fenster an.
- Push-Nachricht senden - Sendet Push-Benachrichtigungen an die mobilen Endgeräte, deren MetaQuotes-IDs auf der Registerkarte "Benachrichtigungen" angegeben sind.
- E-Mail senden - Sendet eine E-Mail an die im Einstellungsfenster der Registerkarte "E-Mail" angegebene Adresse.