Reversal and Breakout Signals
- Indikatoren
-
Minh Truong Pham
 Hello, my name is Pham and I am a programmer and trader! At here, I create amazing forex indicators and expert advisors for Metatrader.
I will try:
+ Provide best tools base on my 5 years experience as a trader and 10 years as a programmer. - Version: 1.0
- Aktivierungen: 5
Dieses innovative Tool wurde entwickelt, um Ihre Chartanalyse zu verbessern, indem es potenzielle Umkehr- und Ausbruchschancen direkt in Ihren Charts identifiziert. Es wurde sowohl für Anfänger als auch für erfahrene Trader entwickelt und bietet intuitive visuelle Anhaltspunkte für eine bessere Entscheidungsfindung. Schauen wir uns die wichtigsten Funktionen und deren Funktionsweise an:
###Key Features:
- 🔶 Dynamische Periodeneinstellungen: Passen Sie die Empfindlichkeit des Indikators mit benutzerdefinierten Perioden sowohl für den Indikator als auch für die Volumenstärke an.
- 📊 Volumenschwelle: Legen Sie einen Schwellenwert fest, um zu definieren, was ein starkes Volumen ausmacht, und ermöglichen Sie so die Identifizierung von signifikanten Marktbewegungen.
- 💡 Trendeinfärbung: Option zur Einfärbung von Kerzen während Trends, um bullische und bearische Marktbedingungen leichter zu erkennen.
- 🌈 Anpassbare Visuals: Wählen Sie Ihre bevorzugten Farben für Bullen-, Bären- und Ausbruchssignale und passen Sie das Diagramm Ihren Wünschen an.
- 🚨 F ortgeschrittenes Alarmsystem: Konfigurieren Sie Alarme für Umkehr- und Ausbruchssignale, damit Sie keine potenzielle Handelsmöglichkeit verpassen.
###Wie es funktioniert:
Die Kernlogik dreht sich um die Berechnung gewichteter gleitender Durchschnitte von Höchst- und Tiefstkursen über einen benutzerdefinierten Zeitraum, wobei die höchsten und niedrigsten Punkte innerhalb dieses Zeitraums identifiziert werden, um potenzielle Ausbruchs- oder Durchbruchsniveaus zu ermitteln und gleichzeitig die Menge des Rauschens zu reduzieren, daher die Verwendung von gleitenden Durchschnitten.
###
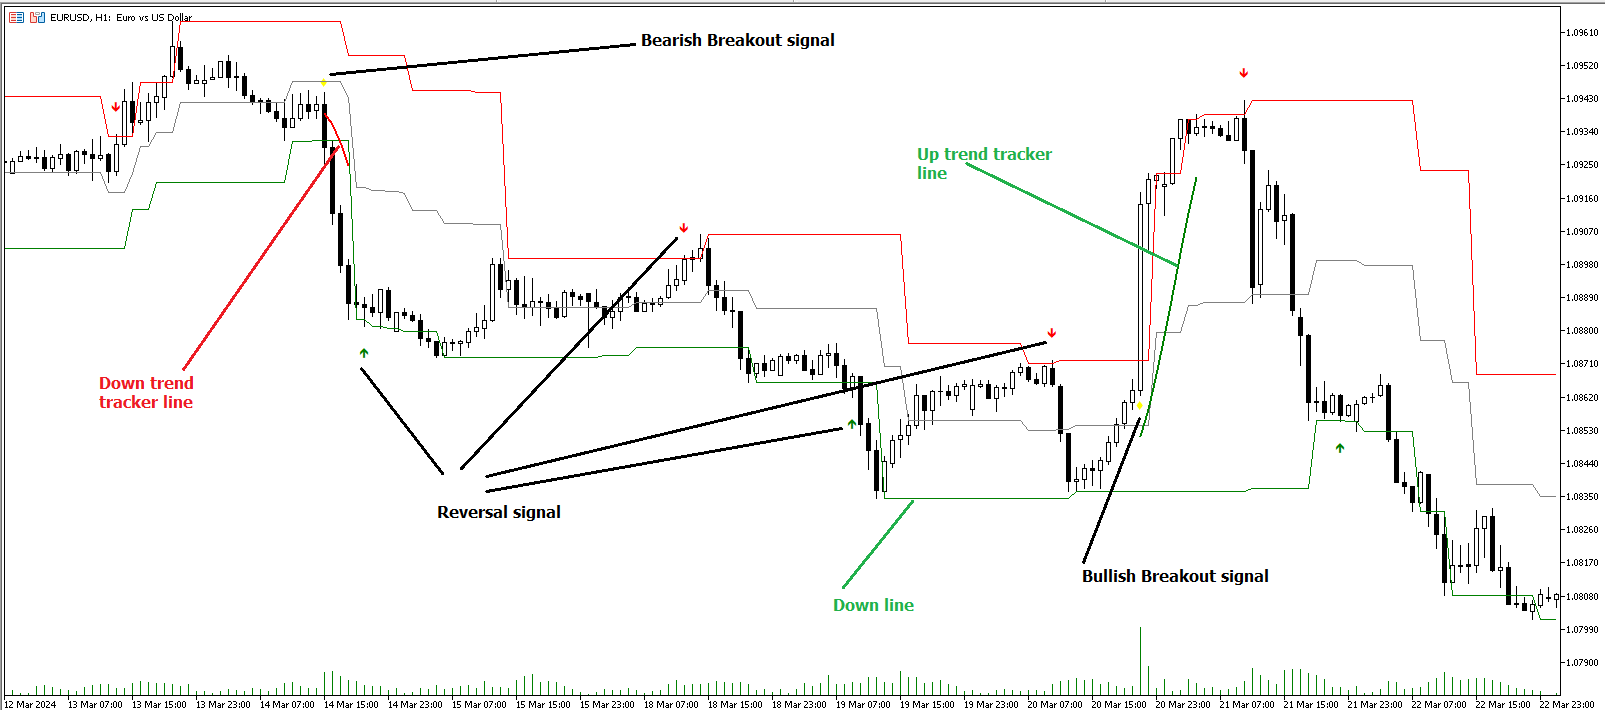
- Rauten stellen Ausbruchssignale dar. Ein Ausbruch nach oben wird unterhalb des Balkens markiert, wenn der Kurs über dem oberen Niveau schließt, was auf einen starken Kaufdruck hindeutet. Umgekehrt deutet ein bärischer Ausbruch oberhalb des Balkens auf starken Verkaufsdruck hin, wenn der Kurs unter dem unteren Niveau schließt.
- Das Tool verfügt auch über einenTrend Tracker, der den aktuellen Markttrend anhand des gleitenden Hull-Durchschnitts (HMA) aufzeigt. Dies kann Ihnen dabei helfen, sich bei Ihren Geschäften an der allgemeinen Marktrichtung zu orientieren.
Verwendung:
Um die Effektivität des Tools für Umkehr- und Ausbruchssignale zu maximieren, gehen Sie wie folgt vor:
1.🔧 Richten Sie Ihre Präferenzen ein:
- Passen Sie dieIndikatorperiode und die Volumenstärkeperiode an den Zeitrahmen Ihrer Handelsstrategie an. Durch diese Feinabstimmung kann der Indikator besser auf Ihre spezifischen Marktanalysebedürfnisse abgestimmt werden.
- Definieren Sie denSchwellenwert für starkes Volumen, um zwischen normalen und signifikanten Volumenbewegungen zu unterscheiden. Dies hilft dabei, Ausbruchs- oder Umkehrsignale mit größerer Sicherheit zu erkennen.
2.🎨 Anpassen des Bildmaterials:
- Wählen Sie Farben für Bullish-,Bearish- undBreakout-Signale, um visuell zwischen verschiedenen Arten von Marktaktivitäten zu unterscheiden. Diese Anpassung erleichtert eine schnellere Entscheidungsfindung beim Scannen von Charts.
3.🔍 Umkehrsignale:
-Bullische Umkehrung: Achten Sie auf ein Dreieck unter dem Balken, das eine potenzielle Aufwärtsbewegung anzeigt. Es wird erkannt, wenn der Kurs unter das untere Niveau eintaucht, aber darüber schließt, was auf eine Ablehnung niedrigerer Kurse hindeutet.
-Bearish Reversal: Ein Dreieck oberhalb des Balkens signalisiert eine potenzielle Abwärtsbewegung. Dies ist der Fall, wenn der Kurs über das obere Niveau steigt, aber darunter schließt, was auf eine Ablehnung höherer Kurse hindeutet.
4.📈 Trend- und Ausbruchssignale:
- Rauten stellen Ausbruchssignale dar. Ein Ausbruch nach oben wird unterhalb des Balkens markiert, wenn der Kurs über dem oberen Niveau schließt, was auf einen starken Kaufdruck hindeutet. Umgekehrt deutet ein bärischer Ausbruch oberhalb des Balkens auf starken Verkaufsdruck hin, wenn der Kurs unter dem unteren Niveau schließt.
- Das Tool verfügt auch über einenTrend Tracker, der den aktuellen Markttrend anhand des gleitenden Hull-Durchschnitts (HMA) aufzeigt. Dies kann Ihnen dabei helfen, sich bei Ihren Geschäften an der allgemeinen Marktrichtung zu orientieren.
###Kauf- und Verkaufssignale:
+ Der Indikator liefert Informationen, die vorschlagen, Kauf- und Verkaufsaufträge bei der Umkehrpfeil-Kerze zu platzieren und die Position zu verlassen, wenn der Preis die Durchschnittslinie kreuzt (Standard ist die graue Linie) oder ein Ausbruchssignal in die entgegengesetzte Richtung erscheint (Standard ist die orangefarbene Raute - ein bullisches Ausbruchssignal wird unter dem Tiefpunkt der Kerze angezeigt, während ein bärisches Ausbruchssignal über dem Hochpunkt der Kerze erscheint).