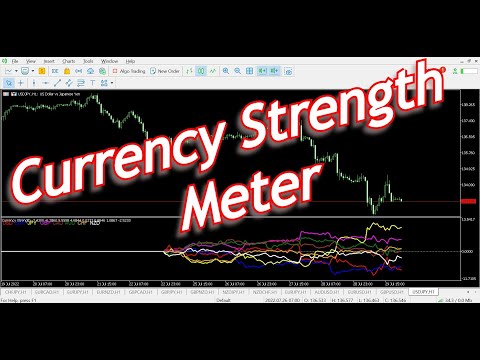
Currency Strength Meter Indicator
- 指标
- 版本: 2.0
- 更新: 22 九月 2022
Have you ever wondered which currency is the strongest at any particular time? Or which currency pair is trending the most. Well, the currency strength meter helps with just that. It compares USD, EUR, AUD, CHF, GBP, CAD and NZD depending on the timeline you have chosen in settings, and ranks them on the number of pips each has moved compared to the rest.
N/B: All currency charts of the above pairs must have loaded. You can do this by highlighting all major and minor currencies in Symbols lists, adding all major and minor currencies pairs in market list or opening the currencies pair charts.
For more on how to use this indicator: https://youtu.be/F6K_xBoXroQ
For more free stuff visit: https://abctrading.xyz