Trend Z MT4

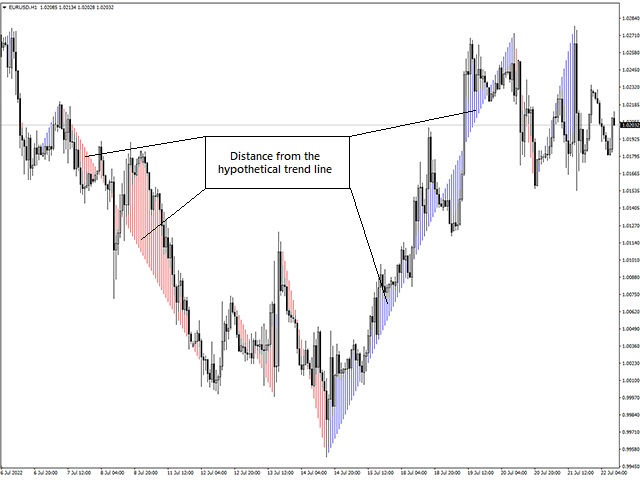
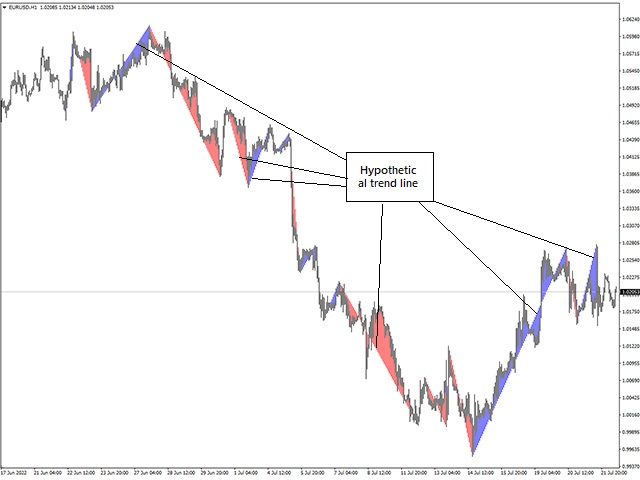
Hypothetical trend line display
Distance from the trend line
Can be used in all symbols
Can be used in all time frames

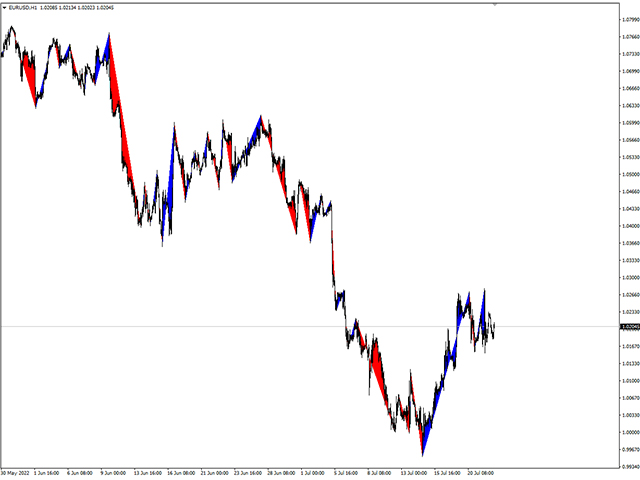
An interesting indicator for predicting small waves
The greater the distance from the trend line, the more likely it is to return to the trend line
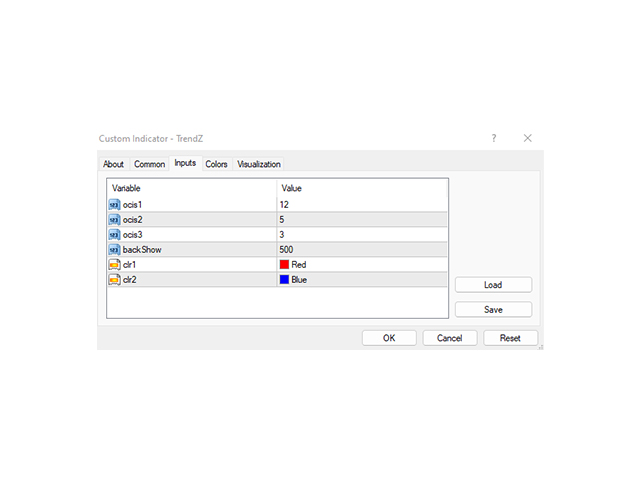
Settings:
The first three(osic 1,2,3):
are the same as the settings of the zigzag indicator
The bigger these numbers are, the bigger the trend lines and the longer the trend

Back Show:
The number of candles displayed

Clr1,2:
The color of the trend lines

If you need more settings, message me if you have any questions or suggestions


推荐产品
Follow The Line
Oliver Gideon Amofa Appiah
3.94 (16)
FOLLOW THE LINE GET THE FULL VERSION HERE: https://www.mql5.com/en/market/product/36024 This indicator obeys the popular maxim that: "THE TREND IS YOUR FRIEND" It paints a GREEN line for BUY and also paints a RED line for SELL.  It gives alarms and alerts of all kinds. IT DOES NOT REPAINT and can be used for all currency pairs and timeframes. Yes, as easy and simple as that. Even a newbie can use it to make great and reliable trades. NB: For best results, get my other premium indicators for more
FREE
Wise Men Indicator demo
Bohdan Kasyanenko
3 (2)
The indicator displays signals according to the strategy of Bill Williams on the chart. Demo version of the indicator has the same features as the paid, except that it can work only on a demo account . Signal "First Wise Man" is formed when there is a divergent bar with angulation.  Bullish divergent bar - with lower minimum and closing price in the upper half. Bearish divergent bar - higher maximum and the closing price at the bottom half. Angulation is formed when all three lines of Alligator
FREE
Donchian Trend Histogram
Mariusz Piotr Rodacki
Donchian channels are a tool in technical analysis used to determine the relative volatility of a market and the potential for price breakouts. Can help identify potential breakouts and reversals in price, which are the moments when traders are called on to make strategic decisions. These strategies can help you capitalize on price trends while having pre-defined entry and exit points to secure gains or limit losses. Using the Donchian channel can thus be part of a disciplined approach to managi
FREE
Free automatic fibonacci
Tonny Obare
4.67 (49)
Free automatic Fibonacci is an indicator that automatically plots a Fibonacci retracement based on the number of bars you select on the BarsToScan setting in the indicator. The Fibonacci is automatically updated in real time as new highest and lowest values appears amongst the selected bars. You can select which level values to be displayed in the indicator settings. You can also select the color of the levels thus enabling the trader to be able to attach the indicator several times with differe
FREE
PZ Penta O MT4
PZ TRADING SLU
2.33 (3)
The Penta-O is a 6-point retracement harmonacci pattern which usually precedes big market movements. Penta-O patterns can expand and repaint quite a bit. To make things easier this indicator implements a twist: it waits for a donchian breakout in the right direction before signaling the trade. The end result is an otherwise repainting indicator with a very reliable trading signal. The donchian breakout period is entered as an input. [ Installation Guide | Update Guide | Troubleshooting | FAQ | A
FREE
Super trend is one of the best trend indicators in metatrader 4 (MT4). Triple SuperTrend indicator is an indicator that consist of three super trend indicator that can be aranged. This indicator is built by mql4 language and doesn't provided by MT4 platform. Highly recommended using EMA SuperTrend Strategy Indicator if you want to get better result in here: https://www.mql5.com/en/market/product/91664 This indicator is easy to use, power full and has many benefits, there are: Using three indic
FREE
Kombajn Signal
Mariusz Piotr Rodacki
The indicator still has a few bugs but is ready for testing. This is my first indicator that determines entry and exit points. The entry point is based on breaking the peaks determined by a channel indicating highs and lows (invisible channels). TP1 is a probable target at which most positions can be closed. The channel determining the opening and closing of positions is based on different assumptions. The red stop loss line is determined based on lows and highs. The stop loss can be adjusted a
FREE
Support resistanses show
Meysam Ghasemi
1 (1)
.....................................hi....................... ................for showing high s and low s and support and resistanses .....................we have a lot of ways............................... it can be helpful for finding trends , higher highs , higher lows , lower highs , lower lows .......................today i write on of thems.......................... ........................you can enter the number of last support and resistanses .........................and it will dra
FREE
PZ Three Drives
PZ TRADING SLU
5 (2)
This indicator finds Three Drives patterns. The Three Drives pattern is a 6-point reversal pattern characterised by a series of higher highs or lower lows that complete at a 127% or 161.8% Fibonacci extension. It signals that the market is exhausted and a reversal can happen. [ Installation Guide | Update Guide | Troubleshooting | FAQ | All Products  |  Get Help ] Customizable pattern sizes Customizable colors and sizes Customizable breakout periods Customizable 1-2-3 and 0-A-B ratios It impl
FREE
Tipu Heikin Ashi Panel
Kaleem Haider
4.56 (18)
Tipu Heikin-Ashi Panel is the modified version of the original Heiken Ashi indicator published by MetaQuotes here . A professional version of this indicator is available here . Features An easy to use Panel that shows the Heiken Ashi trend of selected timeframe. Customizable Buy/Sell alerts, push alerts, email alerts, or visual on-screen alerts. Customizable Panel. The panel can be moved to any place on the chart or minimized to allow more space. Heikin means "the average", and Ashi means "foot
FREE
HMA Trend
Pavel Zamoshnikov
4.55 (71)
A trend indicator based on the Hull Moving Average (HMA) with two periods. The Hull Moving Average is an improved variant of the moving average, which shows the moment of trend reversal quite accurately. It is often used as a signal filter. Combination of two types of Hull Moving Averages makes a better use of these advantages: HMA with a slow period identifies the trend, while HMA with a fast period determines the short-term movements and signals in the trend direction. Features The movement d
FREE
交易实用必备工具指标 波浪自动计算指标,通道趋势交易 完美的趋势-波浪自动计算通道计算 , MT4版本 完美的趋势-波浪自动计算通道计算 , MT5版本 本地跟单复制交易 Easy And Fast Copy , MT4版本 Easy And Fast Copy , MT5版本 本地跟单复制交易 模拟试用 Easy And Fast Copy , MT4 模拟账号运行 Easy And Fast Copy , MT5 模拟账号运行 顺势指标又叫CCI指标,CCI指标是 美国 股市 技术分析   家唐纳德·蓝伯特(Donald Lambert)于20世纪80年代提出的,专门测量股价、外汇或者贵 金属 交易是否已超出常态分布范围。属于超买超卖类指标中较特殊的一种。波动于正无穷大和负无穷大之间。但是,又不需要以0为中轴线,这一点也和波动于正无穷大和负无穷大的指标不同。 相对强弱指标RSI是根据一定时期内上涨点数和下跌点数之和的比率制作出的一种技术曲线。能够反映出市场在一定时期内的景气程度。由威尔斯.威尔德(Welles Wilder)最早应用于期货买卖,后来人们发现在众多的图表技术分析中,
FREE
Traditional MACD MT4
Daniel Lewis
4.58 (55)
MetaTrader 4/5 中的 MACD 指标看上去与其它许多图表软件里的 MACD 不同。这是因为 MetaTrader 4/5 版本的 MACD 显示 MACD 曲线作为直方图,而传统上显示为曲线。此外,MetaTrader 4/5 版本使用 SMA 计算信号线,而根据 MACD 的定义,它应该使用 EMA。MetaTrader 4/5 版本也不计算实际的 MACD 直方图 (即 MACD 与信号线之间的差异)。这可能对那些 MetaTrader 4/5 的新手带来困惑,因为将 MACD 线显示为直方图,而未提供实际的 MACD 直方图。 这款指标按照其创造者 (Gerald Appel) 的定义显示 MACD,如同其它图表软件里显示的那样。而 MACD 线的计算采用 "快速" EMA 和 "慢速" EMA 之间的差异。信号线是 MACD 线的 EMA。MACD 直方图是MACD 和信号线之间的差异 (MACD 直方图可自行作为可靠的用作背离信号)。 True/False 启用开关,您可以显示/隐藏 MACD/信号线,以及 MACD 直方图。
FREE
Triple RSI
Pablo Leonardo Spata
1 (1)
LOOK AT THE FOLLOWING STRATEGY   WITH THIS INDICATOR.   Triple RSI   is a tool that uses the classic Relative Strength Indicator, but in several timeframes to find market reversals.    1.  ️ Idea behind the indicator and its strategy: In Trading, be it Forex or any other asset, the ideal is   to keep it simple, the simpler the better . The   triple RSI   strategy is one of the simple strategies that seek market returns. In our experience, where there is more money to always be won, i
FREE
Basic Harmonic Pattern
Mehran Sepah Mansoor
4.58 (59)
该指标可识别预测市场反转点的最常用谐波形态。这些谐波形态是外汇市场上不断重复出现的价格形态,暗示着未来可能的价格走势/ 免费 MT5 版本 此外,该指标还内置了市场进入信号以及各种止盈和止损。需要注意的是,虽然谐波形态指标本身可以提供买入/卖出信号,但建议您使用其他技术指标来确认这些信号。例如,在进行买入/卖出之前,您可以考虑使用 RSI 或 MACD 等震荡指标来确认趋势方向和动能强度。 该指标的仪表盘扫描器:( Basic Harmonic Patterns Dashboard ) 包括的谐波形态 加特里 蝶形 蝙蝠型 螃蟹 鲨鱼 赛弗 ABCD 主要输入 Max allowed deviation (%): 该参数是指谐波图形形成时的允许偏差。该参数决定了谐波图样的结构可以变化多少,而指标不会将其视为有效图样。因此,如果设置的百分比越高,则模式识别的灵活性就越大,而如果设置的值越低,则限制性就越大。例如:如果设定值为 30%,那么指标将把当前价格 ±30% 范围内符合形态比例的形态视为有效形态。 Depth: 该参数决定了谐波形态的每个波浪中必须出现的最少条数,也就
FREE
ZigZag Support Resistance MT4
Emmanuel Tshepang Mosweu
4.67 (3)
This indicator uses the Zigzag indicator to identify swing highs and swing lows in the price chart.    Once it has identified the swing highs and swing lows, it can use them to determine potential support and resistance levels. A support level is formed when the price drops and bounces back up from a swing low, indicating that there is buying pressure at that level. A resistance level is formed when the price rises and reverses downward from a swing high, suggesting selling pressure at that leve
FREE
The indicator detects and displays М. Gartley's Butterfly pattern. The pattern is plotted by the extreme values of the ZigZag indicator (included in the resources, no need to install). After detecting the pattern, the indicator notifies of that by the pop-up window, a mobile notification and an email. The pattern and wave parameters are displayed on the screenshots. The default parameters are used for demonstration purposes only in order to increase the amount of detected patterns. Parameters z
Toby Strategy Indicator
Ahmd Sbhy Mhmd Ahmd ʿYshh
The indicator rely on The Toby strategy >> The mother candle which is bigger in range than the previous six candles. A vertical line shows the last Toby Candle with the targets shown up and down. The strategy is about the closing price out of the range of the toby candle to reach the 3 targets..The most probable to be hit is target1 so ensure reserving your profits and managing your stop lose.
FREE
OrderBlock TS Roman
Vladislav Vlastovskii
3.8 (5)
Индикатор строит блоки заказов (БЗ) по торговой системе (ТС) Романа. Поиск блоков осуществляется одновременно на двух таймфремах: текущем и старшем (определяемым в настройках). Для оптимизации и игнорирования устаревших блоков в настройках задается ограничение количества дней в пределах которых осуществляется поиск блоков. Блоки строятся по правилам ТС состоящем из трех шагов: какую свечу вынесли (что?); какой свечой вынесли (чем?); правило отрисовки (как?).
FREE
FusionAlert StochRSI Master is an indicator available for MT4/MT5 platforms, it is a combination of RSI & Stochastic indicator which provide "alerts" when the market is inside "overbought and oversold" regions combined for both indicators, results in more precise and accurate signals to be used as a wonderful tool, in the form of "buy or sell" signals. This indicator comes with many customization options mentioned in the parameter section below, user can customise these parameters as needful. Jo
FREE
SmoothedRSI
Etsushi Ishizuka
SmoothedRSI 是一款自定义指标:先计算标准 RSI,然后对 RSI 数值应用所选的平滑方法。指标仅在独立窗口中显示一条平滑后的 RSI 线,输出范围为 0–100。 RSI 对短周期价格波动较为敏感,在某些市场条件下会出现较多细小震荡。本指标通过对 RSI 数值进行进一步平滑处理,以减少短期噪声,使更大级别的动量变化更容易观察。 基本规格 显示:一条平滑 RSI 线(0–100) 平滑方法:SMA / EMA / WMA / SMMA / ALMA 平滑周期可调 水平参考线:默认 70 / 50 / 30(可自行修改) 标准 RSI:默认隐藏;通过设置线条颜色可显示(隐藏选项) 使用说明 通过平滑线确认方向 与标准 RSI 相比,平滑 RSI 往往能更清晰地呈现上行/下行阶段以及切换点,适合用于关注动量趋势,而非短期细小波动。 将水平线(如 70 / 50 / 30)作为参考 Upper / Lower:用于整理市场状态的参考值,并不代表反转或延续的保证。 Middle(50):观察曲线在 50 上下停留的时间,可用于理解动量偏向。 平滑方法选择(一般参考) SMA:简单、中
FREE
SMA Indicator
Nitu Brijesh Yadav
Arrow Indicator (Buy/Sell Alerts) – Simple Yet Powerful Tool!             Product Version: 1.01           Indicator Type: Trend Reversal Signals           Timeframes Supported: All (Recommended: H1, H4, D1)           Key Features: Buy Signal: Green upward arrow () appears below the candle  Sell Signal : Red downward arrow () appears above the candle Accurate Trend Reversal Detection – Based on tried and tested SMA strategy. ️ Clean Chart View – Minimalist, non-i
FREE
CCI Trend finder
Jose Ramon Miranda Ramos
CCI Trend Finder indicator with different colors at levels 0, 100 and -100. The cross is a signal for "123 Exit" as presented by MPlay and used in Woodies CCI system. This exit signal is effective especially in short-term breakout trades, because it prevents early exiting at small corrections.  This indicator is great for having it as an extra tool for your analysis.
FREE
Head and Shoulders Pattern Indicator - Your Key to Recognizing Trend Reversals Unlock the power of pattern recognition with the "Head and Shoulders Pattern Indicator." This cutting-edge tool, designed for MetaTrader, is your trusted ally in identifying one of the most powerful chart patterns in technical analysis. Whether you're a novice or an experienced trader, this indicator simplifies the process of spotting the Head and Shoulders pattern, allowing you to make informed trading decisions. Key
FREE
The Magic SMA indicator is of great help in determining trend direction. It can be an excellent addition to your existing strategy or the basis of a new one. We humans can make better decisions when we see better visually. So we designed it to show a different color for rising and falling trends. Everyone can customize this in the way that suits them best. By setting the Trend Period, we can optimize it for longer or shorter trends for our strategy. It is great for all time frames. IF YOU NEED
FREE
Adjustable Fractal MT4
Dmitry Timin
4.77 (26)
Adjustable Fractal MT4 is a modification of Bill Williams' Fractals indicator. The fractal consists of a two sets of arrows - up (upper fractals) and down (lower fractals). Each fractal satisfies the following conditions: Upper fractal - maximum (high) of a signal bar exceeds or is equal to maximums of all bars from the range to the left and to the right; Lower fractal - minimum (low) of a signal bar is less or equal to minimums of all bars from the range to the left and to the right. Unlike a s
FREE
Smart RSI MT4
Mostafa Saad Saeed Shawara
产品标题 Smart RSI (MT4) – SmartView 系列的一部分 简短描述 具有独特用户体验的 RSI 指标,在 MetaTrader 平台上提供。提供以前不可用的高级功能,例如双击打开设置、隐藏和显示指标而无需删除它们,以及以全图表大小显示指标窗口。设计用于与 SmartView 指标系列的其余部分无缝协作。 概述 SmartView 系列通过创新功能为 MetaTrader 平台上的指标提供独特且与众不同的用户体验,使指标管理更快、更轻松。每个指标都配备了图表上的智能控制面板,显示基本信息并提供对所有重要功能的快速访问。 以前不可用的独特功能 SmartView 系列提供使指标工作更简单、更快速的高级功能: 双击打开设置: 无需在指标列表中搜索,双击面板上的指标名称即可直接打开设置窗口。 隐藏和显示指标: 一键隐藏和显示指标,无需从指标列表中删除和重新添加它们。 以全图表大小显示指标窗口: 在子窗口中,您可以最大化指标窗口以全图表大小显示,并临时隐藏其他窗口。 折叠和展开子窗口: 折叠子窗口以减少其高度并节省屏幕空间,然后在需要时将其展开回全尺寸。 重新排列子窗口:
FREE
SX Supply Demand Zones accurately identifies and draws high-probability Supply and Demand zones using a sophisticated algorithm. Unlike traditional indicators that clutter your chart, this indicator is designed with a focus on performance and a clean user experience. New Unique Feature: Interactive Legend System What truly sets this indicator apart from everything else is the Interactive Control Legend. You have a professional dashboard directly on your chart that allows you to: Show/Hide: Ins
FREE
FlatBreakout
Aleksei Vorontsov
FlatBreakout (Free Version) Flat Range Detector and Breakout Panel for MT4 — GBPUSD Only FlatBreakout is the free version of the professional FlatBreakoutPro indicator, specially designed for flat (range) detection and breakout signals on the GBPUSD pair only. Perfect for traders who want to experience the unique fractal logic of FlatBreakout and test breakout signals on a live market without limitations. Who Is This Product For? For traders who prefer to trade breakout of flat ranges (breakout,
FREE
Period Breakout Indicator
Komang Putra Riswanjaya
5 (1)
Overview The Period Breakout Indicator is a versatile tool designed for traders seeking to identify breakout opportunities based on customizable time periods. This indicator automatically determines the highest and lowest prices within a user-defined period, allowing you to tailor it precisely to your trading strategy. Key Features Customizable Time Periods: Define the start and end times based on your preferred trading hours or any specific period. The indicator will then calculate the highest
FREE
该产品的买家也购买
Neuro Poseidon MT4
Daria Rezueva
4.93 (30)
Neuro Poseidon is a new indicator by Daria Rezueva. It combines precise trading signals with adaptive TP/SL levels - creating best possible trades as a result! Message me and get  Neuro Poseidon Assistant  as a gift to automize your trading process! What makes it stand out? 1. Proven profitability on all assets and timeframes 2. Only confirmed BUY and SELL signals present on the chart 3. Adaptive TP & SL levels generated by the software for each trade 4. Easy to understand - suitable for all
M1 Sniper
Oleg Rodin
5 (23)
M1 SNIPER 是一款易于使用的交易指标系统。它是一个专为 M1 时间框架设计的箭头指标。该指标可以作为独立的系统在 M1 时间框架下进行剥头皮交易,也可以作为您现有交易系统的一部分使用。虽然该交易系统专为 M1 时间框架交易而设计,但它也可以用于其他时间框架。我最初设计此方法是为了交易 XAUUSD 和 BTCUSD。但我发现这种方法在其他市场交易中也同样有用。 指标信号既可以顺势交易,也可以逆势交易。我教授一种特殊的交易技巧,帮助您利用指标信号进行双向交易。该方法基于使用特殊的动态支撑位和阻力位区域。 购买后,您可以立即下载 M1 SNIPER 箭头指标。此外,我还为所有 M1 SNIPER 工具用户免费提供下方屏幕截图所示的 Apollo Dynamic SR 指标!这两个指标的组合可以帮助您更轻松、更准确地利用 M1 时间框架进行交易。 购买后请联系我,免费获取交易提示和奖励指标! 祝您交易成功!
Gann Made Easy
Oleg Rodin
4.84 (164)
Gann Made Easy 是一个专业且易于使用的外汇交易系统,它基于使用先生理论的最佳交易原则。 W.D.江恩。该指标提供准确的买入和卖出信号,包括止损和获利水平。您甚至可以使用推送通知在旅途中进行交易。 购买后请联系我,即可免费获得交易指导和超棒的额外指标! 您可能已经多次听说过江恩交易方法。通常 Gann 的理论不仅对于新手交易者而且对于那些已经有一定交易经验的人来说都是非常复杂的东西。这是因为江恩的交易方法在理论上并不那么容易应用。我花了几年时间来完善这些知识,并将最好的原则应用到我的外汇指标中。 该指标非常易于应用。您所需要的只是将其附加到您的图表并遵循简单的交易建议。该指标不断进行市场分析工作并寻找交易机会。当它检测到一个好的入口点时,它会为您提供一个箭头信号。该指标还显示止损和获利水平。 换句话说,当您像先生一样进行交易时,该指标会为您提供最佳江恩建议。江恩亲自告诉你此时此刻该做什么。但最好的部分是您不需要了解任何有关江恩交易原则的知识,因为该指标会为您完成整个市场分析工作。
Dynamic Forex28 Navigator
Bernhard Schweigert
4.43 (7)
Dynamic Forex28 Navigator - 下一代外汇交易工具。 当前 49% 折扣。 Dynamic Forex28 Navigator 是我们长期流行的指标的演变,将三种功能合二为一: 高级货币强度 28 指标 (695 条评论)+ 高级货币 IMPULSE 带警报 (520 条评论)+ CS28 组合信号(奖励)。 有关指标的详细信息 https://www.mql5.com/en/blogs/post/758844 下一代强度指标提供什么? 您喜欢的原始指标的一切,现在通过新功能和更高的精度进行了增强。 主要特点: 专有货币强度公式。  所有时间范围内的平滑和准确的强度线。 非常适合识别趋势和精确进入。 动态市场斐波那契水平(市场斐波那契)。  此指标独有的独特功能。 斐波那契应用于货币强度,而不是价格图表。 适应实时市场活动以获得准确的反转区域。 实时市场动量。  第 9 行显示市场是活跃还是被动。 对于定时交易至关重要。 全面的警报和显示。  每种货币最强的买入和卖出动量。 ​​28 对的双重动量买入和卖出。 超买/超卖警告外部范围和止损。 反转
Scalper Inside PRO
Alexey Minkov
4.74 (68)
Scalper Inside PRO Scalper Inside PRO 是一款适用于 MetaTrader 4 的日内趋势与剥头皮指标,使用专有算法快速识别市场方向和关键目标价位。它能够自动计算进场价、出场价以及多级止盈目标,并显示详细的绩效统计,让您了解不同交易品种和策略以往的表现情况,从而帮助您为当前的市场环境选择最合适的交易工具。此外,您还可以将自己的箭头指标轻松接入 Scalper Inside PRO,快速评估其统计数据和历史表现。 该指标可用于任何交易品种和任何周期(建议在 M5 上进行日内交易),并内置多种交易策略,因此既可以作为独立的剥头皮工具使用,也可以作为您交易系统中功能强大的分析组件。 主要功能 通过专有算法(Next‑Generation Trend Detection Algorithm,NG TDA)快速识别当前市场趋势。 自动计算日内交易的进场价、出场价和多级止盈目标。 内置策略与统计模块,用于评估不同市场环境下各品种的表现。 支持接入自定义箭头指标(PRO 模式),并计算其详细信号统计数据。 适用于外汇、金属、指数、股票、商品、期货和加密货币等各类市
Enigmera
Ivan Stefanov
5 (8)
ENIGMERA: 市场的核心 重要提示:MQL5.com 演示版本在策略测试器中运行,可能无法完全反映 Enigmera 的功能。请查看描述、截图和视频了解详细信息。如有任何问题,请随时联系我! 该指标的代码已完全重写。版本 3.0 增加了新功能并修复了自指标发布以来积累的错误。 简介 这个指标和交易系统是金融市场的一种独特方法。ENIGMERA 使用分形周期来精确计算支撑和阻力水平。它展示了真实的积累阶段,并提供了方向和目标。无论是在趋势中还是在修正中,这个系统都能工作。 它是如何工作的 指标的大部分功能通过图表左侧的按钮控制,使得能够快速响应不同的市场情况。 按钮 ON/OFF – 显示或隐藏整个指标。 Channel – 激活支撑通道,显示可接受的偏差范围。 Dev1 (第一偏差) – 指示价格在支撑偏差内的波动,信号表示市场正在整合或积累力量。 Dev2 (第二偏差) – 显示价格在偏差之间的波动,表示趋势形成和方向。 Dev3 (第三偏差) – 表示趋势的显著加速和高波动性。 45deg (45度) – 显示市场的节奏和相对于 45 度线的运动稳定性。 Tgt1/2
KT Alpha Hunter Arrows MT4
KEENBASE SOFTWARE SOLUTIONS
大多数箭头指标只给你一个信号,然后把剩下的判断全部留给你自己。KT Alpha Hunter Arrows 给你的,是一套完整的交易计划。 每一个信号箭头出现时,图表上都会同时绘制完整计划:入场线、止损位、四个止盈目标,以及实时 Edge 结论,告诉你当前品种和时间周期是否值得交易。套装中还包含 Trade Manager EA,在你手动入场后负责后续执行,让你在市场波动和情绪干扰下依然保持纪律。非重绘。只在K线收盘后给出信号。适用于 Forex、黄金、指数,以及你交易的其他任何品种。 核心功能 非重绘买入和卖出箭头,只在K线收盘后出现。 每个信号都带有入场线、结构性止损和四个止盈目标。 Edge Dashboard 会分别评估当前图表上的买入和卖出机会。 结论系统:No Edge、Marginal、Tradeable、Good 或 Strong。 一键 Auto Optimize 按钮,可根据当前品种和时间周期自动调整设置。 完整套装包含 Trade Manager EA,并内置五种专为本指标设计的交易管理方案。 Prop Firm Risk Panel 可在图表上实时追踪日内回撤
Trend Catcher ind
Ramil Minniakhmetov
5 (2)
趨勢捕捉指標 趨勢捕捉指標結合了作者獨有的客製化自適應趨勢分析指標,用於分析市場價格趨勢。它透過過濾掉短期噪音,並專注於潛在的動能強度、波動性擴張和價格結構行為,來識別真實的市場方向。此外,它還結合了平滑和趨勢過濾等客製化指標,例如移動平均線、相對強弱指標 (RSI) 和波動率過濾器。 您可以在這裡查看實際運行情況以及我的其他產品: https://www.mql5.com/en/users/mechanic/seller 請注意,我不會在 Telegram 上出售 EA 或任何設置,那是騙局。所有設定都可以在我的部落格上免費取得。 重要提示!購買後請立即聯繫我,以獲取使用說明和額外獎勵! 請注意,我不會在 Telegram 上出售 EA 或任何設置,那是騙局。所有設定都可以在我的部落格上免費取得。
PRO Renko System
Oleg Rodin
5 (30)
PRO Renko Arrow Based System for trading renko charts.  准确的信号交易任何外汇工具. 另外,我将免费提供系统的附加模块! PRO Renko系统是RENKO图表上高度准确的交易系统。该系统是通用的。 该交易系统可应用于各种交易工具。 该系统有效地中和了所谓的市场噪音,打开了获得准确反转信号的通道。 该指标易于使用,只有一个参数负责产生信号。 您可以很容易地使算法适应您感兴趣的交易工具和renko酒吧的大小。 我很乐意通过提供任何咨询支持来帮助所有客户有效地使用该指标。 祝您交易成功!购买后,立即写信给我! 我将与您分享我的建议和我的renko发电机。 另外,我将免费提供系统的附加模块!
Trend Lines PRO
Roman Podpora
5 (1)
TREND LINES PRO 帮助您了解市场真正的方向转变点。该指标显示真实的趋势反转点以及主要参与者重新入场的时机。 您可以看到 BOS线、 趋势变化和更高时间框架的关键水平——无需复杂的设置或不必要的干扰。信号不会重绘,并在K线收盘后仍然保留在图表上。 VERSION MT 5    -   与……搭配使用时,可发挥其最大潜力   RFI LEVELS PRO 指示器 该指标显示的内容: 实际变化 趋势(BOS 线) 一旦信号出现,它就始终有效!这与会重绘的指标有着重要的区别,后者可能会发出信号后又改变信号,从而导致资金损失。现在,您可以更精准、更准确地进入市场。此外,还有一个功能,会在箭头出现后为K线着色,直到达到目标价位(止盈)或出现反转信号为止。 重复条目   以及主要玩家的充值 为了提高寻找入场点时的视觉清晰度,我们创建了一个模块,该模块首先显示买入/卖出区域,并在该区域内寻找最佳入场点。此外,我们还加入了智能逻辑来管理止损位,该逻辑会随着时间的推移逐步降低止损位的大小,从而降低入场交易时的初始风险(移动止损位)。 信号强度水平(BOS) 该指标采用三个显著性等级来衡量
Genesis Matrix Pro is a professional multi-timeframe trend detection indicator designed to help traders identify high-quality market alignment with clarity and structure. It combines 12 different technical indicators into one visual alignment matrix, allowing traders to quickly see when market conditions are bullish, bearish, or neutral. A signal is generated only when the selected strategies are aligned, helping reduce noise and improve decision-making. PLEASE CONTACT ME AFTER PURCHASE TO GET
本产品已针对 2026 年市场进行更新,并针对最新 MT5 版本进行了优化。 价格更新通知: Smart Trend Trading System 目前价格为 $99 。 接下来的 30 次购买 后,价格将上涨至 $199 。 特别优惠: 购买 Smart Trend Trading System 后,请发送私信给我,即可免费领取 Smart Universal EA ,并将您的 Smart Trend 信号转换为自动交易。 Smart Trend Trading System 是一套完整的交易系统,具备不重绘、不回绘、不延迟的特点,专为希望获得更清晰信号、更准确趋势方向以及更有组织交易方式的交易者打造。 Online course , manual and download presets . 它将 10 多种交易工具 整合到一个系统中,包括趋势检测、反转区域、Smart Cloud、移动止损逻辑、支撑与阻力、K线着色、提醒以及多周期分析。 该系统旨在帮助您应对不同的市场环境: 趋势市场: 识别主要趋势,发现回调,跟随动能,并通过止损指导和移动止损选项寻找更清晰的入场机会。 震荡
PZ Trend Trading
PZ TRADING SLU
4.8 (5)
许多盈利交易者不仅知道如何识别市场趋势,而且也能把握趋势建立后的交易机会。 Pz 趋势交易 指标设计用来在趋势行情中尽可能的赚取利润。 已建立的趋势提供了一揽子交易机会,但大多数趋势交易指标完全忽视了它们,让交易者在趋势行情时完全不知道该如何做!一般趋势指标只通知有关的趋势变化,但根本不足以得到卓越的回报. Pz 趋势交易 指标比一般趋势指标显示多达 20 倍的交易 , 因为它注重所谓的市场时机。它不仅显示当前的市场趋势,也有回调,内柱线的突破和调整。它令您在趋势回调之后介入,安全的柱线内突破金字塔加仓,以及发现潜在的反转,和已知的调整。 趋势改变 一个趋势改变在市场方向变化时发生。趋势变化在图表上用带数字的彩色圆圈显示。蓝色 (1) 信号为上涨开始, 而红色 (1) 信号为下跌开始。趋势变化并非评估当前价格动作的结果, 它意味着交易设置是不定时地。如果您正确使用本指标, 在趋势变化时, 您将将已经入场 (参看下面的调整)。 回调 但凡趋势在运动中,行情上下抖动,盈利者收割利润,且其它参与者入场。趋势回调代表好的买入机会,通常是由主力获利离场导致。如果行情在回调后回归上行, 指标将
Step into the world of Forex trading with confidence, clarity, and precision using   Gold Indicator   a next-generation tool engineered to take your trading performance to the next level. Whether you’re a seasoned professional or just beginning your journey in the currency markets, Gold Indicator equips you with powerful insights and help you trade smarter, not harder. Built on the proven synergy of three advanced indicators, Gold Indicator focuses exclusively on medium and long-term trends eli
PZ Swing Trading
PZ TRADING SLU
5 (3)
Swing Trading 是第一个旨在检测趋势方向的波动和可能的反转波动的指标。它使用在交易文献中广泛描述的基准摆动交易方法。该指标研究多个价格和时间向量,以追踪总体趋势方向,并检测市场超卖或超买并准备好进行修正的情况。 [ 安装指南 | 更新指南 | 故障排除 | 常见问题 | 所有产品 ] 市场波动的利润不会被窃取 指示器始终显示趋势方向 彩色价格带代表机会基准 彩色虚线表示可能的反转波动 该指标分析其自身的质量和性能 它实现了一个多时间仪表板 可定制的趋势和波动周期 它实现了电子邮件/声音/推送警报 指示器为非重涂或重涂 什么是摇摆交易 摇摆交易是一种尝试在一天到一周内从证券中获得收益的交易方式,尽管某些交易最终可以保持更长的寿命。摇摆交易者使用技术分析来买入弱点和卖出力量,并有耐心等待这些机会的发生,因为在发生一波抛售浪潮之后购买证券而不是陷入抛售更有意义。 机会基准 关于历史数据的大量研究证明,适合于波动交易的市场倾向于在基线价格带上下交易,基线价格带由图表显示,使用平均真实区间计算得出。波动交易者使用基线,该策略是购买常态和卖出躁狂,或做空常态并掩盖沮丧。在没有疲
Current event:  https://c.mql5.com/1/326/A2SR2025_NoMusic.gif A. 什么是 A2SR ?   * 这是一个领先的技术指标(没有重绘,没有滞后)。  -  指导 : -- 在  https://www.mql5.com/en/blogs/post/734748/page4#comment_16532516 -- 和  https://www.mql5.com/en/users/yohana/blog A2SR 在确定支撑(需求)和阻力(供应)水平方面有一种特殊的技术。 与我们在网上看到的普通方式不同,A2SR 在确定实际 SR 级别时有一个独创的概念。 原技术不是从网上拿来的,也没有在网上公开过。 A2SR 将根据您的交易风格自动选择 SR 级别。 即使您正在更改时间范围,但 SR 级别仍将保留在其位置上。 因为实际的 SR 不是从你使用的时间范围内获得的。 A2SR 拥有完整的交易工具 。 实际支持(需求)和阻力(供应)的真正概念。 新闻事件和央行讲话的市场情绪。 新闻事件和趋势的主要货币强度 (MCS) 的真正概念
BTMM State Engine Pro MT4
Garry James Goodchild
BTMM State Engine Pro is a MetaTrader 4 indicator for traders who use the Beat The Market Maker approach: Asian session context, kill zone timing, level progression, peak formation detection, and a multi-pair scanner from a single chart. It combines cycle state logic with a built-in scanner dashboard so you do not need the same tool on many charts at once. What it does Draws the Asian session range; session times can follow broker server offset or be set in inputs. Tracks level progression (L
Dynamic Scalper System
Vitalyi Belyh
5 (1)
“ Dynamic Scalper System ”指标专为在趋势波内进行剥头皮交易而设计。 已在主要货币对和黄金上进行测试,并可与其他交易工具兼容。 提供顺势短线建仓信号,并提供额外的价格变动支持。 指标原理: 大箭头决定趋势方向。 在趋势波内,我们采用一种生成小箭头形式的剥头皮交易信号的算法。 红色箭头代表看涨方向,蓝色箭头代表看跌方向。 敏感的价格变动线会沿着趋势方向绘制,并与小箭头信号协同作用。 信号运作方式如下:当线在适当时刻出现时,将形成入场信号;在出现线时,持仓;线完成后,平仓。 建议的操作时间范围为M1 - H4。 箭头在当前K线上方形成,如果下一根K线已开仓,则不会重新绘制上一根K线上方的箭头。 输入参数 Trend Wave Period - 趋势方向(大箭头)的周期,改变趋势波的时间间隔。值 1 表示趋势方向的最长持续时间,参数值越大,持续时间越短。 Scalper Arrows Period - 信号箭头(小箭头)的计算周期,改变入场信号的生成频率。值 3 表示最频繁的生成频率,参数值越大,箭头频率越低,准确度越高。 这些参数可以根据不同的时间范
Neo Wave PRO
Nikolay Raykov
5 (1)
Price & Time Market Structure Indicator A professional market structure tool that analyzes waves through both price and time — not price alone. Main Description NeoWave PRO is a professional market structure indicator for MetaTrader 4 designed for traders who want to move beyond traditional one-dimensional wave tools such as ZigZag, swing indicators, and basic high/low systems. Most wave indicators analyze only one thing: Price. But a real market wave is not only a price movement. A true wave de
MonsterDash Harmonic Indicator
Paul Geirnaerdt
4.54 (26)
MonsterDash Harmonic Indicator is a harmonic pattern dashboard. It recognizes all major patterns. MonsterDash is a dashboard that displays all detected patterns for all symbols and (almost) all timeframes in sortable and scrollable format. Users can add their own user defined patterns . MonsterDash can open and update charts with the pattern found. Settings MonsterDash's default settings are good enough most of the time. Feel free to fine tune them to your needs. The color settings are for thos
Apollo SR Master
Oleg Rodin
5 (2)
Apollo SR Master 是一款支撑/阻力指标,其特殊功能使利用支撑/阻力区域进行交易更加便捷可靠。该指标通过检测局部价格顶部和底部,实时计算支撑/阻力区域,没有任何时间延迟。为了确认新形成的支撑/阻力区域,该指标会显示特殊信号,表明该支撑/阻力区域可以作为实际的卖出或买入信号。在这种情况下,支撑/阻力区域的强度会增强,因此从该区域进行交易的成功率也会更高。这正是该指标的核心理念。 SR区域也使止损和止盈的操作更加便捷。根据信号方向,可以将SR区域上方或下方的空间用作止损位。此外,相对的SR区域也可以用作潜在的止盈区域。 我还免费向所有 Apollo SR Master 指标的用户提供我的“Apollo 价格行为系统”指标。这两个指标结合使用将帮助您找到更好的入场点。 购买后请联系我,即可免费获得我的交易技巧以及我的“阿波罗价格行为系统”指标作为赠品!
Advanced Currency Strength28 Indicator
Bernhard Schweigert
4.91 (657)
目前40%的折扣 任何新手或专家交易者的最佳解决方案! 这个指标是一个独特的、高质量的、可负担得起的交易工具,因为我们纳入了一些专有的功能和一个新的公式。只需一个图表,你就可以读出28个外汇对的货币强度!想象一下,你的交易将如何得到改善,因为你的交易是在你的手中进行的。想象一下,你的交易将如何改善,因为你能够准确地确定新趋势或剥头皮机会的触发点? 用户手册:点击这里  https://www.mql5.com/en/blogs/post/697384 这是第一本,原版的! 不要买一个毫无价值的崇拜者的克隆品。 特别的 子窗口中的箭头显示强劲的货币势头GAP将指导你的交易! 当基础货币或报价货币处于超卖/超买区域(外盘斐波那契水平)时,在个人图表的主窗口中出现警告信号。 当货币力量从外围区间回落时,回撤/反转警报。 十字星模式的特别警报 可选择多个时间框架,以快速查看趋势! 货币强度线在所有的时间框架中都非常平稳,当使用较高的时间框架来识别总体趋势,然后使用较短的时间框架来确定精确的入口时,效果非常好。你可以根据自己的意愿选择任何时间框架。每个时间框架都由其自身进行了优化。
Auto Optimized Parabolic RSI: 高级 3D 动量引擎 大多数零售指标之所以失效,是因为它们依赖于静态输入,一旦市场波动率发生变化,这些输入就会崩溃。Auto Optimized Parabolic RSI 通过不断重新计算自身的数学优势,解决了“指标衰退”的问题,将机构级别的量化自适应能力直接引入您的 MT5 终端。 核心优势:定制的内存 3D 优化   标准的自动优化器通常会导致 MT5 平台卡顿,因为它们通过标准的指标调用使终端超载。该工具完全绕过了这些性能瓶颈。内部引擎采用定制的原生基于 RAM 的计算器构建,每次加载图表或更改时间周期时,它都会执行极速的 3D 网格搜索。它同时扫描 RSI 周期(频率)、SAR 步长(加速度)和 SAR 最大值(速度限制),在绝对的毫秒级时间内测试数以万计的参数组合,且完全不会拖慢您的平台。它不是仅仅寻找一个“不错”的设置,而是映射整个参数空间,以寻找资产当前动量结构的绝对全局最大值。 严格的财务评分与逼真的交易模拟   与基于抽象“指标点数”进行优化评分的业余工具不同,该引擎的 3.10 版本严格与资金数学挂钩。每
Advanced Supply Demand
Bernhard Schweigert
4.91 (300)
现在优惠 40%! 任何新手或专业交易者的最佳解决方案! 该指标是一款独特、高质量、且价格合理的交易工具,因为我们已经整合了许多专有功能和新公式。 依据此更新,您将能够显示双重时间帧区域。 您不仅可以显示一个较高的时间帧,还可以同时显示图表时间帧,加上更高的时间帧:显示嵌套时区。 供需双方所有交易者都会喜欢它。 :) 重要信息披露 高级供需的最大潜力,请访问 https://www.mql5.com/zh/blogs/post/720245   想象您的交易如何得以改善,是因为您能够精准定位入场或目标位吗? 构建于新的底层算法,它可以更轻松地识别出买卖双方之间的潜在失衡。 这是因为它以图形方式展示供需最强劲区域,及其过去的表现(显示旧区域)。 这些功能旨在帮助您更轻松地发现最佳入场区域和价位。 现在您可以针对您的交易品种和时间帧来优化和编辑区域强度! 高级供需指标适用于所有产品和时间帧。 它是一个新的公式,非常新的功能是两个区域强度函数可由用户输入进行调整! 这在交易中是一大优势。 当您学习如何使用专有功能,例如带有价格游离最小 X 因子的区域强度时,您能够判断该区域强劲与否。 供需
该指标旨在与艾略特波浪理论相结合,提供了两种不同的工作方式: 自动工作: 在此模式下,指标会自动检测图表上的所有五个动机波浪,并为您提供预测和潜在的逆转区域。它还可以提供警报和推送消息。这种自动功能简化了识别和分析艾略特波浪模式的过程。 手动工作: 此选项适用于喜欢手动方法的交易员,用于手动绘制九个不同等级的波浪。每个等级都可以在它们出现后通过调整图表上的绘制线条来单独定义。此功能简化了手动绘制波浪的过程,使其更加高效。需要注意的是,所有绘图数据将保存在平台的数据文件夹中,以备将来参考。 参数: Name: 指标名称。 Use_System_Visuals: 启用或禁用指标主题,以匹配交易平台的整体外观。 Explain_Comment: 允许启用或禁用波浪编号的解释性注释,有助于理解已识别的波浪。 Show_Last_Candle_Counter: 启用或禁用蜡烛计时器,提供有关当前蜡烛收盘的剩余时间的信息。 Candle_Counter_Color: 蜡烛计时器文本的颜色。 Basic_Wave_Color: 用于表示波浪的主要颜色。 Bullish_Wave_Color: 当检测
Introduction to Fractal Pattern Scanner Fractal Indicator refers to the technical indicator that makes use of the fractal geometry found in the financial market. Fractal Pattern Scanner is the advanced Fractal Indicator that brings the latest trading technology after the extensive research and development work in the fractal geometry in the financial market. The most important feature in Fractal Pattern Scanner is the ability to measure the turning point probability as well as the trend probabi
Bull versus Bear
Mohamed Hassan
4.5 (18)
Send us a message after your purchase to receive more information on how to get your  BONUS  for FREE  that works in great combination with Bull vs Bear ! Bull versus Bear is an easy-to-use Forex indicator that gives traders clear and accurate signals based on clear trend retests . Forget about lagging indicators or staring at charts for hours because  Bull vs Bear provides real-time entries with no lag and no repaint, so you can trade with confidence. Bull vs Bear  helps you enter trades during
Scalper Vault
Oleg Rodin
5 (37)
Scalper Vault 是一个专业的剥头皮系统,为您提供成功剥头皮所需的一切。该指标是一个完整的交易系统,可供外汇和二元期权交易者使用。推荐的时间范围是 M5。 该系统为您提供趋势方向的准确箭头信号。它还为您提供顶部和底部信号以及江恩市场水平。无论您拥有何种交易经验,该系统都易于使用。您只需要遵循简单的规则并每天重复该过程。 建议将此系统用于主要货币对。感谢您的关注! 请注意,该指标在策略测试器中可能无法正常工作。因此,我建议仅在模拟或真实账户的真实交易条件下使用该系统。 指示器提供所有类型的警报,包括推送通知。 购买指标后请与我联系。我将免费与您分享我的个人交易建议和出色的奖励指标! 祝您交易愉快,盈利!
The Propfolio Master Suite is the ultimate all-in-one analytical workstation for professional traders. Combining the power of the Beat The Market Maker (BTMM) methodology, Smart Money Concepts (SND/Liquidity), and Advanced Volume Profile, this suite replaces multiple different indicators with one optimized engine. Monitor up to 14 pairs simultaneously from a single chart, instantly identify market cycles, and seamlessly map institutional footprints with the click of a button. The Command Center
Harmonic Pattern Plus MT4
Young Ho Seo
4.44 (18)
Introduction Harmonic Patterns are best used to predict potential turning point. Traditionally, Harmonic Pattern was identified manually connecting peaks and troughs points in the chart. Manual harmonic pattern detection is painfully tedious and not suitable for everyone. You are often exposed under subjective pattern identification with manual pattern detection. To avoid these limitations, Harmonic Pattern Plus was designed to automate your harmonic pattern detection process. The functionality
作者的更多信息
Live Sup Res MT5
Claudia Ramona Angerer
4.89 (9)
Identification of support and resistance areas A useful indicator for traders completely free Can be used in all symbols Can be used in all time frames It has three different trends: short term, medium term, long term Settings: Clr1,2: You can change the color of the lines Type Trend: You can determine the trend Message me for questions, criticism and suggestions
FREE
Live Sup Res MT4
Claudia Ramona Angerer
4.33 (3)
Identification of support and resistance areas A useful indicator for traders completely free Can be used in all symbols Can be used in all time frames It has three different trends: short term, medium term, long term Settings: Clr1,2: You can change the color of the lines Type Trend: You can determine the trend Message me for questions, criticism and suggestions
FREE
My Point MT4
Claudia Ramona Angerer
4 (1)
Diagnosis of major and minor pivot Trend detection with many signals Can be used in all symbols Can be used in all time frames Settings: Back Show: The number of candles it displays If you need any adjustments, or have any questions or suggestions, message me How to trade: Blue: sell signal Red: buy signal Blue and red at the same time: no signal Exit signal: Opposite signal
Zone F MT4
Claudia Ramona Angerer
Forecasting the future by combining trend and average price with many signals Can be used in all symbols Can be used in all time frames Settings: BackShow: The number of candles displayed Osi: Main setting, the larger the number, the longer the trend If you need more settings, or have any questions or suggestions, message me How to trade: Blue: sell signal Red: buy signal Blue and red at the same time: no signal
Hunting Trend MT4
Claudia Ramona Angerer
1 (1)
66% discount only for the first 5 buyers (4 left), main price: 300 $ Show the signal as a line graph Prediction of 10 future candles and advanced display Prediction of individual candles graphically Can be used in the gold symbol Can be used in 15 minutes time frame Can be used only in gold symbol and only 15 minutes time frame How the indicator works: Using complex mathematical calculations, it predicts the future 10 candles. The predictions of this indicator are based on price. Therefore,
BTC Gold MT4
Claudia Ramona Angerer
1.25 (4)
An expert based on artificial intelligence ( AI ) For GOLD (XAUUSD) and BITCOIN (BTCUSD) in time frame 30 minutes, 1 and 4 hours and daily Has a TP and a SL Without the use of dangerous strategies such as martingales and hedges Best time frame: M30 , Best currency pair: GOLD Get EURUSD Expert for free after buying(or renting) this Expert. For more information, send a message after buying(renting).  Symbol:                     GOLD (XAUUSD) and BITCOIN (BTCUSD)  Time frames:             M30 , H
Hero EA MT4
Claudia Ramona Angerer
2.8 (5)
This expert will only be sold (or rented) to 100 people (0 left) At the request of those who rented, we increased the capacity An Expert with combining artificial intelligence (Ai) and classic strategies Combination of more than 10 famous indicators and patterns and private indicators and professional strategies and artificial intelligence Without using risky strategies like martingale and hedge Profit limit and loss limit for all trades In the most important currency pairs of the forex market
My Point MT5
Claudia Ramona Angerer
Diagnosis of major and minor pivot Trend detection with many signals Can be used in all symbols Can be used in all time frames Settings: Back Show: The number of candles it displays If you need any adjustments, or have any questions or suggestions, message me How to trade: Blue: sell signal Red: buy signal Blue and red at the same time: no signal Exit signal: Opposite signal
Zone F MT5
Claudia Ramona Angerer
Forecasting the future by combining trend and average price with many signals Can be used in all symbols Can be used in all time frames Settings: BackShow: The number of candles displayed Osi: Main setting, the larger the number, the longer the trend If you need more settings, or have any questions or suggestions, message me How to trade: Blue: sell signal Red: buy signal Blue and red at the same time: no signal
Hunting Trend MT5
Claudia Ramona Angerer
66% discount only for the first 5 buyers (4 left), main price: 300 $ Show the signal as a line graph Prediction of 10 future candles and advanced display Prediction of individual candles graphically Can be used in the gold symbol Can be used in 15 minutes time frame Can be used only in gold symbol and only 15 minutes time frame How the indicator works: Using complex mathematical calculations, it predicts the future 10 candles. The predictions of this indicator are based on price. Therefore,
BTC Gold MT5
Claudia Ramona Angerer
1.86 (7)
An expert based on artificial intelligence ( AI ) For GOLD (XAUUSD) and BITCOIN (BTCUSD) in time frame 30 minutes, 1 and 4 hours and daily Has a TP and a SL Without the use of dangerous strategies such as martingales and hedges Best time frame: M30 , Best currency pair: GOLD Get EURUSD Expert for free after buying(or renting) this Expert. For more information, send a message after buying(renting).  Symbol:                     GOLD (XAUUSD) and BITCOIN (BTCUSD)  Time frames:             M30 , H
Hero EA MT5
Claudia Ramona Angerer
1.5 (4)
This expert will only be sold (or rented) to 100 people (0 left) At the request of those who rented, we increased the capacity An Expert with combining artificial intelligence (Ai) and classic strategies Combination of more than 10 famous indicators and patterns and private indicators and professional strategies and artificial intelligence Without using risky strategies like martingale and hedge Profit limit and loss limit for all trades In the most important currency pairs of the forex market
筛选:
无评论
回复评论