VWAP indicator for MT4
- 指标
-
Renaud Herve Francois Candel
 ITC SOFTWARE is a technology company based in the United States since 2010.
🟠🔴 The company develops financial software and indicators for different trading platforms:
-Metatrader 4 and Metatrader 5
-TradingView
-NinjaTrader - 版本: 1.70
- 更新: 2 七月 2023
- 激活: 5
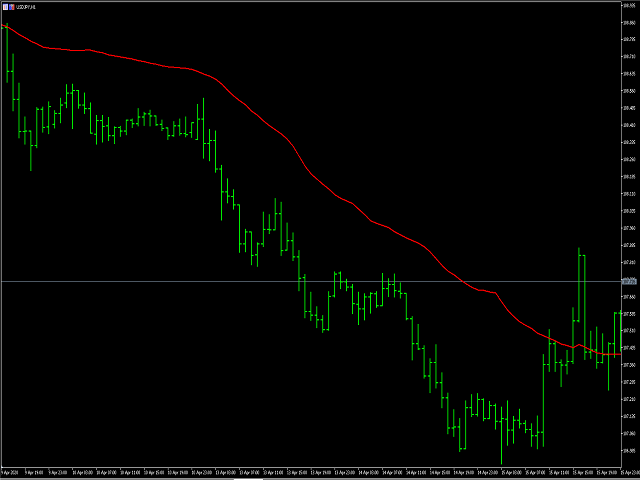
Moving VWAP Indicator
Moving VWAP is an important indicator drawing the Volume-Weighted Average Price (VWAP).
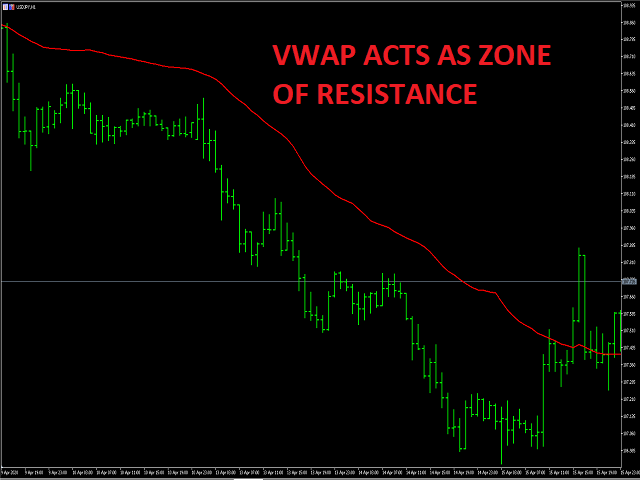
The VWAP is a reference used by institutional traders and acts as a level of support / resistance.
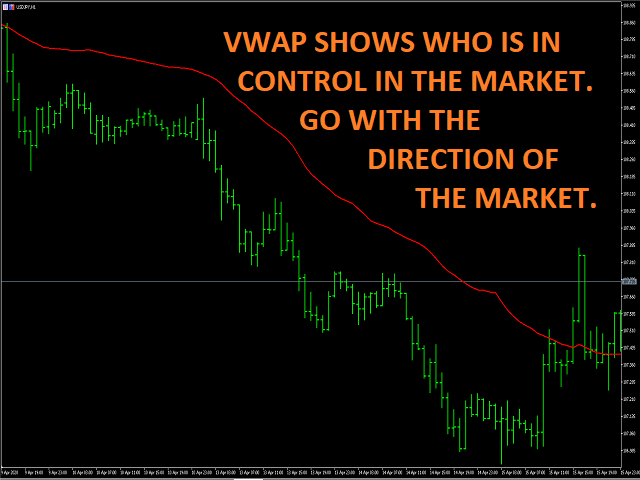
If price is above VWAP then means market is bullish.
If price is below VWAP then means market is bearish.
It can be used to enter in the market with low risk (near VWAP) and also identify the correct direction of the market.
The Moving VWAP is as simple as a Simple Moving Average. The main difference is that usual moving averages are calculated with price alone.
The VWAP is calculated with price and volume. Therefore it is more accurate and represents the real mean price in the market.
The Moving VWAP can be used with any instrument where you have volume data.
The Moving VWAP can be used with any time frame.
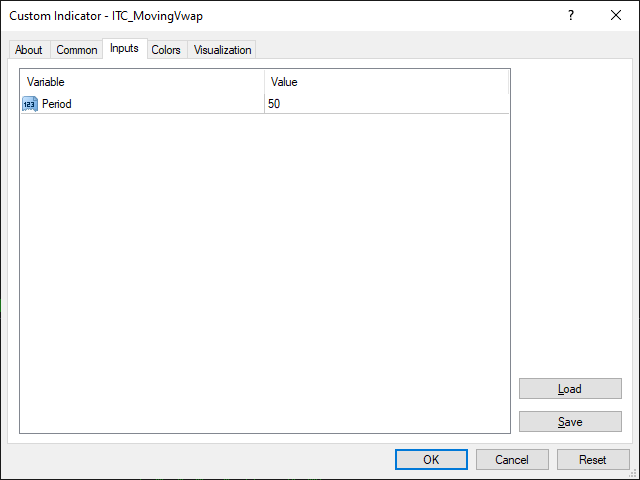
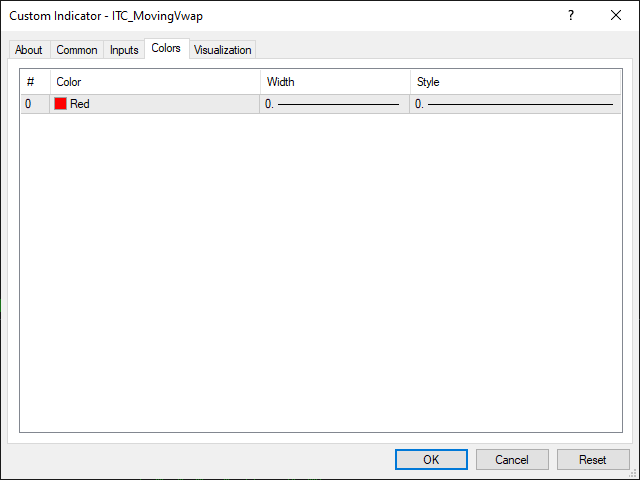
Inputs of the indicator are:
- Period - period to be used for the calculation of the moving average
The indicator can be used with any time frame.
The indicator can be used with any class of assets (providing volume data): Forex, Stocks, Futures, Commodities, Cryptos.
Forex volume is 90% reliable (not 100%) and this is enough to have an accurate indication of volume.
Beware that some indices do not produce volume (SP500) and cannot be used with the VWAP. In this case the futures (ES for SP500, for instance) can be used to calculate VWAP using volume.
Other indicators for MT4:
We developed more than 60 indicators and utilities for Metatrader 4 and Metatrader 5.
Indicators for MT5:
All our indicator are developed both for MT4 and MT5.
List of all our indicators:
👉 You can get the complete list of our indicators visiting our profile page.