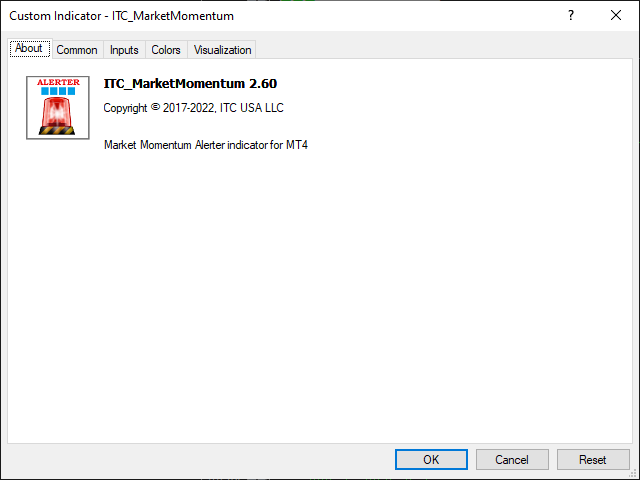
Market Momentum Alerter for MT4
- 指标
-
Renaud Herve Francois Candel
 ITC SOFTWARE is a technology company based in the United States since 2010.
🟠🔴 The company develops financial software and indicators for different trading platforms:
-Metatrader 4 and Metatrader 5
-TradingView
-NinjaTrader - 版本: 2.80
- 更新: 4 七月 2023
- 激活: 5
Market Momentum Alerter
Market Momentum Alerter will inform you about danger to operate in the market.Imagine you see a very nice setup (Forex, Stocks, Indices) and you decide to place your trade...
And you finally lose your trade and don't understand what happened.
This can happen due to big operations in the market carried out by banks and big institutions.
These operations are invisible for most people.
Now with the Market Momentum Alerter you will be able to detect those operations... and stay out to avoid losing your money.
When you have an alert you will have to stop trading for 10 minutes.
If there are no new alerts then you will be able to resume trading.
You must place the Market Momentum Alerter in each pair you want to trade. You can use the indicator in any time frame.
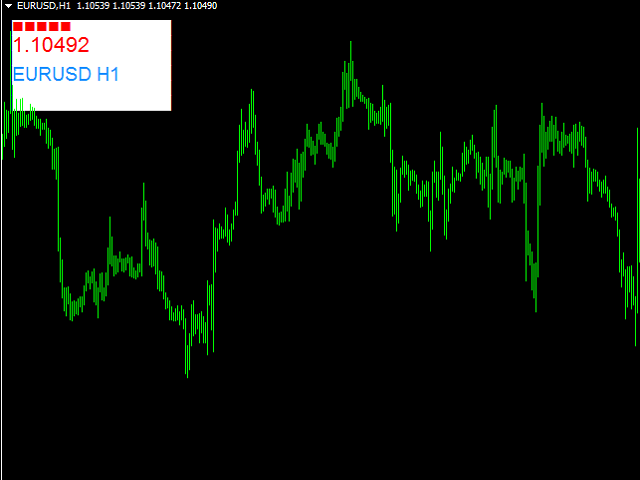
The indicator comes as a graphical shape displaying:
- symbol and time frame of your chart
- level of activity in the market (if level is more than 6 out of ten then you have to be cautious)
- price (Ask, Bid, or mean price of Bid and Ask)
Alerts are given with sound and with the activity level in your chart.
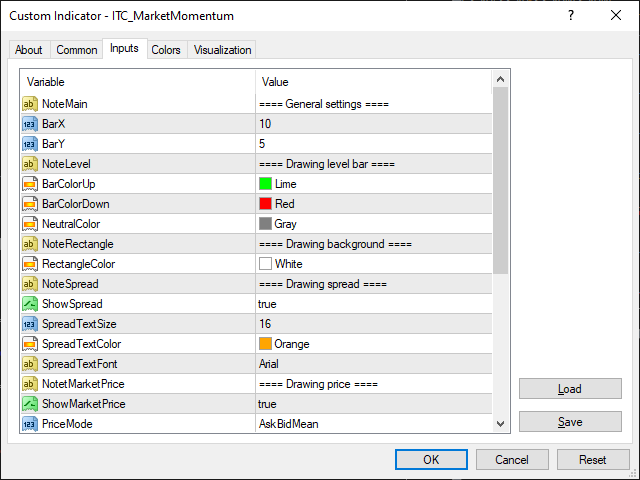
Inputs of the indicator are:
- BarX/BarY : X and Y coordinates where the indicator should be displayed in your chart
- BarColorUp/BarColorDown : colors to display the bar level
- RectangleColor : color of background shape to be used
- PriceMode (Ask, Bid, AskBidMean) : type of price to display in the shape
- SoundAlert (True/False) : to listen to sound alerts
- TestSound (True/False) : to check at init time that sound alerts are working
The indicator can be used with any type of asset class : Forex, Stocks, Indices, Futures, Commodities and Cryptos.
Take care that initialization of indicator might last 10 to 30 seconds. So be patient please.
Other indicators for MT4:
We developed more than 60 indicators and utilities for Metatrader 4 and Metatrader 5.
Indicators for MT5:
All our indicators are developed both for MT4 and MT5.
List of all our indicators:
You can see the complete list of our indicators visiting our profile page.