Lisek Stochastic
- 指标
-
Darius Hans Lischka
 I am a professional software developer in Germany and Switzerland with over 30 years of experience.
My focus is the hardware-related programming of embedded systems, robots and machine control.
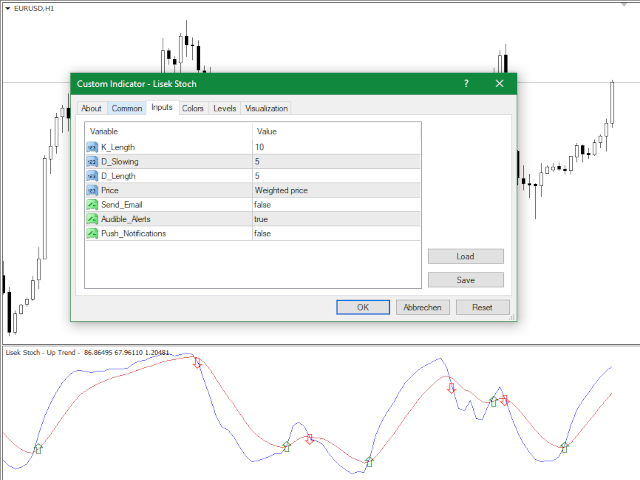
Very good knowledge of C / C ++ / C # and .NET, Python, Java and others. - 版本: 1.1
- 更新: 23 四月 2021
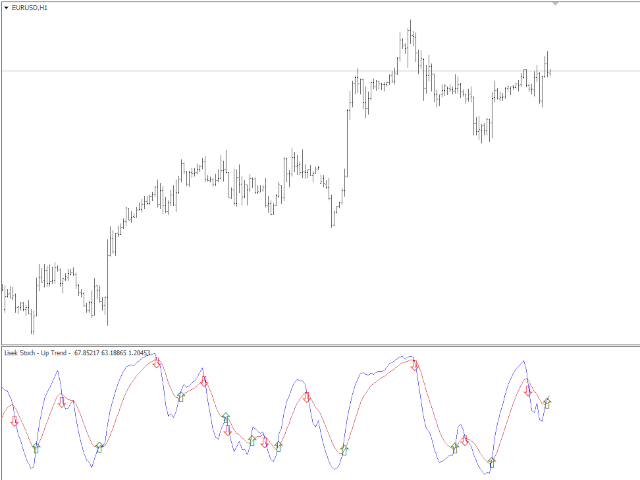
Lisek Stochastic oscillator indicator with Alarm, Push Notifications and e-mail Notifications.
The Stochastic indicator is a momentum indicator that shows you how strong or weak the current trend is.
It helps you identify overbought and oversold market conditions within a trend.
The Stochastic indicator is lagging indicator, which means it don't predict where price is going, it is only providing data on where price has been !!!
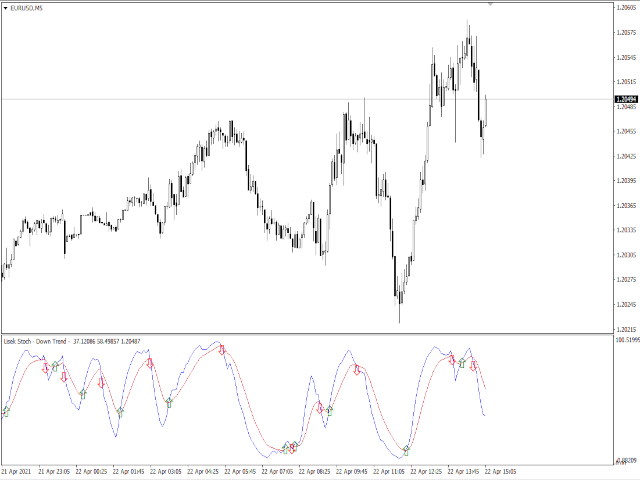
How to trade with Stochastic indicator:
- Trend following: As long as the Stochastic keeps crossed in one direction, it shows that the trend is still valid.
- Strong trends: When the Stochastic is in the oversold/overbought area, don't fight the trend but try to hold on to your trades and stick with the trend.


Пока вроде нормуль