MACD Scanner With Alerts
- 指标
- 版本: 1.0

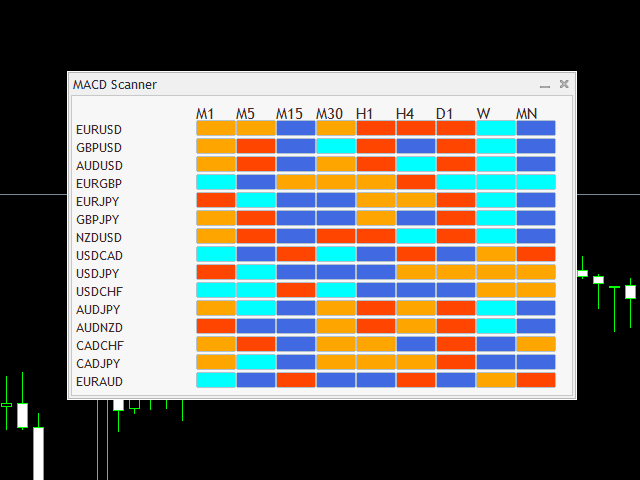
MACD仪表盘面板
该指标可帮助您扫描Market Watch窗口中的交易品种并根据MACD过滤趋势。
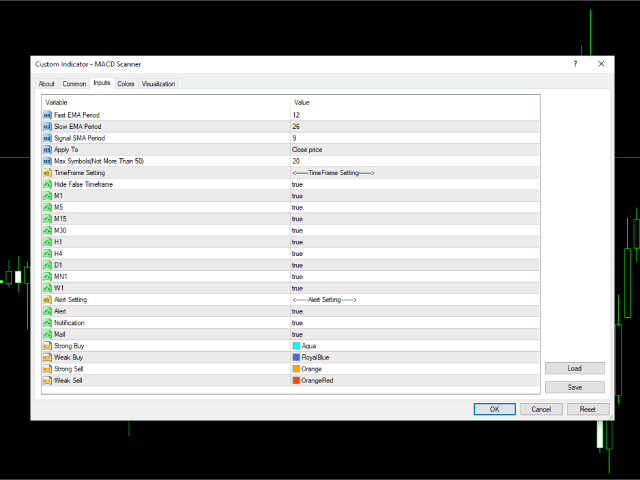
移动平均线趋同散度(MACD)是一种趋势跟踪动量指标,它显示了证券价格的两个移动平均线之间的关系。通过从12个周期EMA减去26个周期的指数移动平均线(EMA)来计算MACD。
该计算的结果是MACD行。然后在MACD线上方绘制MACD的为期9天的EMA,称为“信号线”,它可以触发买入和卖出信号。当MACD越过信号线上方时,交易者可以买入该证券;当MACD越过信号线下方时,交易者可以卖出或做空该证券。移动平均趋同散度(MACD)指标可以用几种方法来解释,但更常见的方法是交叉,散度和快速上升/下降。
它显示了单个窗口中每个时间帧的MACD趋势。您也可以通过单击值来打开图表

Hi! Thanks to the author, the indicator is working. But unfortunately, notifications are not coming through. Please fix this issue. Create your template and save it as Default. By pressing the button (red or green), the chart will open immediately in your template. --------------------------------------------------------------------------- Request to the author: can you add the option to select signals: 1) By crossing the zero line 2) Histogram below/above EMA 9 + 3) Both signals THANK YOU!!!