Support and Resistance Levels Arrow Indicator
- 指标
- 版本: 1.0
please leave 5 stars to me
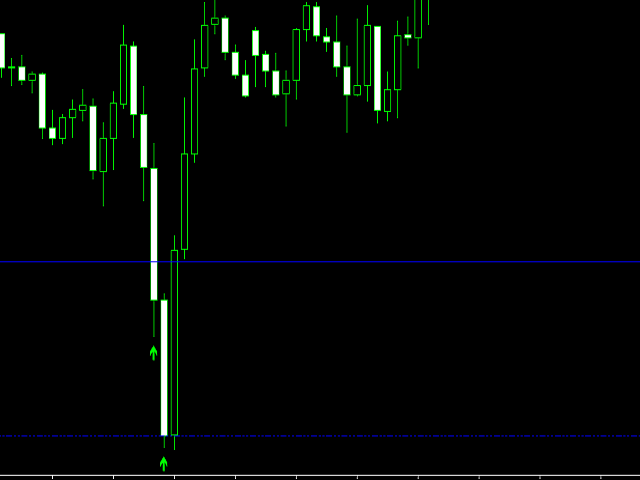
A support level is a level where the price tends to find support as it falls. This means that the price is more likely to "bounce" off this level rather than break through it. However, once the price has breached this level, by an amount exceeding some noise, it is likely to continue falling until meeting another support level.
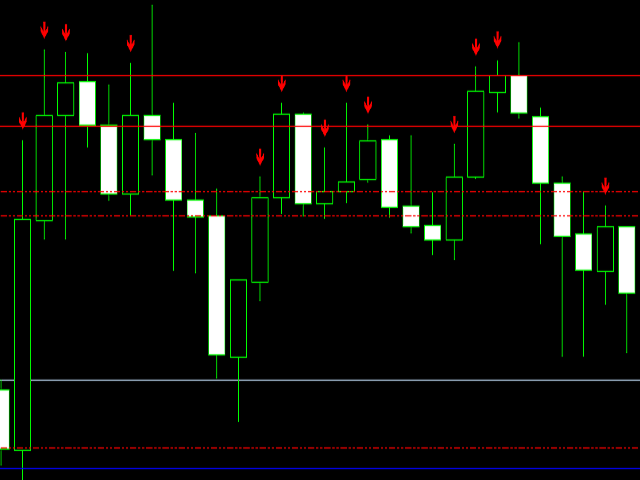
A resistance level is the opposite of a support level. It is where the price tends to find resistance as it rises. Again, this means that the price is more likely to "bounce" off this level rather than break through it. However, once the price has breached this level, by an amount exceeding some noise, it is likely to continue rising until meeting another resistance level.
Support and Resistance Levels Arrow Indicator is an amazing precise and reliable support and resistance indicator.
It displays the most important trading levels and draws them according to their relevance.
If Support candle level is clearly broken it will show you UP arrow, and if Resistance is broken it will show you Down arrow
Key Features
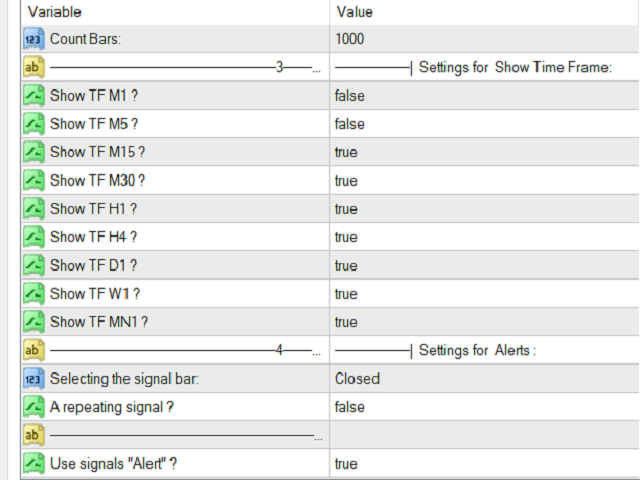
- Automated adjustment to the underlying time frame
- Displays only significant support and resistance levels
- Immediate graphical response if a level is clearly broken
Notification Settings
- Enable SR distance warning: Set to true and you will get an alert if the price comes close to the next SR level.
- Enable SR switch notification: Set to true and you will get an alert if a SR Level changes its role from support to resistance or vice versa.
- AlertsOn: You will benefit from several alert and notification options like audio, e-mail or mobile notifications. False disables all alerts.
- AlertsMessage: You will get an alert message in your MetaTrader 4 platform.
- AlertsSound: You will get an audio notification in your MetaTrader 4 platform.
- AlertsEMail: You will get an e-mail if you set up the correct e-mail settings for your e-mail provider at your MetaTrader 4 platform.
- AlertsNotification: You will get a notification on your mobile device if you set up the mobile notification settings of your MetaTrader 4 platform
用户没有留下任何评级信息