Investment Castle Trend Lines MT4

Investment Castle トレンドライン — プライスアクションを自動描画
優れたトレードはトレンドを読むことから始まります——需給、上昇・下降チャネル、トレンドライン、包み足。Investment Castle トレンドラインは、そのプライスアクションの全体像をチャート上に自動でまとめ、推測とストレスを減らしてトレンドを捉えられるようにします。
このインジケーターができること
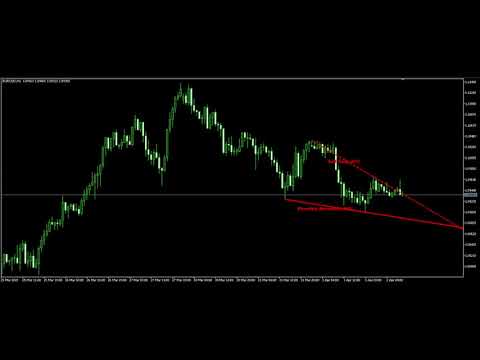
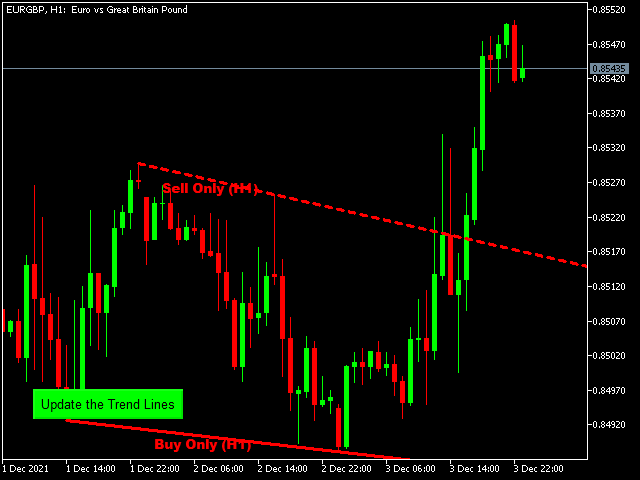
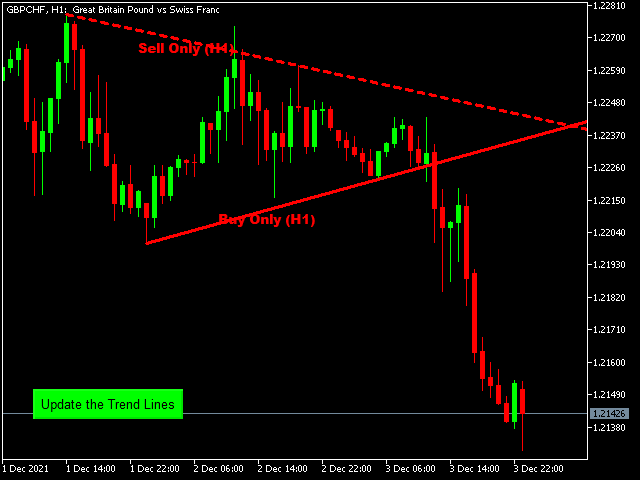
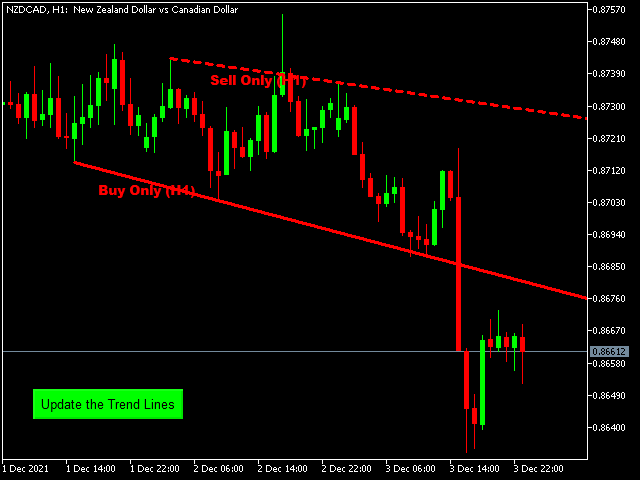
- 自動トレンドライン:主要なトレンドラインを自動描画。手動作図は不要です。
- プライスアクションの文脈:構造・方向・重要な転換点がひと目で分かります。
- ストレス減・判断が速い:描画ではなく判断に時間を使えます。
- 実証済みのプライスアクションに基づく:プロがトレンドを捉えるのと同じ手法。
- どこでも動作:あらゆる銘柄・あらゆる時間軸。
対象:エントリー前にトレンドを把握したいプライスアクション・トレーダー。
リスク警告:取引には大きな損失リスクが伴います。必ずまずデモ口座でテストし、ご自身が許容できるリスク設定を使用してください。過去の成績は将来の結果を保証するものではありません。


5 stars!!! Thank you!