Abiroid Supertrend Scanner

Read detailed description and extra indicators:

https://www.mql5.com/en/blogs/post/758622


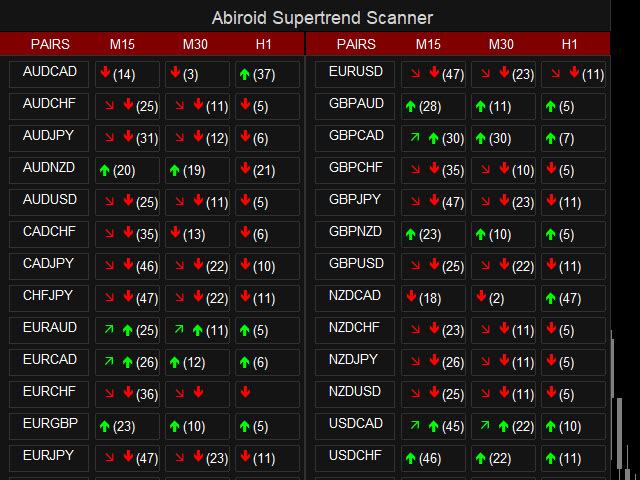
This Supertrend dashboard is a multi-currency and multi-timeframe dash which gives signals whenever supertrend changes it's trend direction.

Please note, that this is not a full trading system.

It will help you get initial Supertrend signals and higher timeframe trend alignments.

And it’s to be used with your own Supertrend Strategies.


Features:

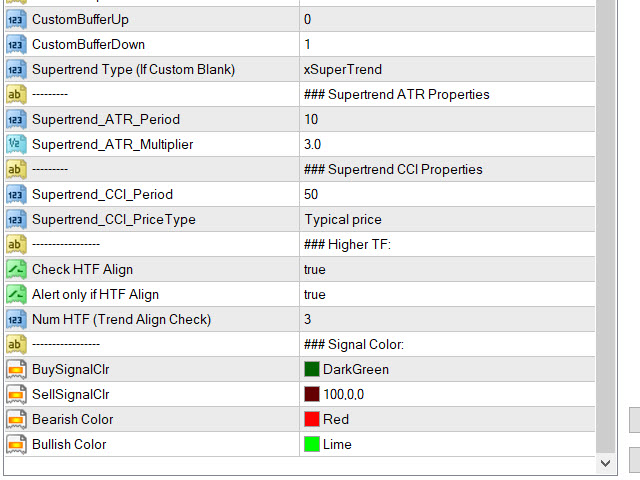
1- Select one of In-Built Supertrend Indicators: xSupertrend or Supertrend_CCI (based on CCI).
2- Or select your own Custom Supertrend indicator. And specify the UpTrend and DownTrend Buffer numbers
3- Supertrend Trend Direction Change Scan
4- Scan Max Past Bars for Supertrend Change. Show how many bars back the change occurred in a bracket
5- Past Bars Back Alerts: Num of bars back for which scanner will send alerts
6- Supertrend HTF Align: Show a slanting Green/Red Arrow for Up/Down trend

    Types of Supertrend:

    Custom: Add your own supertrend version ex4 here.

    Suppose you have Supertrend.ex4 here: MQL4/Indicators/Supertrend.ex4

    Then specify it in Custom like


    Also specify CustomBufferUp for Up trend and CustomBufferDown for Down Trend.

    Dash will check these Buffer values and find out when the Supertrend shifted it’s trend (when buffer is non-zero and non-empty).

    Some supertrend versions have a bar where both buffers are equal and non-zero and it means that trend shifting is still going on.

    So, dash will ignore those bars.

    If Custom Supertrend is Blank, then it will use one of these in-built Supertrend versions


    If you select xSupertrend, then it will use: Supertrend_ATR_Period and Supertrend_ATR_Multiplier

    If you select Supertrend CCI (supertrend_nrp_mtf_nmc), then it will use: Supertrend_CCI_Period and Supertrend_CCI_PriceType
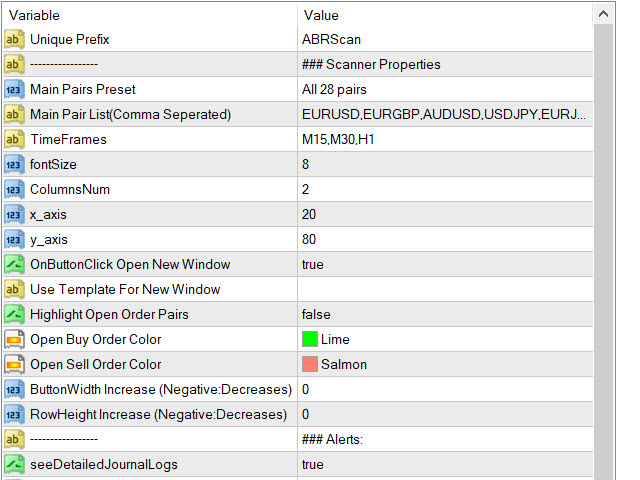
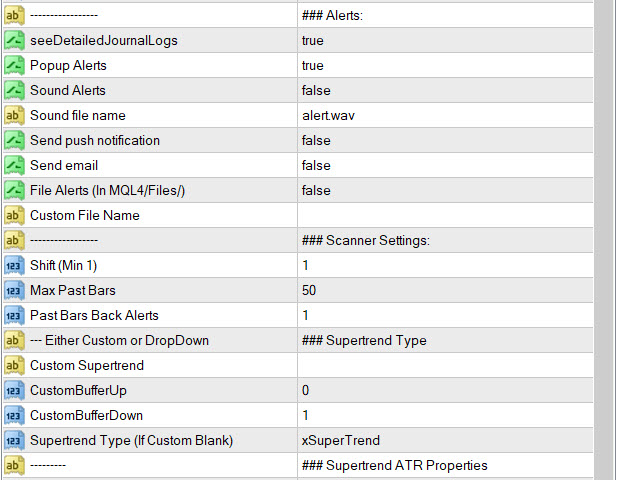

    Settings:

    Shift: Start scanning for Supertrend from “Shift” bar to “Max Past Bars“. Shift is 1 by default. But if you are not interested in new signals 1 bar back, then keep Shift to higher value.

    Don’t use 0, since Supertrend might repaint while forming on current bar. Min possible value is 1.


    Past Bars Back Alerts: Number of bars for which previous alerts are also sent. Suppose it is 5. And when you load scanner, it will also give alerts if Supertrend trend switch occurred 5 bars back.

    Also Blocks will light up Red/Green if a signal was there within past 5 bars.

    Check HTF Align: Keep true, if you want to check Higher timeframe’s Supertrend direction

    Num HTF: Number of Higher timeframes to check for trend alignment with current timeframe.

    Suppose current TF is M15 and “Num HTF” is 2. And current Supertrend direction is Bullish. It will check M30 and H1 for Bullish Trend as well. And show a slanting Up Green Arrow if Bullish.

    Slanting Down Red arrow is for Bearish Alignment.

    推荐产品
    MT Scanner
    Niravkumar Maganbhai Patel
    4 (2)
    This indicator helps you to Scan symbols which are in the Market Watch Window  and filter out trends with alerts. It works based on the effective indicator "SUPERTREND" which is used by many traders for trading: When box color changes to " Green " or " Red " color, it indicates you for trend change for long and short entry. And also you will get alerted on screen. When it changes to " Green ", it indicates you that trend is going upwards, and you can take the long entry. If the color changes to
    FREE
    Quantum Falcon Signal Free is a smart visual trading indicator for MetaTrader 4 designed for Forex and Gold traders. The indicator combines: • Trend analysis • RSI momentum confirmation • MACD momentum filtering • ATR volatility filtering • Higher timeframe confirmation • Smart exit signal detection Main Features: • Smart Buy and Sell signals • Exit Buy / Exit Sell alerts • Real-time dashboard on chart • Professional candle arrows • Multi-timeframe trend confirmation • ATR market volatility filt
    FREE
    Symmtric Trangle Pattern MT4 指标旨在通过实时识别 MetaTrader 4 上的对称三角形模式来增强交易策略。这个强大的工具为寻求可靠信号的交易者提供了潜在趋势延续或反转的指示,最终帮助他们做出更明智的决策。 凭借其先进的算法,该指标通过提供清晰的视觉信号和警报简化了交易过程,使交易者更容易利用这些关键图表模式驱动的市场波动。 MQL 产品安装指南 | 在 MT4/MT5 上更新已购买的 MQL 产品 | 常见故障排除指南 | 指标设置 / 指南 主要特点 缓冲区集成:将指标值暴露为可供 Expert Advisors 使用的可访问缓冲区,以便于自动交易策略。 视觉箭头信号:在信号蜡烛上直接在图表上显示清晰的买入和卖出箭头,便于视觉解读。 快速且可回测:利用 MetaTrader 的本地 OnCalculate() 引擎进行快速计算,确保与策略测试器的兼容性,以进行历史回测。 弹出警报:在信号事件上触发警报弹出窗口,确保交易者不会错过关键交易设置。 推送通知:实时将推送通知发送到您的 MetaTrader 移动应用,允许您随时随地监控交易信号。 电子邮件警
    FREE
    本指标是实践实战交易完善的波浪自动分析的指标 !  案例... 注: 波浪分级用西方叫法不习惯,因受到缠论(缠中说禅)命名方式习惯的影响,我是将基础波浪命名为 笔 ,将二级波段命名为 段 ,同时具有趋势方向的段命名为 主趋段 (以后笔记中都是这种命名方式,先告知大家),但是算法上和缠论关系不大切勿混淆.反映的是本人分析盘面总结的 千变万化纷繁复杂的运行规律 . 对波段进行了标准化定义,不再是不同人不同的浪  ,    对人为干扰的画法进行了排除,在严格分析进场起到了关键的作用 . 使用这个指标,等于将交易界面提升美感,抛弃最原始的K线交易带你进入新的交易层次.如果不是为了交易,在宣传上也将使客户观感提升层次. 指标内容: 1. 基础波浪 (笔) : 首先我们找出了价格波动过程中的基础波动拐点,当然他的有序性低,为下一步的计算提供基础. 2. 二级波段( 段 ) :在基础波浪的基础上,通过算法分析得到层级更明显的二级波段,二级波段为波浪提供了分析基础 3. 波浪( 浪 ): 有着更清晰的趋势,更清晰直观的方向.分析一个波浪是否延续,需要看二级波段的形态,分析二级的构成,可以得出波浪
    Happy Kangaroo
    Pui Yan Leung
    Overview Happy Kangaroo is a trend-following tool designed to identify market direction and provide high-probability entry signals based on volatility. By combining price action with the Average True Range (ATR), it visualize a dynamic support and resistance level of the price.     Key Features   The indicator's power lies in its customizable parameters and mathematical precision:  Dynamic Trend Detection: Uses the ATR period and factor to calculate the volatility bands. It identifies an Uptrend
    Super Ichi
    Sinan Durkan
    What is the Super Ichi Indicator? Super Ichi is an advanced combination of Ichimoku Kinko Hyo and SuperTrend indicators. This powerful technical analysis tool is designed to identify market trends and generate trading signals. What Does It Do? Dual-Level Trend Analysis : Uses customized versions of Tenkan-sen and Kijun-sen lines Automatic Signal Generation : Displays visual markers (arrows) at crossover points Real-Time Alert System : Provides audio and visual alerts when new signals occur Dynam
    FREE
    Smart FVG indicator MT4
    Ahmad Kazbar
    4.75 (4)
    Smart FVG 指标 MT4 – MetaTrader 4 高级公平价值缺口检测 Smart FVG 指标为 MetaTrader 4 提供专业的公平价值缺口(Fair Value Gap,FVG)检测、监控和告警功能,所有信息都直接显示在图表上。它将基于 ATR 的过滤与结构感知逻辑相结合,帮助你去除噪音、适应流动性,并只保留最关键的不平衡区域,从而做出更加精确的交易决策。 主要优势 精准的 FVG 检测:识别真正的市场低效,而不仅仅是简单的 K 线价格跳空。 基于 ATR 的自适应精度:根据不同市场与周期自动过滤低质量信号。 实时有效性跟踪:当价格填补或突破缺口时,相关区域会被自动延伸、调整或删除。 高度可视化与自定义:可根据任何模板自定义颜色、线型和填充样式。 实用告警功能:对新出现、被填补或被突破的 FVG 提供实时通知。 性能优化:轻量化设计,适合多品种、多周期同时扫描。 工作原理 将指标加载到任意 MT4 品种与时间周期图表上。 算法会扫描历史与实时 K 线,标出当前有效的 FVG 区域。 ATR 逻辑会根据当前波动率和流动性动态调整检测条件。 当价格完全回补缺口
    FREE
    Binary Option Signal
    Yaroslav Varankin
    Indicator for binary options arrow is easy to use and does not require configuration works on all currency pairs, cryptocurrencies buy signal blue up arrow sell signal red down arrow tips do not trade during news and 15-30 minutes before their release, as the market is too volatile and there is a lot of noise it is worth entering trades one or two candles from the current period (recommended for 1 candle) timeframe up to m 15 recommended money management fixed lot or fixed percentage of the depo
    Double HMA lines MTF
    Pavel Zamoshnikov
    5 (2)
    This is a multi-timeframe version of the popular Hull Moving Average (HMA). The Double HMA MTF Light indicator combines two timeframes on a single chart. The HMA of the higher timeframe defines the trend, and the HMA of the current timeframe defines short-term price movements. The indicator is freely distributed and hasn't audio signals or messages. Its main function is the visualization of price movements. If you need advanced functionality of the HMA multi-timeframe indicator (information ab
    FREE
    KT Horizontal Lines MT4
    KEENBASE SOFTWARE SOLUTIONS
    在MetaTrader中,绘制多个   水平线   并跟踪各自的价格水平可能非常麻烦。该指标可自动在等间距位置绘制多个水平线,用于设置价格提醒、标记支撑和阻力位以及其他手动操作。 这个指标非常适合刚接触外汇交易的新手,帮助他们寻找买卖机会并实现快速获利。无论市场处于趋势中还是震荡状态,水平线都能帮助交易者识别潜在的进出场区域。 功能特点 可根据输入参数中的预设,瞬间绘制多个水平线。 使用鲜明的色彩主题,区分不同的水平线。 是追踪多个交易时段价格区间的必备工具。 当价格触及某条水平线时会自动发出提醒。 可设置提醒之间的间隔,避免重复提醒造成干扰。 支持完全自定义设置。 说明 该指标根据输入参数中的配置自动绘制水平线。观察价格在这些水平线附近的反应,可以帮助识别关键支撑/阻力位附近的潜在交易机会。 例如,在水平支撑位形成一根看涨Pin Bar,通常意味着价格可能会继续上涨,朝最近的阻力位移动。 若价格以一根看跌K线收盘于支撑位下方,则可能表明刚刚发生了一个下行突破。而在水平线上发生的假突破,则说明价格未能突破关键水平,可能即将反转方向。 一些价格反转形态(如Pin Bar或假突破)对于
    BinaryMartini
    Abdulkarim Karazon
    индикатор для бинарной торговли, основанный на пересечении 3MA с macd, он дает сигналы на покупку и продажу при открытии бара и не перерисовывается и не перерисовывается Индикатор не ориентирован на высокий процент выигрышей, поскольку он создан для торговли по мартингейлу, индикатор ориентирован на наименьшее количество проигрышных сигналов подряд. Стратегия: Минимальный депозит 1000 юнит, торговлю начинаем с 1 юнит (размер сделки 1 юнит на каждые 1000 капитала) мы удваиваем размер сделки по сл
    Email Drawdown Alert
    Roman Starostin
    5 (12)
    Free informative Indicator-helper. It'll be usefull for traders who trade many symbols or using grid systems (Averaging or Martingale). Indicator counts drawdown as percent and currency separate. It has a number of settings: Count deposite drawdown according equity value and send e-mail or notifications to user if DD more than set; Sending e-mail when max open orders reached; Shows price and remaining pips amount before MarginCall on current chart and Account generally; Display summary trade lot
    FREE
    VR Cub
    Vladimir Pastushak
    VR Cub 这是获得高质量切入点的指标。该指标的开发是为了促进数学计算并简化对仓位入场点的搜索。多年来,该指标所针对的交易策略已被证明其有效性。交易策略的简单性是其巨大的优势,即使是新手交易者也能成功进行交易。 VR Cub 计算开仓点以及获利和止损目标水平,这显着提高了效率和易用性。查看使用以下策略进行交易的屏幕截图,了解简单的交易规则。 设置、设置文件、演示版本、说明、问题解决,可以从以下位置获取 [博客] 您可以在以下位置阅读或撰写评论 [关联] 版本为 [MetaTrader 5] 计算入场点的规则 开仓 要计算入场点,您需要将 VR Cub 工具从最后一个高点拉伸到最后一个低点。 如果第一个点在时间上早于第二个点,交易者等待柱线收于中线上方。 如果第一个点在时间上晚于第二个点,交易者等待柱线收于中线下方。 根据上述条件,严格在 柱线收盘 后建仓。 换句话说,如果我们在小时图上进行交易,那么从最高点到最低点的时间距离必须超过24小时,最高点和最低点之间的点数必须大于或等于平均价格变动每天。 维持和改变市场地位 可以有多个未平仓头寸;每个头寸都可以单独修改。 VR Cub
    Fibonacci colores
    Carlos Augusto Cedeno Rocha
    Fibonacci por color en niveles para aplicar estrategia profesional inicialmente se coloca en el punto mas alto del dia y mas bajo con esto es para ubicar operaciones a una distancia exacta con lo cual se busca generar ganancias residuales internas en el mismo dia con esto las lineas fusias es para colocar las entrdas sell y las lineas verdes amarillas van los buy
    The indicator allows you to trade binary options. The recommended time frame is М1 and the expiration time is 1 minutes. The indicator suitable for auto and manual trading. A possible signal is specified as a arrows above/under a candle. You should wait until the candle closes! Arrows are not re-painted Trade sessions: London and New York section Currency pairs: AUD/CAD Working time frame: M1 Expiration time: 1 minute The indicator also shows good results when using the martingale strategy - "Ma
    FREE
    “动态剥头皮震荡指标”是一款高级自定义加密货币外汇指标,适用于 MT4 平台,高效交易! ............................................................................................................ - 新一代震荡指标 - 参见图片了解如何使用。 - 动态剥头皮震荡指标具有自适应超卖/超买区域。 - 震荡指标是一款辅助工具,可从动态超卖/超买区域找到准确的入场点。 - 超卖值:低于绿线,超买值:高于橙线。 - 该指标也非常适合与价格行为模式结合使用。 - 它比标准震荡指标更精准。 - 提供 PC 和移动端警报。 ................................................... 点击这里查看高质量的交易机器人和指标! 本产品为原创,仅在 MQL5 网站上提供。
    Rainbow MT4
    Jamal El Alama
    Rainbow MT4 is a technical indicator based on Moving average with period 34 and very easy to use. When price crosses above MA and MA changes color to green, it’s a signal to buy. When price crosses below MA and MA changes color to red, it’s a signal to sell. The Expert advisor ( Rainbow EA MT4) based on Rainbow MT4 indicator, as you can see in the short video below is now available here .
    FREE
    Super Auto Fibonacci
    Muhammed Emin Ugur
    Discover the power of precision and efficiency in your trading with the " Super Auto Fibonacci " MT4 indicator. This cutting-edge tool is meticulously designed to enhance your technical analysis, providing you with invaluable insights to make informed trading decisions. Key Features: Automated Fibonacci Analysis: Say goodbye to the hassle of manual Fibonacci retracement and extension drawing. "Super Auto Fibonacci" instantly identifies and plots Fibonacci levels on your MT4 chart, saving you tim
    FREE
    Volume MA
    Amirhossein Ghasemi Moroodi
    After 7 years I decided to release some of my own indicators and EAs for free. If you find them useful please  Show support with a 5-star rating! Your feedback keeps the free tools coming! See other my free tools as well here _________________________________ Volume Moving Average (Volume MA) Indicator for Advanced Forex Market Analysis Introducing the Volume Moving Average (Volume MA) Indicator, meticulously developed in MQL4, a pivotal tool for enhancing your forex trading strat
    FREE
    EARLY REMINDER: The Starting price is 65 price will rise soon up to 365$ and then 750$ after first 10 copies of sales. Grab this offer now! Introduction Hello, traders! Welcome to the demonstration of the Forex Beast Indicator , a comprehensive tool designed to assist aspiring traders in navigating the complexities of the forex market. This indicator incorporates seven essential components to provide a well-rounded trading experience: Moving Averages Colored Zones Support and Resistance Levels
    通过 Support Resistance Breakout Indicator MT4 提升您的突破交易,这是一款基于 ZigZag 的强大工具,能够动态识别支撑和阻力区域,为外汇、股票、加密货币和商品市场提供高概率的入场信号。借鉴 Investopedia 和 BabyPips 等网站上描述的成熟价格行为原则,支撑/阻力突破被认为是趋势反转或持续的信号,通过改变买家与卖家的动态,该指标在 Reddit 的 r/Daytrading 和 r/Forex 以及 Forex Factory 论坛等交易社区中广受好评。用户报告称,其识别有效突破的准确率高达 75%,通过基于收盘价的触发机制减少了虚假信号,并在结合基本确认时将胜率提升 15-30%,常常将波动较大的交易时段转变为盈利机会。主要优势包括精确检测突破点以抓住动能、通过 ATR 缩放区域适应波动性以减少假突破、集成止损和止盈预测以实现优越的风险回报比(例如 1:2 或更高),以及无缝警报支持免手动监控,使其成为专注于支撑/阻力交易的剥头皮、日内交易和波段策略的首选工具,无需额外指标。 Support Resistance Brea
    Free automatic fibonacci
    Tonny Obare
    4.67 (49)
    Free automatic Fibonacci is an indicator that automatically plots a Fibonacci retracement based on the number of bars you select on the BarsToScan setting in the indicator. The Fibonacci is automatically updated in real time as new highest and lowest values appears amongst the selected bars. You can select which level values to be displayed in the indicator settings. You can also select the color of the levels thus enabling the trader to be able to attach the indicator several times with differe
    FREE
    Auto Supply and Demand Oscillator is an indicator for MetaTrader 4 and MetaTrader 5 that detects supply and demand zones automatically and displays them as a single oscillator value at the bottom of the chart, instead of drawing rectangles directly on price. Concept Supply zones are price areas where strong selling created a sharp downward move away from a balance area. Demand zones are price areas where strong buying created a sharp upward move. Traditional implementations draw boxes on the
    FREE
    该智能交易系统不进行任何交易,但它会扫描您的市场观察中的整个交易品种,并在不同的时间范围内逐一扫描每个股票,最后它会向您显示哪个交易品种在哪个时间范围内具有强大的吞没蜡烛。 此外,您可以定义 MA 周期和 RSI 上限和下限,它会显示哪个时间范围内的交易品种将穿越调整后的移动平均线,以及哪个时间范围内的交易品种将穿越移动平均线的上限或下限。 相对强弱指数。 Gāi zhìnéng jiāoyì xìtǒng bù jìnxíng rènhé jiāoyì, dàn tā huì sǎomiáo nín de shìchǎng guānchá zhōng de zhěnggè jiāoyì pǐnzhǒng, bìng zài bùtóng de shíjiān fànwéi nèi zhúyī sǎomiáo měi gè gǔpiào, zuìhòu tā huì xiàng nín xiǎnshì nǎge jiāoyì pǐnzhǒng zài nǎge shíjiān fànwéi nèi jùyǒu qiángdà de tūnmò làzhú. Cǐwài, nín
    FREE
    Magical Arrow
    Ranguni Abdulsamir Abdulmajid
    Magical Arrow Indicator – Clear & Reliable Signals The Magical Arrow Indicator is a non-repainting, trend-following tool that gives you crystal-clear Buy and Sell signals . It  high-probability reversals and entries . No more guesswork – just follow the arrows on your chart! The Magical Arrow Indicator is a powerful, easy-to-use trading tool that helps you catch the most profitable Buy and Sell opportunities in the Forex market. It is designed for beginners and professional traders , giving y
    Market Structure Zig Zag
    Lesedi Oliver Seilane
    4.66 (29)
    Free Market structure zig zag to assist in price action trading the screenshots describe how to use and how to spot patterns new version comes with alerts, email alert and  push notification alert can be used on all pairs  can be used on all timeframes  you can add additional confirmation indicators the indicator shows you your higher high and low highs as well as your lower lows and lower highs  the indication makes price action analysis easier to spot.
    FREE
    Auto Fibo Pro m
    DMITRII GRIDASOV
    “Auto FIBO Pro” Crypto_Forex 指标 - 是交易中的绝佳辅助工具! - 指标自动计算并放置在图表斐波那契水平和局部趋势线(红色)上。 - 斐波那契水平指示价格可能反转的关键区域。 - 最重要的水平是 23.6%、38.2%、50% 和 61.8%。 - 您可以将其用于反转剥头皮或区域网格交易。 - 还有很多机会可以使用 Auto FIBO Pro 指标来改进您当前的系统。 - 它具有信息价差掉期显示 - 它显示所连接的外汇对的当前价差和掉期。 - 显示屏还显示账户余额、净值和保证金。 - 可以将信息价差掉期显示定位在图表的任何角落 . 点击这里查看高质量的交易机器人和指标! 这是仅在此 MQL5 网站上提供的原创产品。 ...............................................
    Engulf Detector
    Amirhossein Ghasemi Moroodi
    经过7年的时间,我决定免费发布我自己的一些指标和EA。 如果您觉得它们有用,请   给予5星评价支持!您的反馈将持续带来更多免费工具! 也可以在这里查看我的其他免费工具和我的实时信号   这里 _________________________________ 吞没模式检测器 - 简化的交易指标 发现吞没模式检测器,这是一个在MQL4中创建的直接工具,用于识别外汇市场中的吞没模式。这个指标旨在通过突出潜在的市场进入或退出点,使您的交易策略更加有效。 主要特点: 吞没模式检测 : 快速识别看涨和看跌的吞没模式,以信号交易机会。 高级通知 :  检测到吞没形态时发送通知和警报 易于使用 ️: 无缝集成到您的Metatrader 4平台,适合任何经验水平的交易者。 如何使用: 设置 ️: 将吞没模式检测器添加到您的Metatrader 4。根据需要自定义其设置。 模式识别 : 监控指标以识别吞没模式,作为交易进入或退出的潜在信号。 自信交易 : 使用吞没模式检测器来增强您的交易决策,与您现有的策略一起使用。 吞没模式检测器是简化交易、快速模式
    FREE
    PTW NON REPAINT TRADING SYSTEM + HISTOGRAM Non-Repainting ,   Non-Redrawing   and   Non-Lagging  Trading System. Does the following: - Gives Accurate Entry and Exit Points - Scalping, Day and Swing Trading  - 95% Accuracy  - Targets, where to take profits. - Shows Trends, Support and resistance levels - Works on All Brokers - Works on All Currencies, CFDs and Stocks - It does not place trades for you, it only shows you what trades to place. - It works on All Timeframes - It is for Trend or ran
    Price Retest
    Suvashish Halder
    4.88 (8)
    Introducing our exciting new Price Retest indicator! Get instant alerts when the price retests, giving you a powerful edge in your trading strategy. Remember to do your own analysis before making any moves in the market. MT5 Version -  https://www.mql5.com/en/market/product/118159/ Join To Learn Market Depth -   https://www.mql5.com/en/channels/suvashishfx Here’s a detailed explanation of how the Price Retest indicator works, its components, and how you can incorporate it into your trading str
    FREE
    该产品的买家也购买
    Neuro Poseidon MT4
    Daria Rezueva
    4.95 (37)
    Neuro Poseidon is a new indicator by Daria Rezueva. It combines precise trading signals with adaptive TP/SL levels - creating best possible trades as a result! Message me and get  Neuro Poseidon Assistant  as a gift to automize your trading process! What makes it stand out? 1. Proven profitability on all assets and timeframes 2. Only confirmed BUY and SELL signals present on the chart 3. Adaptive TP & SL levels generated by the software for each trade 4. Easy to understand - suitable for all
    Gann Made Easy
    Oleg Rodin
    4.84 (165)
    Gann Made Easy 是一个专业且易于使用的外汇交易系统,它基于使用先生理论的最佳交易原则。 W.D.江恩。该指标提供准确的买入和卖出信号,包括止损和获利水平。您甚至可以使用推送通知在旅途中进行交易。 购买后请联系我,即可免费获得交易指导和超棒的额外指标! 您可能已经多次听说过江恩交易方法。通常 Gann 的理论不仅对于新手交易者而且对于那些已经有一定交易经验的人来说都是非常复杂的东西。这是因为江恩的交易方法在理论上并不那么容易应用。我花了几年时间来完善这些知识,并将最好的原则应用到我的外汇指标中。 该指标非常易于应用。您所需要的只是将其附加到您的图表并遵循简单的交易建议。该指标不断进行市场分析工作并寻找交易机会。当它检测到一个好的入口点时,它会为您提供一个箭头信号。该指标还显示止损和获利水平。 换句话说,当您像先生一样进行交易时,该指标会为您提供最佳江恩建议。江恩亲自告诉你此时此刻该做什么。但最好的部分是您不需要了解任何有关江恩交易原则的知识,因为该指标会为您完成整个市场分析工作。
    Trend Catcher ind
    Ramil Minniakhmetov
    5 (3)
    趨勢捕捉指標 趨勢捕捉指標結合了作者獨有的客製化自適應趨勢分析指標,用於分析市場價格趨勢。它透過過濾掉短期噪音,並專注於潛在的動能強度、波動性擴張和價格結構行為,來識別真實的市場方向。此外,它還結合了平滑和趨勢過濾等客製化指標,例如移動平均線、相對強弱指標 (RSI) 和波動率過濾器。 您可以在這裡查看實際運行情況以及我的其他產品: https://www.mql5.com/en/users/mechanic/seller 請注意,我不會在 Telegram 上出售 EA 或任何設置,那是騙局。所有設定都可以在我的部落格上免費取得。 重要提示!購買後請立即聯繫我,以獲取使用說明和額外獎勵! 請注意,我不會在 Telegram 上出售 EA 或任何設置,那是騙局。所有設定都可以在我的部落格上免費取得。
    Dynamic Forex28 Navigator
    Bernhard Schweigert
    4.43 (7)
    Dynamic Forex28 Navigator - 下一代外汇交易工具。 当前 49% 折扣。 Dynamic Forex28 Navigator 是我们长期流行的指标的演变,将三种功能合二为一: 高级货币强度 28 指标 (695 条评论)+ 高级货币 IMPULSE 带警报 (520 条评论)+ CS28 组合信号(奖励)。 有关指标的详细信息 https://www.mql5.com/en/blogs/post/758844 下一代强度指标提供什么? 您喜欢的原始指标的一切,现在通过新功能和更高的精度进行了增强。 主要特点: 专有货币强度公式。  所有时间范围内的平滑和准确的强度线。 非常适合识别趋势和精确进入。 动态市场斐波那契水平(市场斐波那契)。  此指标独有的独特功能。 斐波那契应用于货币强度,而不是价格图表。 适应实时市场活动以获得准确的反转区域。 实时市场动量。  第 9 行显示市场是活跃还是被动。 对于定时交易至关重要。 全面的警报和显示。  每种货币最强的买入和卖出动量。 ​​28 对的双重动量买入和卖出。 超买/超卖警告外部范围和止损。 反转
    M1 Sniper
    Oleg Rodin
    5 (24)
    M1 SNIPER 是一款易于使用的交易指标系统。它是一个专为 M1 时间框架设计的箭头指标。该指标可以作为独立的系统在 M1 时间框架下进行剥头皮交易,也可以作为您现有交易系统的一部分使用。虽然该交易系统专为 M1 时间框架交易而设计,但它也可以用于其他时间框架。我最初设计此方法是为了交易 XAUUSD 和 BTCUSD。但我发现这种方法在其他市场交易中也同样有用。 指标信号既可以顺势交易,也可以逆势交易。我教授一种特殊的交易技巧,帮助您利用指标信号进行双向交易。该方法基于使用特殊的动态支撑位和阻力位区域。 购买后,您可以立即下载 M1 SNIPER 箭头指标。此外,我还为所有 M1 SNIPER 工具用户免费提供下方屏幕截图所示的 Apollo Dynamic SR 指标!这两个指标的组合可以帮助您更轻松、更准确地利用 M1 时间框架进行交易。 购买后请联系我,免费获取交易提示和奖励指标! 祝您交易成功!
    MetaBands M4
    Vahidreza Heidar Gholami
    3.5 (6)
    MetaBands使用强大且独特的算法绘制通道并检测趋势,以便为交易者提供进出交易的潜在点。它是一个通道指标和强大的趋势指标。它包括不同类型的通道,可以通过使用输入参数简单地合并以创建新通道。MetaBands使用所有类型的警报通知用户市场事件。 功能 支持大多数通道算法 强大的趋势检测算法 能够合并不同类型的通道 多时间帧和多货币(信号矩阵) 所有类型的警报功能(声音、屏幕闪烁、推送通知、电子邮件、弹出窗口、箭头) 它永远不会重绘 趋势检测 MetaBands使用在通道内振荡的蓝色线来检测趋势。当该线遇到通道的上界时,表明开始下跌趋势,当它遇到下界时,表明开始上涨趋势。如果蓝线接近中线,则市场处于整理期。 该指标使用独特的方法来检测趋势。一开始可能看起来有些复杂,但如果您观看视频教程,您就会意识到它是多么强大且易于使用。 入场和出场信号 当趋势变化或价格穿过上下通道时,MetaBands会立即通过不同的方法提醒交易者,这些方法可以在指标设置中启用。 信号矩阵 要监视来自不同时间框架的多个符号并在一个地方查看信号,请单击右上角按钮或按键盘上的M键以打开信号矩阵。该矩阵可以快速概览
    本产品已针对 2026 年市场进行更新,并针对最新 MT5 版本进行了优化。 价格更新通知: Smart Trend Trading System 目前价格为 $99 。 接下来的 30 次购买 后,价格将上涨至 $199 。 特别优惠: 购买 Smart Trend Trading System 后,请发送私信给我,即可免费领取 Smart Universal EA ,并将您的 Smart Trend 信号转换为自动交易。 Smart Trend Trading System 是一套完整的交易系统,具备不重绘、不回绘、不延迟的特点,专为希望获得更清晰信号、更准确趋势方向以及更有组织交易方式的交易者打造。 Online course , manual and download presets . 它将 10 多种交易工具 整合到一个系统中,包括趋势检测、反转区域、Smart Cloud、移动止损逻辑、支撑与阻力、K线着色、提醒以及多周期分析。 该系统旨在帮助您应对不同的市场环境: 趋势市场: 识别主要趋势,发现回调,跟随动能,并通过止损指导和移动止损选项寻找更清晰的入场机会。 震荡
    Advanced Supply Demand
    Bernhard Schweigert
    4.91 (300)
    现在优惠 30%! 任何新手或专业交易者的最佳解决方案! 该指标是一款独特、高质量、且价格合理的交易工具,因为我们已经整合了许多专有功能和新公式。 依据此更新,您将能够显示双重时间帧区域。 您不仅可以显示一个较高的时间帧,还可以同时显示图表时间帧,加上更高的时间帧:显示嵌套时区。 供需双方所有交易者都会喜欢它。 :) 重要信息披露 高级供需的最大潜力,请访问 https://www.mql5.com/zh/blogs/post/720245   想象您的交易如何得以改善,是因为您能够精准定位入场或目标位吗? 构建于新的底层算法,它可以更轻松地识别出买卖双方之间的潜在失衡。 这是因为它以图形方式展示供需最强劲区域,及其过去的表现(显示旧区域)。 这些功能旨在帮助您更轻松地发现最佳入场区域和价位。 现在您可以针对您的交易品种和时间帧来优化和编辑区域强度! 高级供需指标适用于所有产品和时间帧。 它是一个新的公式,非常新的功能是两个区域强度函数可由用户输入进行调整! 这在交易中是一大优势。 当您学习如何使用专有功能,例如带有价格游离最小 X 因子的区域强度时,您能够判断该区域强劲与否。 供需
    Scalper Inside PRO
    Alexey Minkov
    4.68 (69)
    Scalper Inside PRO Scalper Inside PRO 是一款日内趋势与剥头皮指标,采用独家的内置算法来评估市场方向和关键目标位。该指标会自动计算进场点、出场点以及多个止盈目标位,并显示详细的绩效统计数据,让您能够看到不同品种和策略在历史数据上的表现。这有助于您选择符合当前市场状况的交易品种。您还可以将自己的箭头指标连接到 Scalper Inside PRO,并快速查看它们的统计数据和历史信号。 Scalper Inside PRO 使用手册及参数说明: 点击阅读 该指标适用于任何品种和时间周期(日内交易推荐使用 M5),并包含多种内置策略。它既可作为独立的剥头皮工具使用,也可作为您交易系统的分析组件。 主要功能 基于独家的新一代趋势检测算法 Next-Generation Trend Detection Algorithm (NG TDA) 进行趋势识别。 自动计算进场点和出场点,并提供多级止盈目标(TP1、TP2、TP3)。 三种内置策略和一个优化器,用于将信号适配到当前品种和时间周期(仅在实时模式下可用)。 提供品种和策略在历史数据上的详细绩效统计。 提
    Genesis Matrix Pro is a professional multi-timeframe trend detection indicator designed to help traders identify high-quality market alignment with clarity and structure. It combines 12 different technical indicators into one visual alignment matrix, allowing traders to quickly see when market conditions are bullish, bearish, or neutral. A signal is generated only when the selected strategies are aligned, helping reduce noise and improve decision-making. PLEASE CONTACT ME AFTER PURCHASE TO GET
    Gann 方块指标是一种强大的市场分析工具,基于 W.D. Gann 在其“市场预测数学公式”一文中介绍的数学概念。该指标融合了与平方数(如 144、90 和 52)有关的 Gann 技术,以及平方 9。此外,它还融入了  关于如何将平方 9 与通道和星形图案结合使用的方法。 用户手册和使用方式: 在使用该指标之前,我们建议您阅读用户手册,并与我们联系以获得任何澄清。您可以在我们的网站上找到完整的用户手册。 该指标提供了 MT5 的完整版本供购买,也提供了 MT4 的免费版本供测试。提供了两个版本的链接供您方便使用。 主要特点和功能: Gann 方块指标为您的交易环境提供了全套工具,使您能够基于几何图案和 Gann 的概念做出明智的决策。以下是主要特点: 平方 9 分析: 该指标可以绘制与平方 9 有关的各种元素,包括水平线、星形图案、网格、Gann 扇形等。这在您的图表上提供了 Gann 的几何概念的视觉表示。 Gann 方块: 该指标绘制了 Gann 方块 52、90 和 144,使您能够可视化和分析它们与价格走势的关系。 自由 Gann 星形图案: 该指标使您能够直接在图表上绘制
    Breakout Arrows Mt4
    Michael Oko Oboh
    5 (1)
    Trend Breakout Arrows Indicator The Trend Breakout Arrows Indicator is a momentum-based signal tool designed to identify potential bullish and bearish breakout opportunities. It displays clear arrow signals directly on the price chart, helping traders quickly recognize possible trend changes and continuation setups. Up Arrow (Buy Signal) A magenta up arrow appears below a candle when bullish momentum begins to strengthen. This signal indicates that buying pressure may be overtaking selling press
    Neo Wave PRO
    Nikolay Raykov
    5 (1)
    Price & Time Market Structure Indicator A professional market structure tool that analyzes waves through both price and time — not price alone. Main Description NeoWave PRO is a professional market structure indicator for MetaTrader 4 designed for traders who want to move beyond traditional one-dimensional wave tools such as ZigZag, swing indicators, and basic high/low systems. Most wave indicators analyze only one thing: Price. But a real market wave is not only a price movement. A true wave de
    BTMM State Engine Pro MT4
    Garry James Goodchild
    BTMM State Engine Pro is a MetaTrader 4 indicator for traders who use the Beat The Market Maker approach: Asian session context, kill zone timing, level progression, peak formation detection, and a multi-pair scanner from a single chart. It combines cycle state logic with a built-in scanner dashboard so you do not need the same tool on many charts at once. What it does Draws the Asian session range; session times can follow broker server offset or be set in inputs. Tracks level progression (L
    GOLD Impulse with Alert
    Bernhard Schweigert
    4.67 (12)
    这个指标是我们2个产品 Advanced Currency IMPULSE with ALERT  +   Currency Strength Exotics 的一个超级组合。 它适用于所有时间框架,并以图形方式显示8种主要货币和一种符号的强势或弱势冲动! 该指标专门用于显示任何符号的货币强度加速,如黄金、异国货币对、商品、指数或期货。这是它的第一个指标,任何符号都可以被添加到第9行,以显示黄金、白银、石油、DAX、US30、MXN、TRY、CNH等的真实货币强度加速(冲动或速度)。 建立在新的基础算法上,它使识别和确认潜在的交易更加容易。这是因为它以图形方式显示了一种货币的强势或弱势是否正在加速,并测量了这种加速的速度--把它想象成你汽车中的速度表。当你加速时,事情显然会发生得更快,这在外汇市场上也是一样的,即如果你配对的货币正在向相反的方向加速,你就会发现一个潜在的有利可图的交易。 动态市场斐波那契28水平被用作警报触发器,将适应市场活动。如果冲动击中黄色触发线,你将收到警报。然后你就知道作为一个交易员应该做什么。货币对和方向已经给出。只需点击警报按钮,就可以切换到该货
    PRO Renko System
    Oleg Rodin
    5 (30)
    PRO Renko Arrow Based System for trading renko charts.  准确的信号交易任何外汇工具. 另外,我将免费提供系统的附加模块! PRO Renko系统是RENKO图表上高度准确的交易系统。该系统是通用的。 该交易系统可应用于各种交易工具。 该系统有效地中和了所谓的市场噪音,打开了获得准确反转信号的通道。 该指标易于使用,只有一个参数负责产生信号。 您可以很容易地使算法适应您感兴趣的交易工具和renko酒吧的大小。 我很乐意通过提供任何咨询支持来帮助所有客户有效地使用该指标。 祝您交易成功!购买后,立即写信给我! 我将与您分享我的建议和我的renko发电机。 另外,我将免费提供系统的附加模块!
    Advanced Currency Strength28 Indicator
    Bernhard Schweigert
    4.91 (657)
    目前40%的折扣 任何新手或专家交易者的最佳解决方案! 这个指标是一个独特的、高质量的、可负担得起的交易工具,因为我们纳入了一些专有的功能和一个新的公式。只需一个图表,你就可以读出28个外汇对的货币强度!想象一下,你的交易将如何得到改善,因为你的交易是在你的手中进行的。想象一下,你的交易将如何改善,因为你能够准确地确定新趋势或剥头皮机会的触发点? 用户手册:点击这里  https://www.mql5.com/en/blogs/post/697384 这是第一本,原版的! 不要买一个毫无价值的崇拜者的克隆品。 特别的 子窗口中的箭头显示强劲的货币势头GAP将指导你的交易! 当基础货币或报价货币处于超卖/超买区域(外盘斐波那契水平)时,在个人图表的主窗口中出现警告信号。 当货币力量从外围区间回落时,回撤/反转警报。 十字星模式的特别警报 可选择多个时间框架,以快速查看趋势! 货币强度线在所有的时间框架中都非常平稳,当使用较高的时间框架来识别总体趋势,然后使用较短的时间框架来确定精确的入口时,效果非常好。你可以根据自己的意愿选择任何时间框架。每个时间框架都由其自身进行了优化。
    The indicator scans for Dinapoli thrust pattern in multiple timeframes for the all markets filtered and shows the results on Dashboard. Key Features Dashboard can be used for all markets It can scan for thrust pattern on MN1, W1, D1, H4, H1, M30, M15 ,M5, M1 timeframes Ability to choose number of bars required above/below displaced moving average to define thrust Parameters UseMarketWatch: Set true to copy all symbols available in market watch MarketWatchCount : Set the number of symbols that
    Harmonic Pattern Plus MT4
    Young Ho Seo
    4.44 (18)
    Introduction Harmonic Patterns are best used to predict potential turning point. Traditionally, Harmonic Pattern was identified manually connecting peaks and troughs points in the chart. Manual harmonic pattern detection is painfully tedious and not suitable for everyone. You are often exposed under subjective pattern identification with manual pattern detection. To avoid these limitations, Harmonic Pattern Plus was designed to automate your harmonic pattern detection process. The functionality
    Current event:  https://c.mql5.com/1/326/A2SR2025_NoMusic.gif A. 什么是 A2SR ?   * 这是一个领先的技术指标(没有重绘,没有滞后)。  -  指导 : -- 在  https://www.mql5.com/en/blogs/post/734748/page4#comment_16532516 -- 和  https://www.mql5.com/en/users/yohana/blog A2SR 在确定支撑(需求)和阻力(供应)水平方面有一种特殊的技术。 与我们在网上看到的普通方式不同,A2SR 在确定实际 SR 级别时有一个独创的概念。 原技术不是从网上拿来的,也没有在网上公开过。 A2SR 将根据您的交易风格自动选择 SR 级别。 即使您正在更改时间范围,但 SR 级别仍将保留在其位置上。 因为实际的 SR 不是从你使用的时间范围内获得的。 A2SR 拥有完整的交易工具 。 实际支持(需求)和阻力(供应)的真正概念。 新闻事件和央行讲话的市场情绪。 新闻事件和趋势的主要货币强度 (MCS) 的真正概念
    KT Alpha Hunter Arrows MT4
    KEENBASE SOFTWARE SOLUTIONS
    大多数箭头指标只给你一个信号,然后把剩下的判断全部留给你自己。KT Alpha Hunter Arrows 给你的,是一套完整的交易计划。 每一个信号箭头出现时,图表上都会同时绘制完整计划:入场线、止损位、四个止盈目标,以及实时 Edge 结论,告诉你当前品种和时间周期是否值得交易。套装中还包含 Trade Manager EA,在你手动入场后负责后续执行,让你在市场波动和情绪干扰下依然保持纪律。非重绘。只在K线收盘后给出信号。适用于 Forex、黄金、指数,以及你交易的其他任何品种。 核心功能 非重绘买入和卖出箭头,只在K线收盘后出现。 每个信号都带有入场线、结构性止损和四个止盈目标。 Edge Dashboard 会分别评估当前图表上的买入和卖出机会。 结论系统:No Edge、Marginal、Tradeable、Good 或 Strong。 一键 Auto Optimize 按钮,可根据当前品种和时间周期自动调整设置。 完整套装包含 Trade Manager EA,并内置五种专为本指标设计的交易管理方案。 Prop Firm Risk Panel 可在图表上实时追踪日内回撤
    Market Structure Patterns MT4
    Samuel Manoel De Souza
    5 (18)
    Market Structure Patterns   is an indicator based on   smart money concepts   that displays   SMC/ICT   elements that can take your trading decisions to the next level. Take advantage of the   alerts ,   push notifications   and   email messages   to keep informed from when an element is formed on the chart, the price crosses a level and/or enters in a box/zone. Developers can access the values of the elements of the indicator using the   global variables  what allows the automation of trading d
    PZ ABCD Retracement
    PZ TRADING SLU
    4 (5)
    该指标找到AB = CD回撤形态。 AB = CD回调模式是一种4点价格结构,其中初始价格区间被部分回调,然后与回调完成后等距移动,这是所有谐波模式的基本基础。 [ 安装指南 | 更新指南 | 故障排除 | 常见问题 | 所有产品 ] 可定制的图案尺寸 可定制的AC和BD比率 可定制的突破时间 可定制的线条,颜色和大小 它根据CD纤维水平显示SL和TP水平 视觉/声音/推送/邮件警报,用于模式和突破 AB = CD Retracements可以扩展和重新绘制很多内容。为了使事情变得更容易,该指标实施了一个转折:它在向交易发出信号之前等待正确方向的Donchian突破。最终结果是带有非常可靠的交易信号的重新粉刷指示器。输入donchian突破时段作为输入。 看涨回撤是蓝色的 空头回撤是红色的 请注意,价格模式(例如AB = CD)可以扩展,指标必须重新绘制以跟随该模式的扩展。如果图案重涂超出了参数中输入的AC / BD / AB = CD比率,则该图案将消失,因为它将不再有效。要交易这些模式,请求助于donchian突破信号。 输入参数 幅度:AB = CD模式的大小 突围
    Trend Lines PRO
    Roman Podpora
    5 (1)
    TREND LINES PRO 帮助您了解市场真正的方向转变点。该指标显示真实的趋势反转点以及主要参与者重新入场的时机。 您可以看到 BOS线、 趋势变化和更高时间框架的关键水平——无需复杂的设置或不必要的干扰。信号不会重绘,并在K线收盘后仍然保留在图表上。 VERSION MT 5    -   与……搭配使用时,可发挥其最大潜力   RFI LEVELS PRO 指示器 该指标显示的内容: 实际变化 趋势(BOS 线) 一旦信号出现,它就始终有效!这与会重绘的指标有着重要的区别,后者可能会发出信号后又改变信号,从而导致资金损失。现在,您可以更精准、更准确地进入市场。此外,还有一个功能,会在箭头出现后为K线着色,直到达到目标价位(止盈)或出现反转信号为止。 重复条目   以及主要玩家的充值 为了提高寻找入场点时的视觉清晰度,我们创建了一个模块,该模块首先显示买入/卖出区域,并在该区域内寻找最佳入场点。此外,我们还加入了智能逻辑来管理止损位,该逻辑会随着时间的推移逐步降低止损位的大小,从而降低入场交易时的初始风险(移动止损位)。 信号强度水平(BOS) 该指标采用三个显著性等级来衡量
    Legacy of Gann
    Pavel Zamoshnikov
    4.83 (12)
    The indicator very accurately determines the levels of the possible end of the trend and profit fixing. The method of determining levels is based on the ideas of W.D.Gann, using an algorithm developed by his follower Kirill Borovsky. Extremely high reliability of reaching levels (according to K. Borovsky  - 80-90%) Indispensable for any trading strategy – every trader needs to determine the exit point from the market! Precisely determines targets on any timeframes and any instruments (forex, met
    RFI levels PRO
    Roman Podpora
    5 (1)
    该指标能够准确显示反转点和价格回落区域。     行业领军人物 。您能洞察新趋势的形成,并以最高的精准度做出决策,掌控每一笔交易。 与……结合时,展现其最大潜力     趋势线专业版   指标  VERSION MT5 该指标显示的内容: 新趋势开始时的反转结构和反转水平及其激活。 显示屏   获利了结   和   止损   风险回报比最低的水平     RR 1:2       。 具有智能减值逻辑的止损。 显示指定指标中两种趋势类型的反转形态。 指标: 根据     趋势线     (全球趋势变化) 潮流专业版     (趋势快速变化) 简单有效   扫描器   实时趋势(新增)。 多时间框架工具筛选。 展示   利润   在 LOGIC AI 信号之后。 以下列出今日走势积极的金融工具。(RB键) 能够为终端启用通知(警报)功能,并向移动设备推送通知。 逻辑人工智能     — 利用人工智能寻找最佳切入点。 只有在启用 MTF(多时间框架分析)模式时,该功能才可用。 兼容性。 当与趋势线指标结合使用时,该指标能发挥其最大潜力。 这     RFI LEVELS PRO    
    Advanced Currency IMPULSE with ALERT
    Bernhard Schweigert
    4.9 (490)
    目前40%的折扣!! 对任何新手或专家交易者来说都是最好的解决方案! 这个指标是一个独特的、高质量的、负担得起的交易工具,因为我们已经纳入了一些专有的功能和一个秘密的公式。只需一张图表,它就能给出所有28种货币对的警报。想象一下,你的交易将如何改善,因为你能够准确地确定新趋势或剥头皮机会的触发点 建立在新的基础算法上,它使识别和确认潜在交易变得更加容易。这是因为它以图形方式显示了一种货币的强势或弱势是否正在加速,并测量了这种加速的速度--把它想象成你汽车中的速度表。当你加速时,事情显然会发生得更快,这在外汇市场上也是一样的,即如果你配对的货币正在向相反的方向加速,你就会发现一个潜在的有利可图的交易。 货币动量的垂直线和箭头将指导你的交易! 动态的市场斐波那契23水平被用作警报触发器,将适应市场活动。如果冲动触及黄色触发线,您将在MetaTrader或您的电子邮件或推送警报中收到警报。然后你就知道作为一个交易员应该做什么。货币对和方向已经给出。只要点击警报按钮,就可以切换到该货币对或打开一个新的图表,以便进一步分析。警报级别可以通过用户输入来改变,可以选择3个敏感度级别。 尽
    Day Trader Master
    Oleg Rodin
    5 (15)
    Day Trader Master 是一个完整的日间交易者交易系统。该系统由两个指标组成。一个指标是买入和卖出的箭头信号。这是你得到的箭头指示器。我将免费为您提供第二个指标。第二个指标是专门设计用于与这些箭头结合使用的趋势指标。 指标不重复也不迟到! 使用这个系统非常简单。您只需按照当前趋势方向的箭头信号,显示为双色线。蓝色是买入趋势。红色是一种销售趋势。蓝色箭头是买入信号。红色箭头是卖出信号。您需要箭头的颜色和信号的方向来匹配趋势线的颜色。 箭头指标主要是为 M5 和 M15 时间间隔的日内交易而创建的。但从技术上讲,该系统可以用于其他时间间隔。 指示器配备带有推送消息功能的弹出警报。 购买后一定要写信给我!我将为您提供与系统交易的个人建议,以及我的趋势指标。此外,还有丰厚的奖励等着您!
    IQ FX Strength  answers the single most important question in trading: "Who is truly driving the market right now?" Designed with a stunning Hybrid UI, this tool separates true trend moves from market noise, allowing you to catch "Explosive" moves before the crowd sees them. System Requirement: For higher accurate signal and optimal, smoother performance of this indicator without any lag, a good CPU (with   RAM of  atleast 8GB or above) and fast internet connection is highly recommended. IQ FX
    Block Master Pro
    Stanislav Konin
    5 (3)
    The Block Master Pro indicator is designed to visually identify areas on the chart where significant volumes from major market participants are likely concentrated. These areas, known as order blocks, represent price ranges where large players place their orders, potentially signaling a price reversal and movement in the opposite direction. Key Features: Order Block Identification: Block Master Pro effectively identifies order blocks by pinpointing price ranges where large orders are placed. Th
    作者的更多信息
    What Is It? This PVSRA Screener is for real-time market analysis. so instead of manually checking charts one by one, you get a live command center that tells you the market phase, volume intent, trend state, and nearest price structure all in one glance. Features at a Glance Multi-pair, multi-timeframe scanner dashboard... monitors everything at once PVA (Price Volume Analysis)... detects Climax and Rising volume candles in real time The Dragon EMA... configurable trend anchor (default 50 EMA of
    Read detailed blogpost with screenshots here: https://www.mql5.com/en/blogs/post/764306 Note: This is the MT5 only version. The MT4 version is available here: https://www.mql5.com/en/market/product/149941 Features Kalman smoothing to reduce market noise. Supertrend bands for trend direction. Color-coded dots and arrows for quick reading. Arrow signals for trend continuation. Alerts for trend changes. Adjustable inputs for different styles. How to Use Green dots = bullish bias. Red dots = bea
    Extreme TMA System with Arrows Indicator And Buy/Sell Boxes with Take Profit & Stop Loss This is a Non-Repainting Arrows Indicator based on the Extreme TMA System. It shows TMA cross signals and the best BUY/SELL signals. Along with the most predicted TakeProfit. And StopLoss based on TakeProfit ratio. Please note: This is an Arrows only Indicator. Dashboard is sold separately here: https://www.mql5.com/en/market/product/44825 About Indicator: This indicator shows BUY/SELL Signal Arrows and
    Check out the detailed blogpost with screenshots: https://www.mql5.com/en/blogs/post/771285 Features All trades in one subwindow — Every open BUY and SELL order gets its own mini candlestick chart, no matter what symbol it belongs to. Smart price scaling — EURUSD and BTCUSD look the same size. The indicator uses ATR normalization so every trade is equally readable. Live candle updates — The latest candle reflects the real-time Bid price, not just the last close. Entry, SL & TP lines — See exact
    FREE
    About: The Nadaraya-Watson Envelope is a sophisticated yet practical technical indicator that helps traders identify overbought and oversold conditions using advanced kernel regression methods. This is the MT5 only Version. For MT4 Version go here: https://www.mql5.com/en/market/product/158640/ Key Features ATR-Based Bands: Three upper and three lower bands provide graduated overbought/oversold zones Logarithmic Scale Calculation Center Line - bullish (teal) or bearish (red) What is the Nad
    FREE
    Read detailed blogpost with screenshots here: https://www.mql5.com/en/blogs/post/770947 Features at a Glance One-click symbol change across all charts simultaneously One-click timeframe change across all charts simultaneously Live trade status on every pair button — buy/sell counts, profit/loss coloring Pending order indicators shown separately on buttons Panel background color changes with your overall profit or loss Sync panel position across all charts Sync the number of buttons per row acro
    FREE
    A Fibonacci indicator is best used with other indicators like Pivots, Support/Resistance etc. Price tends to use Fibo levels as Support or Resistance lines. So, this indicator is very useful to know when price might reverse or if a level is crossed, price might continue the trend. Also, to find the best Take Profit and StopLoss lines. Don't use Fibo Indicator alone for trading as it might not always be accurate. Use it to make your strategies better as a supporting indicator. Settings: Auto Fib
    FREE
    3 Level ZZ Semafor Scanner: This is a Dashboard indicator which uses 3LZZ Indicator in the background to find semafors. It will give priority to the semafors3 because they specify a strong signal. So, even if there is a sem1 or 2 on current bar, and if Sem3 was within "Check Previous Bars for Sem 3". Then it will show Sem3 instead. Read about this in detailed post: https://www.mql5.com/en/blogs/post/758250 And get all extra Indicators/Template from above link. Please note: Number of settings
    How To Use Check out this post for detailed description on  All Indicator extras and template: https://www.mql5.com/en/blogs/post/758259 The Best Heiken Ashi System is a simple trading system for trading based only two indicators for generate signals: Heiken ashi smoothed and Vqzz indicator multi-timeframe. The system was created for scalping and day trading but can also be configured for higher time frames. As mentioned, the trading system is simple, you get into position when the two indica
    FREE
    This indicator is based on Guppy's GMMA Strategy. And shows arrows when GMMA lines cross up or down. To have this indicator and get alerts for Multiple Timeframes and multiple Pairs you can check out the demo of this GMMA Trend Scanner indicator: https://www.mql5.com/en/market/product/38747 About GMMA In Brief: GMMA attempts to identify trends by combining two groups of moving averages with differing time periods: The long-term EMAs (30, 35, 40, 45, 50, and 60) the behaviors of investors that h
    FREE
    This is a Sharkfin Arrows Indicator. Detailed explanation and TDI extras: https://www.mql5.com/en/blogs/post/759138 This indicator will show only Arrows. It does not have TDI symbols on chart. Please get the extras from links above for TDI indicators. Sharkfin Scanner (paid): https://www.mql5.com/en/market/product/123566 TDI Scanner Dash (paid): https://www.mql5.com/en/market/product/41826 About: This Indicator finds the Shark Fin Pattern. It will show an arrow in the current bar if RSI sha
    FREE
    This is an MT5 only version. For MT4: https://www.mql5.com/en/market/product/162600/ Read detailed blogpost here with screenshots and best settings: https://www.mql5.com/en/blogs/post/766909 Introduction This tool takes raw, noisy price data and transforms it into smooth, easy-to-read trend lines that make market direction much clearer. Whether you’re a day trader, swing trader, or long-term position trader, this indicator can adapt to your style thanks to flexible kernel selection, adjustab
    This Scanner Dashboard uses the Extreme TMA System Arrows Indicator to show good BUY/SELL signals. This Product contains dashboard only. It does not contain the Abiroid_Arrow_Extreme_TMA.ex4 indicator. Arrows indicator is not necessary for dashboard to work.  To see arrows, you can buy the arrows indicator separately if you like: https://www.mql5.com/en/market/product/44822 Dash shows Slopes for current and Higher Timeframes. - 1st diamond is current TF. Next diamonds are higher TFs (Please Not
    Detailed blogpost: https://www.mql5.com/en/blogs/post/766378 Key Features Adaptive Upper/Lower bands Smooth Center Line Customizable Length (sensitivity) Non-Repainting (only current ongoing bar is updated every "Refresh After Ticks" number of ticks) Multiple Price Sources - Choose from close, open, high, low, median, typical, or weighted close Components: The Basis Line The smooth center line represents the weighted average of price. Think of this as the "true" price level when all the noise
    FREE
    Features: 1- Get OB/OS Levels from Golden MA Levels 2- Wait for Buy/Sell Start Level Cross 3- Optional: Should price cross Mid Level in earlier bars 4- Optional: Crossing bar High/Medium Volume 5- Optional: MA Stacked to check up/down trend for current TF 6- Optional: NRTR higher timeframes aligned Check Detailed blog post explained: https://www.mql5.com/en/blogs/post/758457 Levels with Buffers available here: Golden MA Levels Indicator: https://www.mql5.com/en/market/product/119515 Note: Arr
    FREE
    EMA Multi meter
    Abir Pathak
    4.92 (13)
    How the Indicator Works: This is a Multi-timeframe MA multimeter indicator which studies if price is above or below a particular EMA range and shows Red/Green/Yellow signals. Red: Price Below EMA range Green: Price above range Yellow: Price within range Indicator Properties: EMA Settings: - Default Period is 200. You can change all MA Settings like Period, MA Method (SMA, EMA, etc) or MA Applied Price (Close, Open, etc). - EMA Range list is a comma separated value list for different timeframes
    FREE
    Description This scanner uses 3LZZ TRO ex4 and scans for Semafors at given “Shift” bar. Scanner Detailed Settings: https://www.mql5.com/en/blogs/post/747456 Other Settings: Set Periods for Semafor 1,2,3 Set alerts on/off for Semafor 1,2,3 Shift bar (Bar on which semafor is scanned) Refresh After Ticks (Number of ticks when dash is refreshed) This scanner is pretty simplistic version. And a more detailed version with a different strategy is available here: https://www.mql5.com/en/market/product
    FREE
    Abiroid Slope MA
    Abir Pathak
    4.67 (3)
    Features: - Moving Average Slope for Max Past Bars - Slope Period - Slope Thresholds - Multiple Slope Type options - See slope visually as a histogram - Info Panel Show/Hide Slope Calculations and Types: The slope value is calculated using the Slope Period. Suppose Period is 5, it will check the MA value for bar (x) and bar (x+5). And find the slope angle between them. Read detailed description about Slope Types and Settings here: https://www.mql5.com/en/blogs/post/747651
    FREE
    Abiroid MA Stack
    Abir Pathak
    4.5 (4)
    Moving Average Rainbow Stack: Free: Single Currency & Single Timeframe MA Stack Very useful for finding current and higher timeframe trends. Best suited for long term trend based trading. Use fewer MAs for quick scalping. And not suitable during low volatility. Only use during high volatility and steady trending markets. Use this to enhance your existing Trend based strategies to find best trends. Read detailed description https://abiroid.com/product/abiroid-ma-stack Available MTF and Scanner v
    FREE
    Abiroid Multi Slope indicator allows you to calculate a Slope Histogram for any line of any indicator . Histogram is for 1 slope line only, but slope values can be calculated for 3 lines total. To have multiple histograms, add as many Slope indicators for custom indicators as you like on chart. You just need to provide the Indicator name, buffer value, slope's period and max number of bars back. By default it has slope calculation for TDI_v4.ex4 indicator. There is no way to specify parameters f
    FREE
    Features: - Current TF GMMA Cross and Trend (Mandatory Check.. G-Up/G-Down) - HTF GMMA Trend Check (Optional.. slanting arrow) - TDI or NRTR Trend Check (Optional.. diamond) Read post for detailed description and downloading extra indicators: https://www.mql5.com/en/blogs/post/758264 Scanner: This is a Dashboard Scanner for finding good trades using the GMMA method as base and TDI method for trend verification. All buttons for all Pairs and Timeframes are clickable and will change the chart f
    Ichimoku Scanner Dashboard
    Abir Pathak
    4.75 (16)
    Dashboard uses Ichimoku Strategy to find best trades. Get extra Indicators/Template: And read more about detailed Product Description and usage here: https://www.mql5.com/en/blogs/post/747457 Read more about Scanner Common features in detail here: https://www.mql5.com/en/blogs/post/747456 Features: Price Kumo Breakout Tenkan-Kijun Cross Chikou/CLoud and Chikou/Price Support/Resistance (SR-SS or SR-NRTR) Stochastic OB/OS and back Awesome Oscillator Higher Timeframe Ichimoku Trend Align
    TDI Multi Timeframe Scanner: This Dashboard indicator uses the TDI (Trader's Dynamic Index) Indicator to find best trades. Read detailed How to Use Guide: https://www.mql5.com/en/blogs/post/758252 Extra indicators also available in above post. Checks for: - SharkFin Pattern Free indicator for SharkFin: https://www.mql5.com/en/market/product/42405/ - TDI Trend: Strong/Weak Trend Up/Down - TDI Signal: Strong/Medium/Weak Signal for Buy/Sell - Consolidation - Overbought/Oversold - Volatility Ban
    Scanner Dashboard for Best Heiken Ashi VQZZ Arrows Indicator here: https://www.mql5.com/en/market/product/45900 Check out this post for detailed description on How To Use All Indicator extras and template: https://www.mql5.com/en/blogs/post/758259 Please note that if you are using too many pairs/timeframes, then VQZZ calculations might slow down the dashboard. So be careful not to use too many VQZZ Higher timeframes if you are using too many pairs. Also, VQZZ is based on higher timeframes. e.g
    Abiroid Profit Percent Series 1: Arrows Indicator Stochastic Ichimoku with ATR Get the Scanner for free. For getting Profit Percentages for Multiple Timeframes and Multiple Pairs. And read detailed description about this indicator and all the settings here. And get extra Indicators, Templates and settings for download: https://abiroid.com/product/profit-percent-stoch-ichimoku-with-atr Watch the tutorial video here: https://youtu.be/C45-9kWPE2Q About The Strategy: This strategy has 3 main par
    Profit Percent Series 2 The scanner dashboard available here (for  Free) : And read detailed information about MA Confluence here: https://www.mql5.com/en/blogs/post/747474 Here's a post about Common Settings for all Profit Percent Series Indicators: https://www.mql5.com/en/blogs/post/747456 Strategy: Main Signal Indicators (Any One): MA Cross (In-built) or Hull, OBV Cross, Heiken Ashi Cross Validation Indicators (Preferably less than 3): OBV (with Min Distance), Heiken Ashi, ADX, SuperTren
    This is a slope indicator for COG (Center of Gravity) indicator.   Download extra COG Indicators and read detailed description and strategy here: https://www.mql5.com/en/blogs/post/759120 Description: You can set the Slope Threshold for indicating Buy/Sell heightened levels. In the above Image the Threshold is set to 0, because of that all Bullish slope is Green and Bearish is Red. Suppose we set Threshold to -10 and 10, then this is what we get: And also set Slope Period. Default is 5, which
    This Indicator uses Center of Gravity (COG) Indicator to find you the best trades. It is a reversal based Swing Indicator which contains an  Arrows Indicator. That you can buy here from Metatrader Market. Check out this blog post for detailed How to Use Guide and links to free scanner: https://www.mql5.com/en/blogs/post/758262 Scanner needs this arrows indicator in same directory to run Copy scanner ex4 in same folder as your Arrows Indicator: MQL4/Indicators/Market/ All extra indicators and
    This strategy is best used for Trend based trading. While market is trending, price still makes smaller ranges. Darvas boxes show breakouts from these small ranges, while still following the original market trend. Detailed Description: https://www.mql5.com/en/blogs/post/747919 Features: Darvas - Check Darvas Box Breakout -   Check Price Above/Below MA or Darvas Box has crossed MA -   Min, Max Box Height -   Max Distance Between Entry Price and Darvas Box Other Indicators: - NRTR Trend Check
    Free scanner available here: https://abiroid.com/product/abiroid-ema-scalper Basic Strategy: 1: MA Crossover Up/Down Arrow (Mandatory Check) Optional Checks: 2: If NRTR Check On (Optional): For BUY: Check if NRTR blue and For SELL: NRTR Red If NRTR Shadow Distance On (Optional): Check price for 'x' bars back: at Shadow distance (ATR Multiplier distance) from NRTR line. 3: If High Volume bar On: Check if High Volume or if Medium (if on) Volume bar 'x' bars back 4: If HTF Trend Align On (Optiona
    筛选:
    无评论
    回复评论