Forex Beast Indicator
- 指标
- 版本: 1.1
- 更新: 14 一月 2025
- 激活: 5

EARLY REMINDER: The Starting price is 65 price will rise soon up to 365$ and then 750$ after first 10 copies of sales. Grab this offer now!
Introduction
Hello, traders! Welcome to the demonstration of the Forex Beast Indicator, a comprehensive tool designed to assist aspiring traders in navigating the complexities of the forex market. This indicator incorporates seven essential components to provide a well-rounded trading experience:
- Moving Averages
- Colored Zones
- Support and Resistance Levels (Previous Highs and Lows)
- Trade Signals
- Dashboard Display
- Input Customization Section
The Forex Beast Indicator is the result of extensive research, experience, and expertise. It is crafted for traders who aim to make a meaningful impact in the forex market. While this tool does not promise 100% accuracy or "get-rich-quick" solutions, it adds significant value when used wisely in conjunction with sound risk management.
Component Breakdown
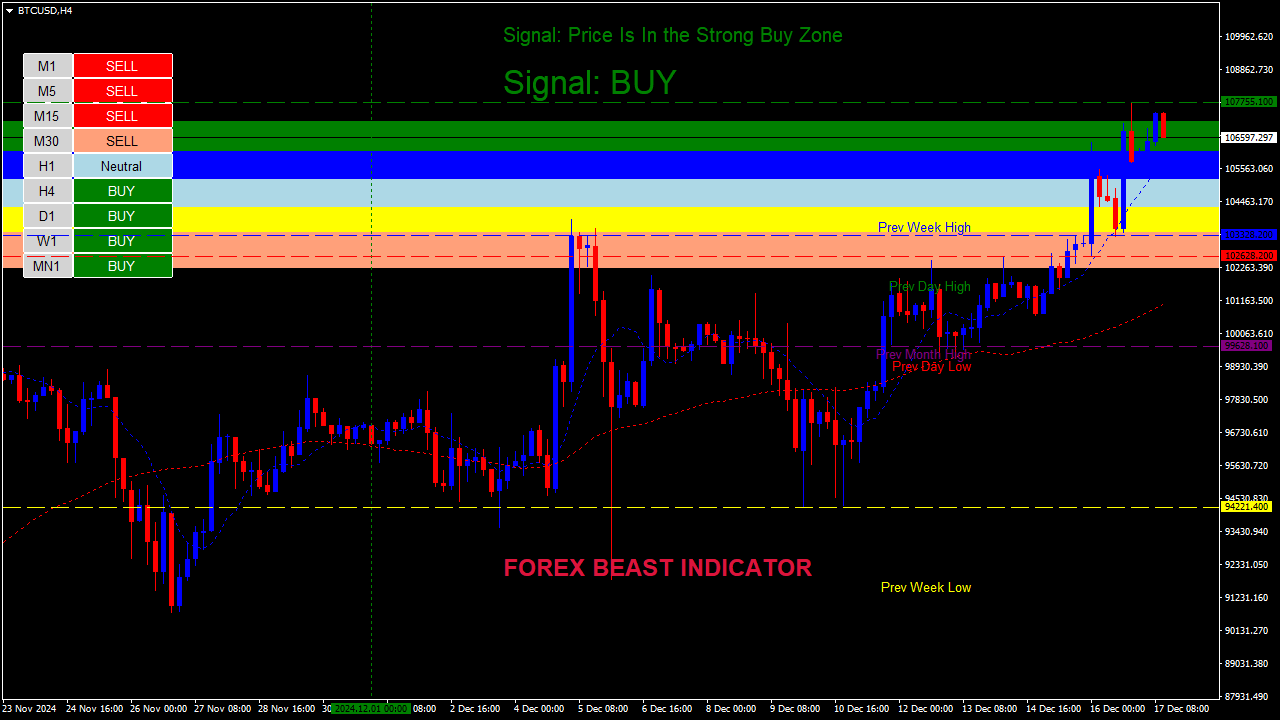
1. Moving Averages
The indicator uses short-term (blue) and long-term (red) moving averages to analyze market trends:
- The short-term moving average identifies trend reversals and filters trade signals.
- The long-term moving average gauges overall market direction and momentum.
For instance, if the long-term moving average trends upward, the market is in a bullish phase, even if minor corrections occur. Conversely, a downward trend in the long-term moving average indicates a bearish market. These moving averages are critical in determining trade direction.
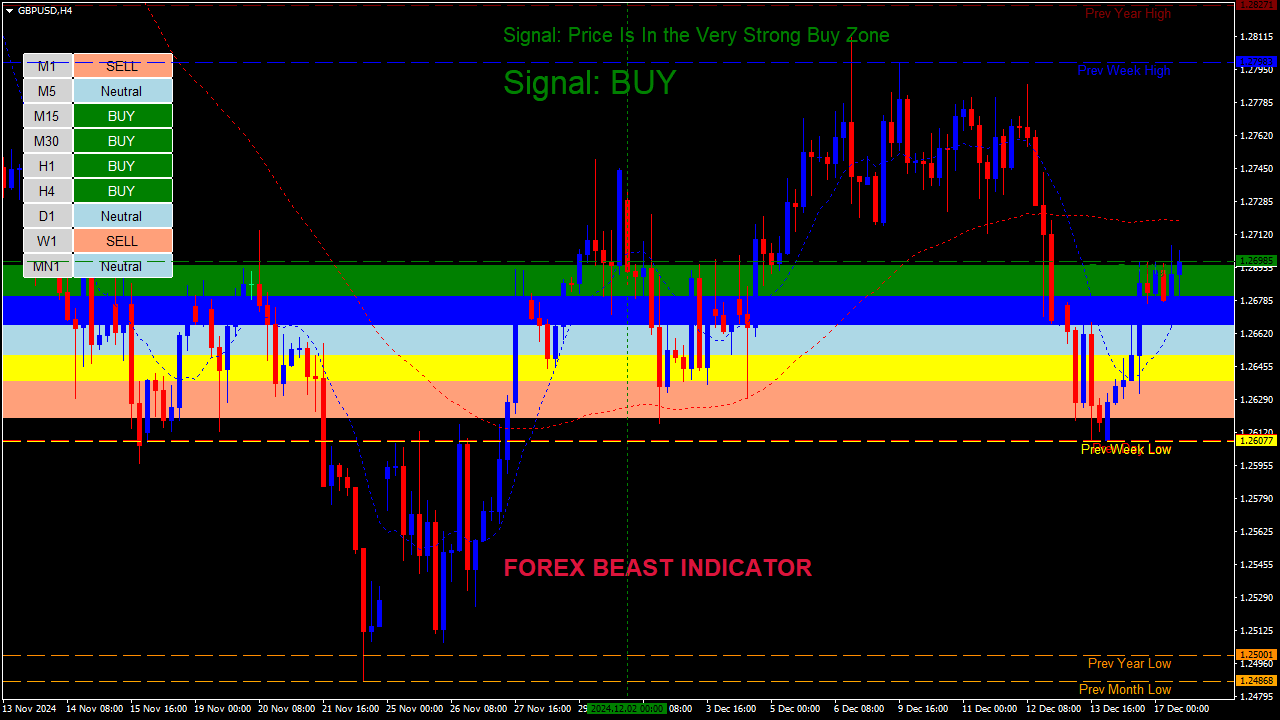
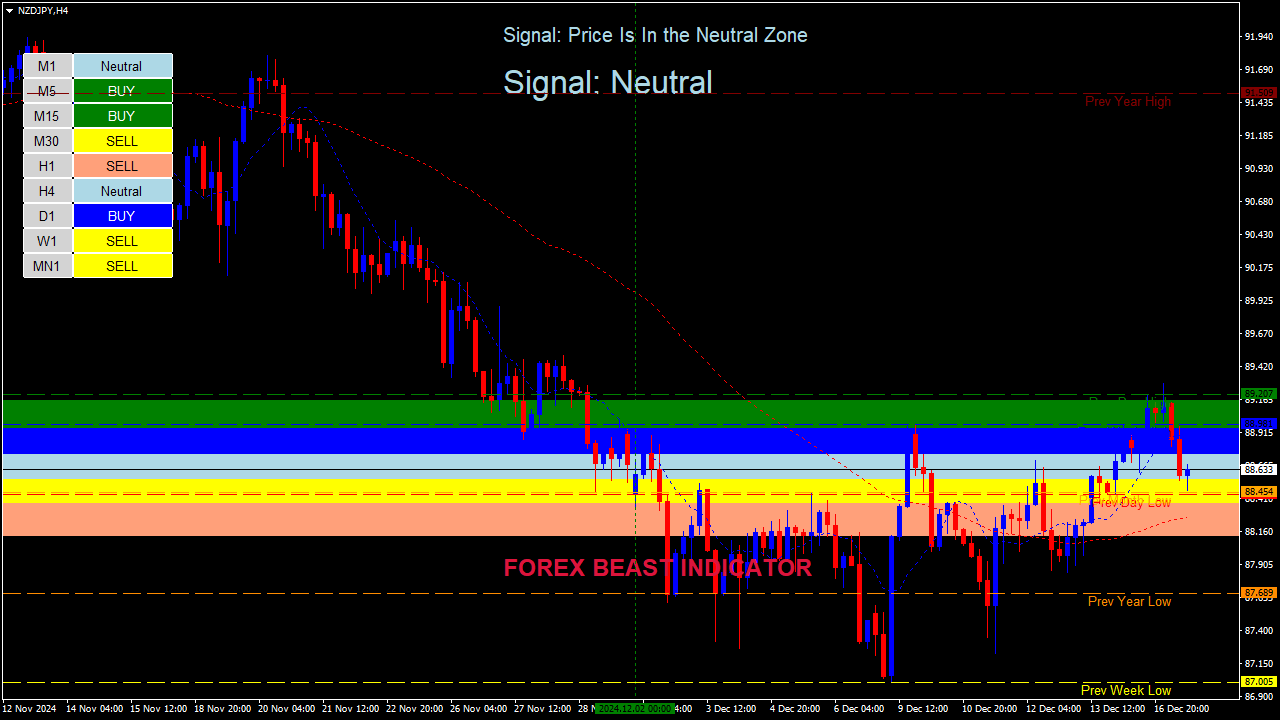
2. Colored Zones
The colored zones are dynamic, adjusting automatically to market changes and forming the foundation of the indicator’s strategy:
- Weak Sell Zone: Yellow
- Strong Sell Zone: Salmon Red
- Very Strong Sell Zone: Below Salmon Red
- Neutral Zone: Light Blue
- Weak Buy Zone: Blue
- Strong Buy Zone: Green
- Very Strong Buy Zone: Above Green
Signals are generated based on the price’s position relative to these zones. While you may rely on these signals, incorporating additional analysis of support and resistance levels is highly recommended for optimal results.
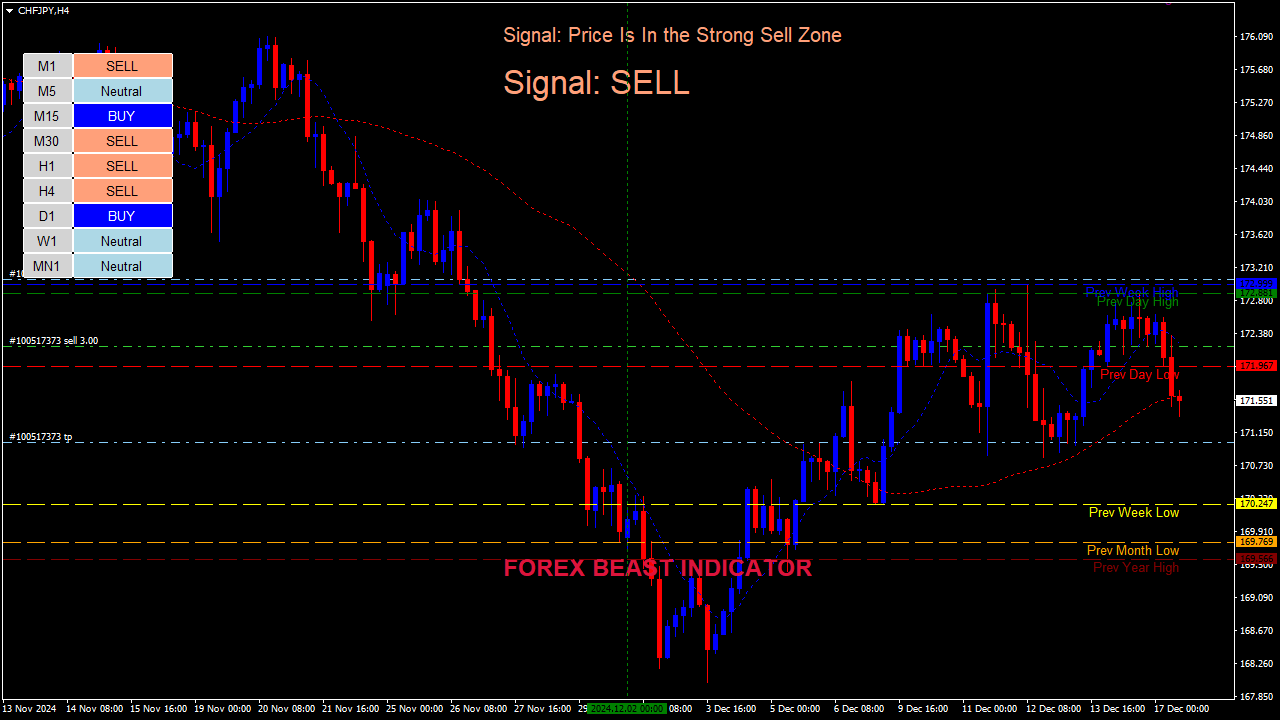
3. Support and Resistance Levels
Support and resistance levels, such as the previous day’s low or the previous week’s high, play a vital role in trade analysis.
- If the price is near a support line (e.g., previous week's low), it may rebound upward.
- If the price breaks below a support line, it could continue to drop toward the next significant level.
Conversely, resistance lines behave similarly in reverse. An in-depth understanding of these levels enhances your ability to make well-informed trades.
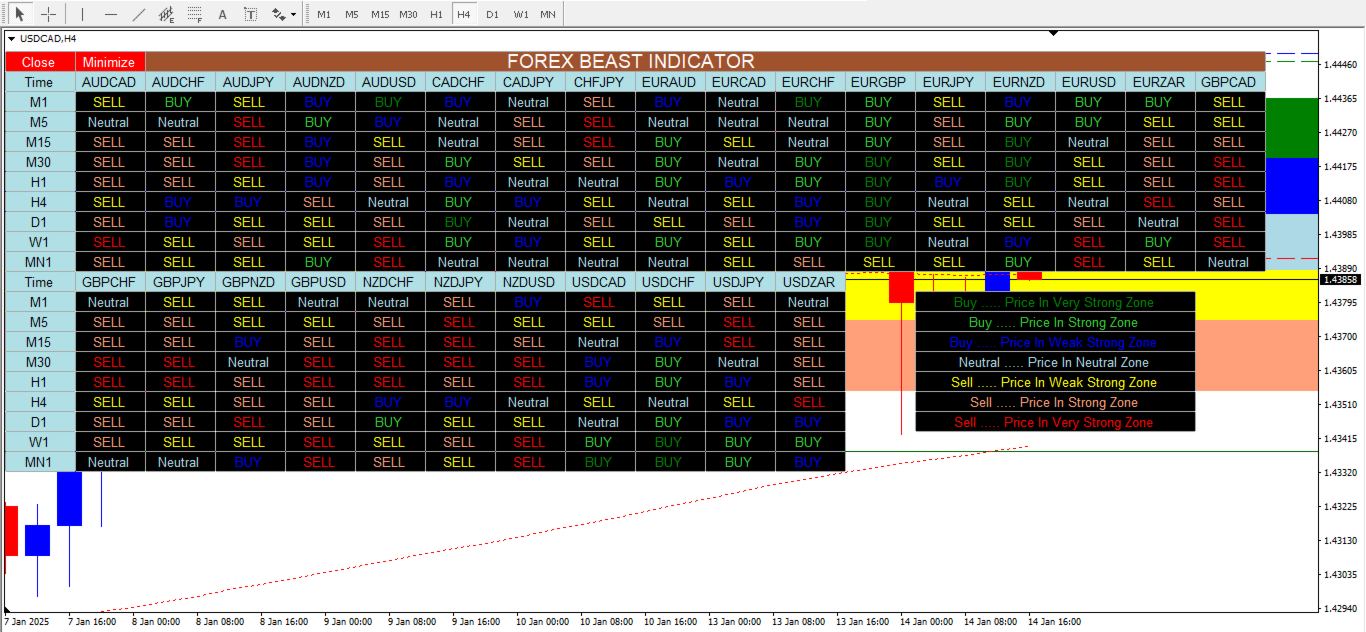
4. Signals and Dashboard
The indicator generates buy and sell signals, displayed on both the chart and the dashboard. While these signals are valuable, traders should cross-reference them with other elements like moving averages, colored zones, and candle direction to reduce risk.
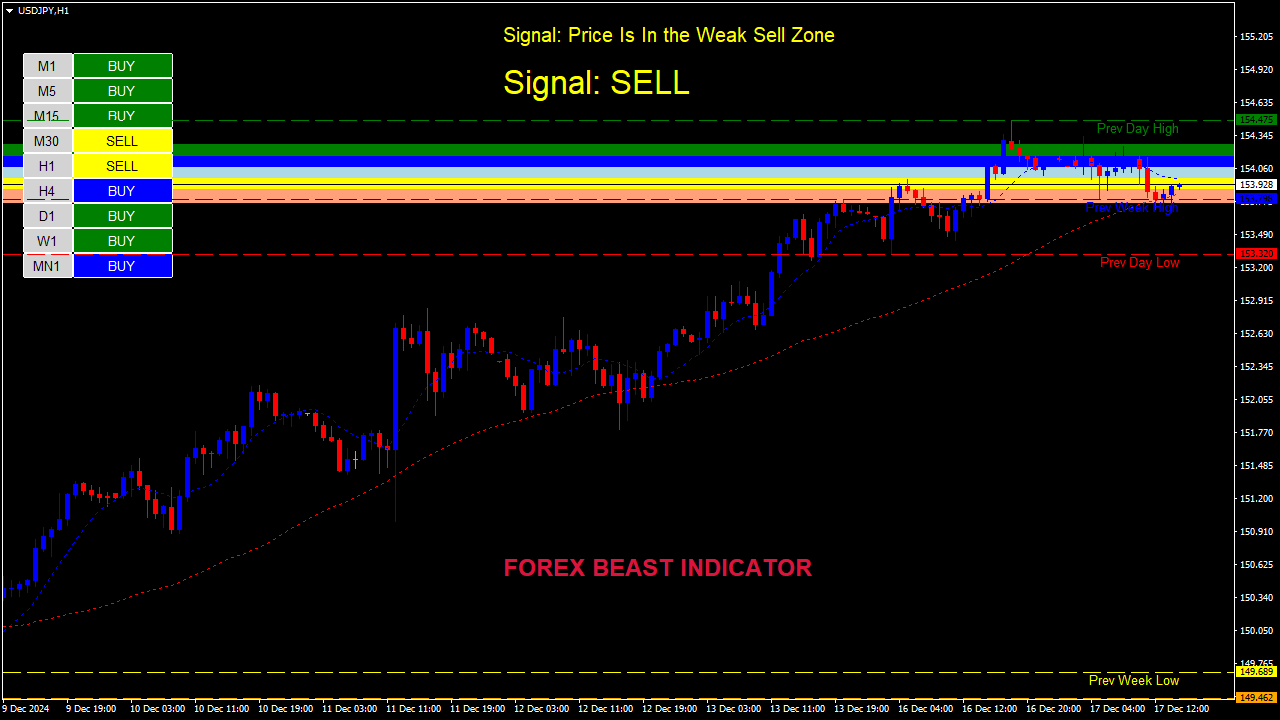
Trading Strategies with the Forex Beast Indicator
1. Single Signal Analysis
You can take trades based solely on the indicator’s signals. However, ensure:
- For buy trades, the current candle is bullish and above the blue moving average in an uptrend.
- For sell trades, the current candle is bearish and below the blue moving average in a downtrend.
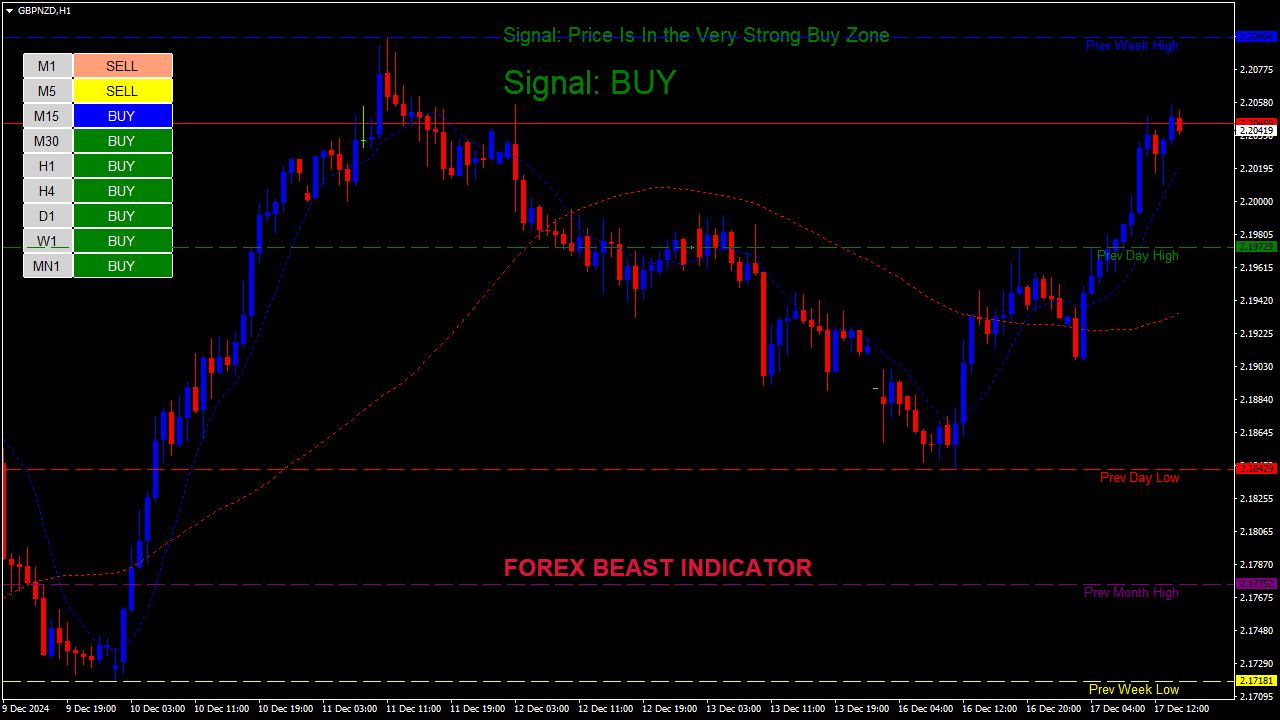
2. Multi-Timeframe Signal Analysis
This advanced strategy involves analyzing signals across multiple timeframes:
- If higher timeframes (Daily, Weekly, Monthly) align with a buy signal, wait for the lower timeframe to show the same signal. Then, take the trade in the direction of the higher timeframe.
- For sell trades, ensure all timeframes indicate strong or very strong sell signals with bearish candlestick formation.
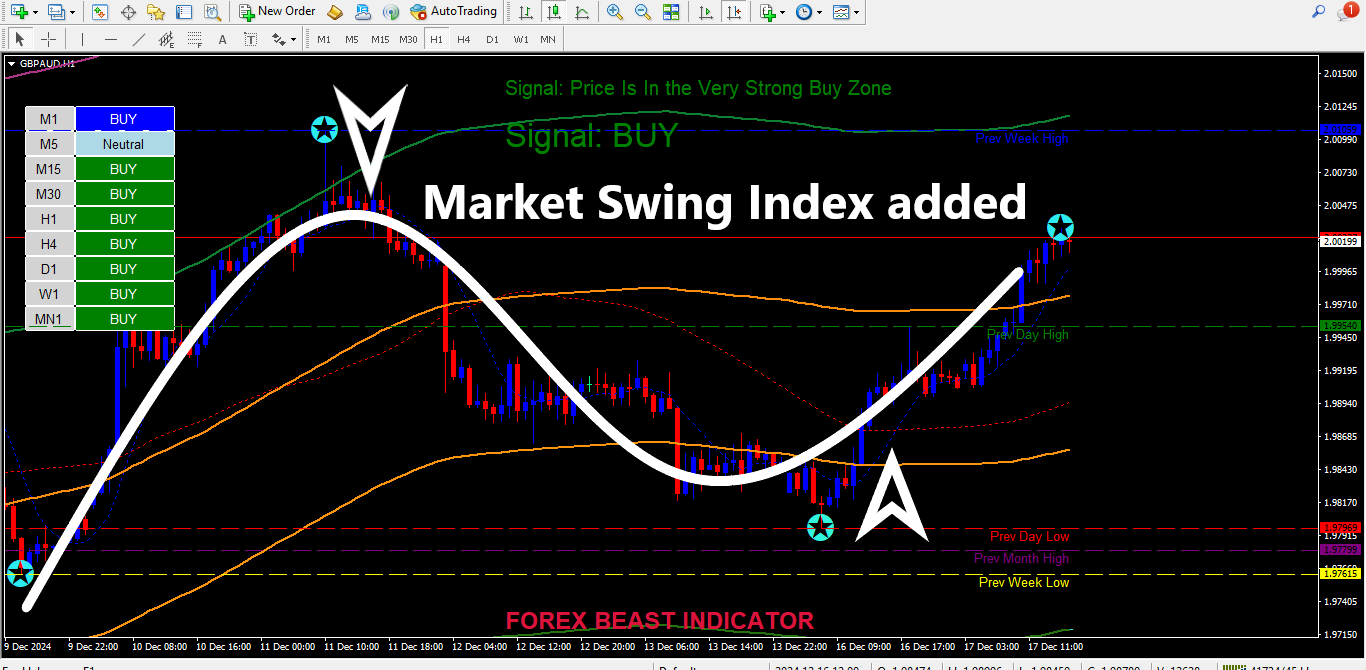
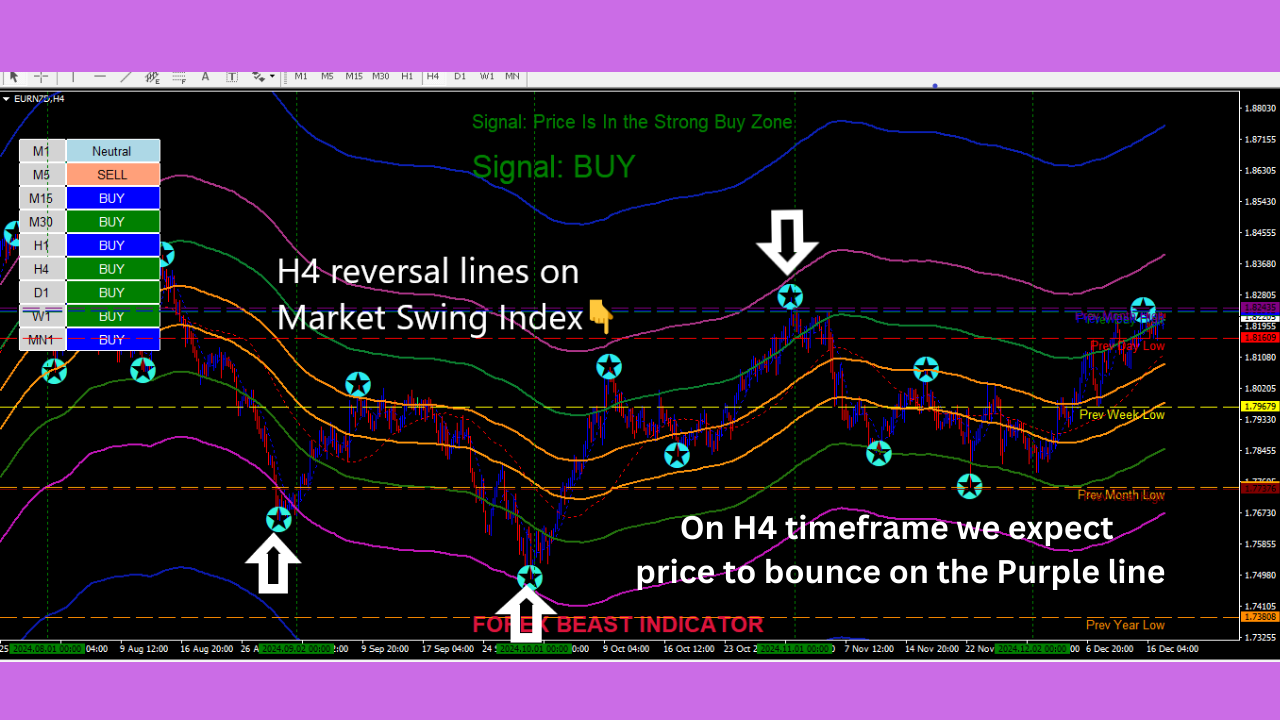
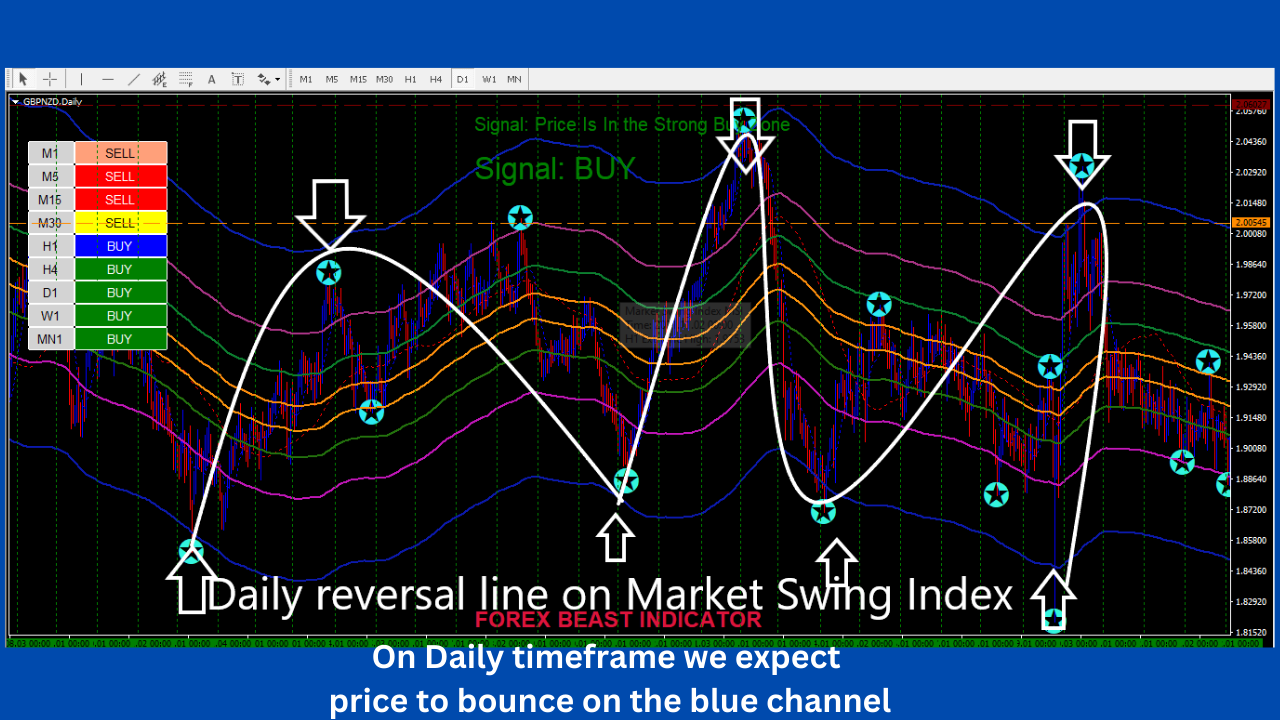
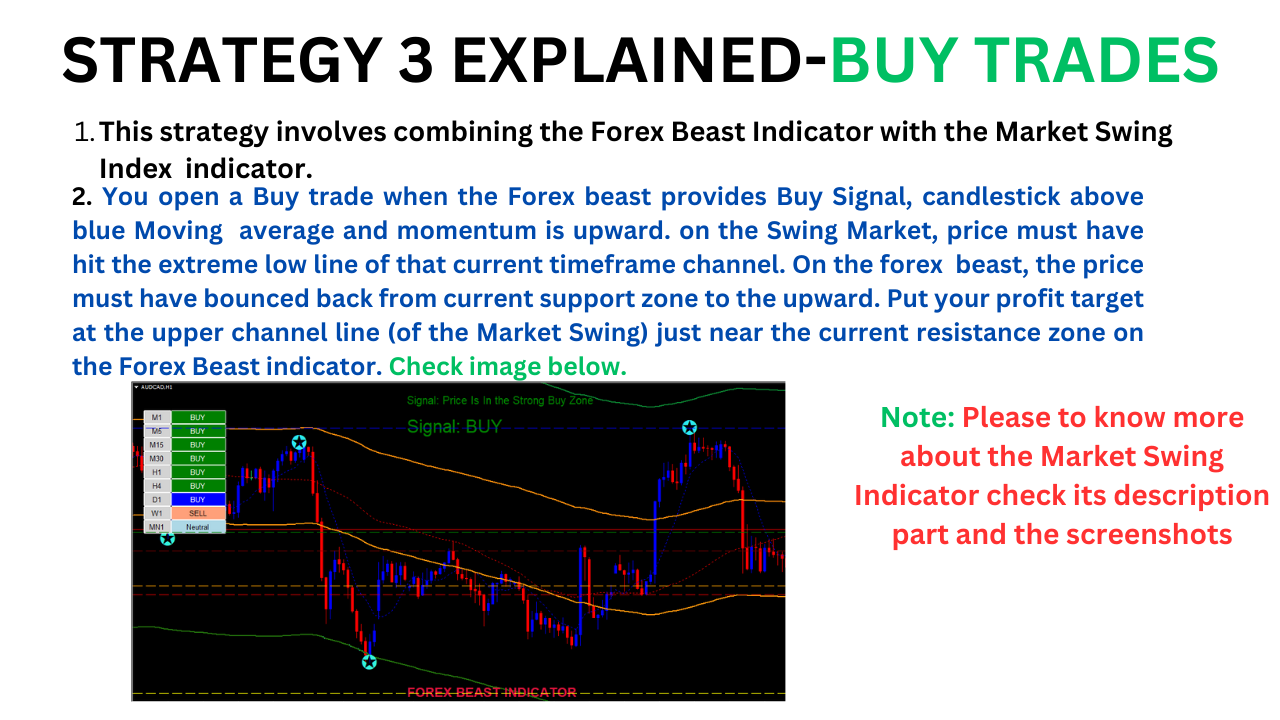
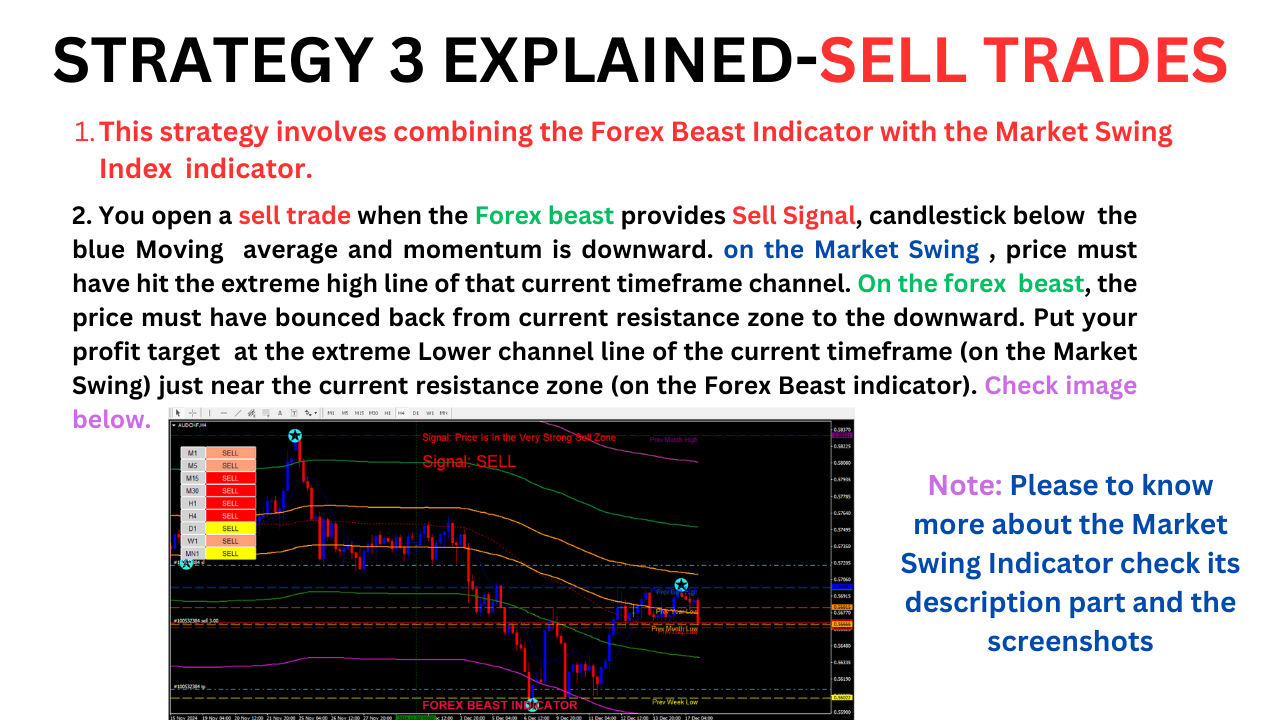
3. Combining the Forex beast indicator with Market Swing Index (I have explained more about this strategy on the secreenshots. Remember to check the screenshot please).
Note: When combining the Forex beast indicator you need to make sure that some features should be disabled to allow clear chart visibility. You should set the yellow and blue colors of the Market swing Index to NONE so that you are able to see the candlestics clearly. These colored lines for Market swing index have the size of 4 -5. so, you can go to the input section and just set the colors above to NONE. For more details check the screenshot section. To know how the Market swing index is used you can access the tool on my seller's profile and you have to go through the description and screenshot part to study the tool. This is only if you want to know exactly where the price is likely to reverse to other direction so that you target your take profit and stop loss with precision.
When these two tools are combined can result into a amazing results. However, you may still consider going with the above two strategies. In the video link attached here, I have only demonstrated the two above strategies. Therefore, it is very crucial to theck the video for better understanding.
Key Considerations:
- Use support and resistance levels to set your take profit and stop loss.
- For buy trades, consider the previous daily high as your take profit target and position your stop loss below the previous daily low.
- For sell trades, target the previous daily or weekly low and place the stop loss above the previous high.
Important Reminder
It is essential to practice with a demo account before using the indicator in live trading. Familiarize yourself with its features and strategies to build confidence and refine your skills.
Conclusion
The Forex Beast Indicator is a robust and versatile tool that offers valuable insights for traders at all levels. By combining its features—moving averages, colored zones, support and resistance levels, and multi-timeframe analysis—you can develop a strategic edge in the forex market.
Remember, consistent success comes from disciplined practice, risk management, and continuous learning. Stay connected to receive updates on upcoming trading tools.
Thank you for watching this demonstration. Let’s embark on a journey to make informed and confident trades with the Forex Beast Indicator! Incase you need any support just send me a private message and I will be very glad to help. Please after you purchase the tool don't forget to leave a nice review so that I know how this tool is performing on your side. Remember I have reduced the price as a offer the early buyers. Do not take this offer for granted. The price will soon triple! See you at the top!