Daily Trend Scalper

每日趋势黄牛 (DTS)
该指标是 RPTrade Pro Solutions 系统的一部分。

DTS 是使用价格行为、动态支撑和阻力的每日趋势指标。
它旨在供任何人使用,即使是绝对的交易初学者也可以使用它。
从不重新粉刷。
指示是从接近到接近给出的。
设计为单独使用,无需其他指标。
在一天开始时为您提供趋势和潜在的获利。


它是如何工作的
DTS 正在使用结合价格行为和动态支撑和阻力的突破策略。
分析夜间趋势和波动性以在第二天使用。
通过该分析确定突破限制(蓝色和深橙色线)以及止盈
由于历史数据,可以立即检查策略和设置的“成功”。
历史部分允许立即查看策略中是否存在任何“漏洞”,并最终选择另一个更适合的时间框架或符号。
实时从蜡烛收盘到蜡烛收盘,趋势指标等待信号条件有效,然后通过箭头显示(绿色表示买入,橙色表示卖出)。
红色点划线显示了止盈和最终止损的位置。
交易是一一指示的,永远不会同时进行两笔交易。
大多数交易(80%)在白天完成。


DTS 表示:
对于购物车上所有选定的符号:
在哪里打开您的交易。
获利和止损。
可以捕获的潜在点数。


DTS 作品
如果报价是隔夜提供的,则可以使用任何工具,例如外汇对、指数、金属、期货或任何其他工具。
从 M15 到 H1。
与任何经纪人。


DTS 功能
可靠的买入/卖出信号。
非常简单的输入。
屏幕提醒 + 推送通知 + 电子邮件通知
所有通知都非常详细,并且还提供获利,它允许从移动设备进行交易。
通过单击符号,内嵌指标显示在链接图表上。


如何使用 DTS
只需将其放在您的图表上即可。
只需按照箭头和获利/止损指示。


输入
ShowForex: [Bool] True 将显示,fasle 将隐藏外汇交易品种
ForexColor: [颜色] 选择外汇交易品种的颜色
Fx Meat Start: [Integer] 在此输入夜间趋势开始的时间。默认值为 1 点;它适用于从 0 到 23:59 引用的大多数 Fx 对。
FX Meat End: [整数] 在此输入夜间趋势结束和交易时段开始的时间。默认值适合大多数仪器。
ShowCFD: [Bool] True 将显示,fasle 将隐藏 CFD 符号
CFDColor:[颜色] 选择 CFD 符号的颜色
CFD 肉类开始:[整数] 在此处输入夜间趋势开始的时间。默认值为 1 点钟。
CFD Meat End: [整数] 在此输入夜间趋势结束和交易时段开始的时间。默认值适合大多数仪器。
CFD Session End: [Integer] 在此时间之后不会显示交易。
期货和指数也是如此。
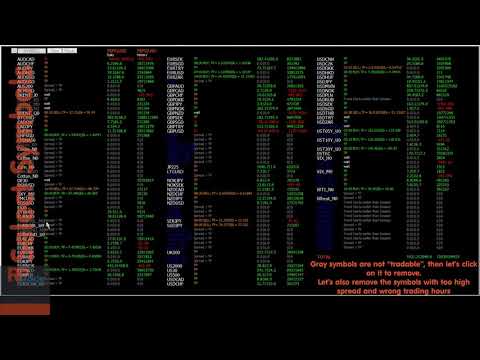
Show Only Tradables: [Bool] True 将仅显示允许交易的符号,false 将显示所有符号
手数 [双] 用于利润计算
Divider: [Double] 将趋势开始和趋势结束之间的距离除以计算止盈和止损。默认为 3,意味着 TP 和 SL 将是夜间波动距离的 1/3。
Allow Trade return [Bool] : True 将允许交易返回,如果价格走势相反,False 将保持初始方向
交易模式:[整数] 准确 = 0;野生=1;超级准确 =2,每日严格 =3
显示利润图表:[Bool] true = 显示利润图表,false = 不显示。


测试
重要的!请观看视频教程进行测试
Video Daily Trend Scalper
推荐产品
Gold Titan King Scalper
Dodong Christian Arnon
Indicator Description GOLD TITAN KING SIGNAL INDICATOR High-Precision Gold Scalping Buy/Sell Signals – Manual Trading Assistant Overview The Gold Titan King Signal Indicator is a manual trading assistant tool designed for high-frequency scalping on Gold (XAUUSD) and other major pairs. It generates clear BUY/SELL signals with precise entry levels, along with adjustable Stop Loss and Take Profit levels displayed directly on the chart. ️ This tool is NOT an EA. It does not execute trades
SMC Venom 模型 BPR 指標是針對在智慧貨幣 (SMC) 概念內工作的交易者的專業工具。它會自動辨識價格圖表上的兩種關鍵模式: FVG (公平價值缺口)是三根蠟燭的組合,其中第一根和第三根蠟燭之間存在缺口。它在水平之間形成一個沒有成交量支撐的區域,這通常會導致價格調整。 BPR (平衡價格區間)是兩種 FVG 模式的組合,形成一個「橋樑」 - 當價格以低成交量活動移動時,突破並返回到水平的區域,從而在蠟燭之間產生間隙。 這些模式可協助交易者透過分析圖表上的交易量和價格動態(大型市場參與者和普通參與者之間的互動)來識別關鍵的支撐/阻力位、突破區域和切入點。 此指標以矩形和箭頭的形式可視化模式,也支援靈活的警報設定。 主要特點: 模式顯示模式:選擇顯示 BPR 模式(看漲和看跌)或 FVG 模式(看漲和看跌)。 可以隱藏所有圖表分析模式。 以條數過濾:BPR 結構中 FVG 之間的最小/最大距離。 訊號的附加視覺化: 箭頭有 9 種類型可供選擇(標準、細、分形等)或手動輸入 Wingdings 代碼,其表格可以選擇性地顯示在圖表上。 使用 ATR 配置顏色、尺寸及其相對於價格
Owl smart levels
Sergey Ermolov
4.26 (38)
MT5版本  |  FAQ Owl Smart Levels Indicator   是一個完整的交易系統,包含   Bill Williams   的高級分形、構建正確的市場波浪結構的 Valable ZigZag 以及標記準確入場水平的斐波那契水平等流行的市場分析工具 進入市場和地方獲利。 策略的详细说明 指示灯使用说明 顾问-贸易猫头鹰助手助理 私人用户聊天 ->购买后写信给我,我会将您添加到私人聊天中,您可以在那里下载所有奖金 力量在於簡單! Owl Smart Levels   交易系統非常易於使用,因此適合專業人士和剛開始研究市場並為自己選擇交易策略的人。 策略和指標中沒有隱藏的秘密公式和計算方法,所有策略指標都是公開的。 Owl Smart Levels 允許您快速查看進入交易的信號,突出顯示下訂單的水平並向您發送有關已出現信號的通知。 優點很明顯: 清楚地顯示主要和更高時間框架的趨勢方向。 指示儀器信號的出現。 標記開單、止損設置和固定利潤的水平。 沒有多餘的,只有必要的結構! ZigZag   表示全球趨勢的方向,因此也表示貿易方向。 市場反轉點的短線清楚地表明在什
Auto Fibo Pro m
DMITRII GRIDASOV
“Auto FIBO Pro” Crypto_Forex 指标 - 是交易中的绝佳辅助工具! - 指标自动计算并放置在图表斐波那契水平和局部趋势线(红色)上。 - 斐波那契水平指示价格可能反转的关键区域。 - 最重要的水平是 23.6%、38.2%、50% 和 61.8%。 - 您可以将其用于反转剥头皮或区域网格交易。 - 还有很多机会可以使用 Auto FIBO Pro 指标来改进您当前的系统。 - 它具有信息价差掉期显示 - 它显示所连接的外汇对的当前价差和掉期。 - 显示屏还显示账户余额、净值和保证金。 - 可以将信息价差掉期显示定位在图表的任何角落: 0 - 左上角,1 - 右上角,2 - 左下角,3 - 右下角。 点击这里查看高质量的交易机器人和指标! 这是仅在此 MQL5 网站上提供的原创产品。
Crypto_Forex 指标“晨星模式”适用于 MT4。 - 指标“晨星模式”是价格行为交易的非常强大的指标:无需重绘,无延迟。 - 指标检测图表上的看涨晨星模式:图表上的蓝色箭头信号(见图片)。 - 带有 PC、手机和电子邮件警报。 - 还有它的兄弟 - 看跌“黄昏之星模式”指标可用(点击以下链接)。 - 指标“晨星模式”非常适合与支撑/阻力位结合使用。 ................................................................................................................. 点击这里查看高质量的交易机器人和指标! 这是仅在此 MQL5 网站上提供的原创产品。
这是一个预测蜡烛收盘价的指标。 该指标主要用于 D1 图表。 该指标适用于传统外汇交易和二元期权交易。 该指标可以用作独立的交易系统,也可以作为您现有交易系统的补充。 该指标分析当前蜡烛,计算蜡烛本身内部的某些强度因素,以及前一根蜡烛的参数。 因此,该指标预测市场走势的进一步方向和当前蜡烛的收盘价。 由于这种方法,该指标既适用于短期盘中交易,也适用于中长期交易。 该指标允许您设置指标在分析市场情况期间将产生的潜在信号的数量。 在指标设置中有一个特殊的参数。 此外,该指标可以通过图表上的消息、电子邮件以及推送通知的形式通知新信号。感谢您的关注!交易愉快! 购买后一定要写信给我! 我会给你我的交易指标的建议! 还可以获得奖金!
Happy Scalping Indicator
Leandro Bernardez Camero
这个指标是为 激进的 scalping 和 快速进入二元期权 设计的 ,它会在 每根蜡烛图 上生成信号,帮助你随时了解市场的动向。 加入 Happy Scalping 频道: MQL5 不重绘 :当前蜡烛的信号在 实时 生成,这意味着它可以在蜡烛形成过程中发生变化,具体取决于价格是上涨还是下跌,与前一根蜡烛的收盘价相比。 但是,一旦蜡烛 关闭 ,信号的颜色就会 完全固定 。它不会变化、消失或移动。 你看到的就是最终的信号。 为什么这样设计? 因为许多 scalper 重视即时获得信号,特别是在 价格突破或剧烈波动 时,他们可以在价格波动的同一秒钟内抓住这些快速的点数。 另一方面,也有一些交易者更喜欢等待 蜡烛收盘后的确认 ,他们也可以完美使用这个指标。 这两种方法都是有效的 ,该系统可以适应这两种风格。 重要提示: 查看视频,了解如何在实时市场中操作, 如何入场交易,何时交易,何时最好避免交易 。 该指标非常强大 ,但和任何工具一样, 理解其逻辑非常重要 ,才能最大化利用它。 如果有任何疑问,请随时联系我。我会帮你解答。
QuantumEdge Trader
Hossam Ali Ahmed Ali
QuantumEdge Trader v1.0 AI-Powered Precision Signals for Serious Traders QuantumEdge Trader is a smart and reliable indicator that delivers accurate BUY and SELL signals using advanced market analysis and trend detection. Designed for M1 to M60 timeframes, it's ideal for scalping and intraday strategies. --- Key Features: No Repaint – Signals never change after appearing Smart trend filters to reduce noise Adjustable sensitivity and alerts Perfect for XAUUSD, EURUSD, and m
EARLY REMINDER: The Starting price is 65 price will rise soon up to 365$ and then 750$ after first 10 copies of sales. Grab this offer now! Introduction Hello, traders! Welcome to the demonstration of the Forex Beast Indicator , a comprehensive tool designed to assist aspiring traders in navigating the complexities of the forex market. This indicator incorporates seven essential components to provide a well-rounded trading experience: Moving Averages Colored Zones Support and Resistance Levels
This is a new strategy for SUPPLY DEMAND areas It is based on a calculation using the tick volume to detect the big price action in market for both bear /bull actions this smart volume action candles are used to determine the supply and demand areas prices in between main supply and demand lines indicate sideway market  up arrows will be shown when prices moves above the main supply and the secondary supply lines Down arrows will be shown when prices moves below the main demand and the secondary
Super Reversal Pattern
Parfait Mujinga Ndalika
Super Reversal Pattern Indicator Unlock the power of advanced pattern recognition with our Super Reversal Pattern Indicator. Designed for traders seeking precision and reliability, this indicator identifies one of the most effective reversal patterns in technical analysis, offering a significant edge in your trading strategy. Key Features: Non-Repainting Accuracy: Enjoy the confidence of non-repainting technology. Once a Super Reversal Pattern is detected, it remains static, providing consiste
PZ Mean Reversion MT4
PZ TRADING SLU
3 (4)
采用专业和量化方法进行均值回归交易的独特指标。它利用了价格以可预测和可衡量的方式转移并返回均值这一事实,这允许明确的进入和退出规则大大优于非量化交易策略。 [ Installation Guide | Update Guide | Troubleshooting | FAQ | All Products ] 清晰的交易信号 非常容易交易 可定制的颜色和尺寸 实现性能统计 优于大多数交易策略 显示合适的止损和止盈水平 它实现了电子邮件/声音/视觉警报 这个怎么运作 该指标从更高的时间范围测量完全可定制的移动平均线的标准偏差,并使用趋势跟踪方法精确地找到交易。交易是通过深入当前图表的价格行为发现的,并在价格返回到平均价格区间时关闭,根据您选择的更高时间范围计算。由于其编码方式,该指标将远离高波动性和强劲趋势市场,并且仅在可预测的情况下进行交易,在可接受的波动性与方向性比率范围内,回归均值是可行的。 指标剖析 绿线是更高时间范围内的移动平均线(也就是平均值) 虚线区域是移动平均线周围的典型价格区间 蓝线是看涨交易的突破价格 红线是看跌交易的突破价格 交易是针对均值进行的,并在典型的价格
Awesome Oscillator by Bill Williams with the ability to fine-tune and replace the averaging algorithms of the indicator, which significantly expands the possibilities of using this oscillator in algorithmic trading and brings it closer in its properties to such an indicator as the MACD. To reduce price noise, the final indicator is processed with an additional Smooth averaging. The indicator has the ability to give alerts, send mail messages and push signals when the direction of movement of th
Fibonacci Auto Drawing
Makarii Gubaydullin
根据指定时间范围内的最高价和最低价自动绘制斐波那契水平 多个K线   可以合并:例如,您可以基于10天的最高价和最低价绘制斐波那契水平 我的   #1   工具 : 66+ 功能,包括此指标  |   联系我  如有任何问题  |    MT5版本 帮助识别潜在的反转水平; 在斐波那契水平形成的形态往往更强; 显著   减少   手动绘制   所花费的   时间 ; 设置: 计算基准最高价和最低价的时间范围 计算基准价格的周期数量  当前(浮动)K线可以包含/排除 每个级别可以自定义或禁用(设置为0以关闭) 您还可以禁用整个级别组:分别为主要级别、向上和向下扩展 线条颜色、样式和粗细  可以启用/禁用水位价格 //--------- 我的   #1   工具 : 66+ 功能,包括此指标  |   联系我  如有任何问题  |    MT4版本
The Th3Eng PipFinite indicator is based on a very excellent analysis of the right trend direction with perfect custom algorithms. It show the true direction and the best point to start trading. With StopLoss point and Three Take Profit points. Also it show the right pivot of the price and small points to order to replace the dynamic support and resistance channel, Which surrounds the price. And Finally it draws a very helpful Box on the left side on the chart includes (take profits and Stop loss
VR Cub
Vladimir Pastushak
VR Cub 这是获得高质量切入点的指标。该指标的开发是为了促进数学计算并简化对仓位入场点的搜索。多年来,该指标所针对的交易策略已被证明其有效性。交易策略的简单性是其巨大的优势,即使是新手交易者也能成功进行交易。 VR Cub 计算开仓点以及获利和止损目标水平,这显着提高了效率和易用性。查看使用以下策略进行交易的屏幕截图,了解简单的交易规则。 设置、设置文件、演示版本、说明、问题解决,可以从以下位置获取 [博客] 您可以在以下位置阅读或撰写评论 [关联] 版本为 [MetaTrader 5] 计算入场点的规则 开仓 要计算入场点,您需要将 VR Cub 工具从最后一个高点拉伸到最后一个低点。 如果第一个点在时间上早于第二个点,交易者等待柱线收于中线上方。 如果第一个点在时间上晚于第二个点,交易者等待柱线收于中线下方。 根据上述条件,严格在 柱线收盘 后建仓。 换句话说,如果我们在小时图上进行交易,那么从最高点到最低点的时间距离必须超过24小时,最高点和最低点之间的点数必须大于或等于平均价格变动每天。 维持和改变市场地位 可以有多个未平仓头寸;每个头寸都可以单独修改。 VR Cub
This EA is an extension for the free trade indicator Trend Mate . https://www.mql5.com/en/market/product/50082 The main idea is to support your decision to  trade  according to the current trend. It is possible to configure alert and push notification to receive when entering to first candle for bull / bear trend. For this extension of the free indicator now it is possible to filter the current trend info with other timeframes. For example show trend for timeframe M5 considering also timeframe
晨星 PRT 指標採用早盤持平突破原理。此指標顯示早晨持平水平並顯示可能的目標。 指標中增加了額外的斐波那契水平,以及有關設定中指定的目標水平與夜間持平水平相交的聲音警報。 晨星 PRT 指標在夜間結束時建造了一個夜間平坦通道,以及兩個向上和向下的斐波那契價格水準。這些水平可以被視為目標水平和逆轉水平。 晨星 PRT 指標適用於所有時間範圍,但在 M15 間隔上使用它最有效。 The Morning Star PRT indicator uses the morning flat breakout principle. The indicator displays morning flat levels and shows possible targets. An additional Fibonacci level has been added to the indicator, as well as sound alerts about the intersection of both target levels specified in the settings and
This product is a part of  ON Trade Waves Patterns Harmonic Elliot Wolfe you can test free version on EURJPY from this link  Wolf Waves Indicator 探索 Wolf Waves - 您的终极交易工具! 您是否正在寻找一种强大的工具,能够轻松地在任何时间框架上识别 Wolf Waves?不用再找了!我们的 Wolf Waves 指标可以轻松完成这项任务。以下是为您呈现它的理由: 主要特点: 自动检测: 我们的 Wolf Waves 指标使用复杂的算法自动查找关键点并在您的图表上绘制相应的线条。不再需要手动搜索模式。 用户友好: 无论您是专业交易员还是对 Wolf Waves 还不熟悉,我们的指标都非常易于使用。 精准性: 它非常精确,降低了虚假信号的数量,提高了您的信心。 信息丰富: 该指标不仅限于模式检测。它还提供入场点、止损水平和利润目标等重要交易信息,帮助您做出明智的交易决策。 适用于 EA: 如果您进行自动化交易,此指标可以无缝集成到您
Trend PA
Mikhail Nazarenko
5 (3)
The Trend PA indicator uses   Price Action   and its own filtering algorithm to determine the trend. This approach helps to accurately determine entry points and the current trend on any timeframe. The indicator uses its own algorithm for analyzing price changes and Price Action. Which gives you the advantage of recognizing, without delay, a new nascent trend with fewer false positives. Trend filtering conditions can be selected in the settings individually for your trading style. The indicator
Royal Dutch Skunk
Sayan Vandenhout
ROYAL DUTCH SKUNK USES THE TREND WAVE INDICATOR AND IT CAN IDENTIFY THE BEGINNING AND THE END OF A NEW WAVE TREND MOVEMENT. AS AN OSCILLATOR, THE INDICATOR IDENTIFIES THE OVERBOUGHT AND OVERSOLD ZONES. IT WORKS GREAT TO CATCH THE SHORT TERM PRICE REVERSALS AND USES A MARTINGALE STRATEGY TO CLOSE ALL TRADES IN PROFIT. USE DEFAULT SETTINGS ON H1 OR HIGHER TIME FRAME ON ANY PAIR FOR MORE ACCURATE TRADES WHY THIS EA : Smart entries calculated by 6 great strategies The EA can be run on even a $20000
GeoWprPro
Georgij Komarov
WPR by Profile, or WPR for Professionals Geo_WprPro is one of the well-known currency profile indicators. It simultaneously displays two WPR indicators with different parameters in the matrix form on all timeframes of multiple currency pairs forming the currency profile . As follows from the description, " WPR is a leading indicator that often goes ahead of the price chart. The oscillator frequently reaches extreme values before the price reversal as if anticipating that event: it almost always
Cosmic Diviner X Planet
Olena Kondratenko
4 (2)
This unique multi-currency strategy simultaneously determines the strength of trends and market entry points, visualizing this using histograms on the chart. The indicator is optimally adapted for trading on the timeframes М5, М15, М30, Н1. For the convenience of users, the indicator renders the entry point (in the form of an arrow), recommended take profit levels (TP1, TP2 with text labels) and the recommended Stop Loss level. The take profit levels (TP1, TP2) are automatically calculated for
Price Magnets
Ivan Simonika
Price Magnet — Price Density and Attraction Levels Indicator Price Magnet is a professional analytical tool designed to identify key support and resistance levels based on statistical Price Density. The indicator analyzes a specified historical period and detects price levels where the market spent the most time. These zones act as “magnets,” attracting price action or forming a structural base for potential reversals. Unlike traditional Volume Profile tools, Price Magnet focuses on price-time d
Forex Gump
Andrey Kozak
2.4 (5)
Forex Gump is a fully finished semi-automatic trading system. In the form of arrows, signals are displayed on the screen for opening and closing deals. All you need is to follow the instructions of the indicator. When the indicator shows a blue arrow, you need to open a buy order. When the indicator shows a red arrow, you need to open a sell order. Close orders when the indicator draws a yellow cross. In order to get the most effective result, we recommend using the timeframes H1, H4, D1. There
斐波那契折返和扩展画线工具 适用于MT4平台的斐波那契折返和扩展画线工具,适合于使用黄金分割交易的交易者 优点:没有多余的线,没有过长的线,易于观察发现交易的机会 试用版: https://www.mql5.com/zh/market/product/35884 主要功能: 1.可以直接画出多组斐波那契折返,可以看出重要折返点之间的关系; 2.可以画出斐波那契扩展,比率有三种0.618,1,1.618 3.画出的斐波那契折返和扩展均可左右移动,有数值显示,方便观察 4.可通过数字键切换周期 使用指南和功能键: 1.按 [ 或R画折返,按需要画折返,最多云持8组折返; 2.按 ] 或E画扩展; 3.按 \ 删除当前周期下的所有扩展和折返,其余周期的不受影响 4.如何左右移动折返和扩展 (1)点击第一组折返的F5字符,可以左右移动折返; (2)点击COP的字符 ,可以左右移动扩展; 5. (1)点击第一组折返的F5字符,按del 可以删除这组折返; (2)点击COP的字符, 按del 可以删除这组扩展; 6.修改折返和扩展(随着市场的运行,焦点或者反弹点需要修改)
交易水平指标是一个交易系统,旨在确定入场点、持有仓位和趋势方向。 包括在一个复合体中工作的多种机制、趋势方向的波浪分析、构建信号时的水平分析、显示可能的 TP 和 SL 目标。 指标能力 信号箭头出现在当前蜡烛上并且不会重新着色。 使用特殊算法来搜索价格反弹的水平。 根据趋势进行工作。 该系统具有通用性,可适用于各种交易工具。 箭头警报有多种类型。 信号箭头的输入参数在自动模式下配置和运行。 根据时间范围更改“趋势波周期”参数 “目标水平 SL TP”参数是针对主要货币对定义的;用于其他交易工具时,可以增加 10 或更多。 指标如何工作 判断趋势,该指标有一条波浪线;如果它高于价格,则趋势看跌;如果低于价格,则趋势看涨。 红色信号箭头用于购买,黄色信号箭头用于销售。 水平虚线是构建信号的电平;构建该线时,信号处于活动状态。 目标水平 SL 和 TP 的存在是为了方便技术分析和选择趋势参数。
Signal trend indicator. Detects the direction of the trend and is coloured accordingly.  Has built in audible and visual alerts when trends change. Can send notifications to your phone or email. Allows Trend and Counter-Trend trading. Works on all timeframes, all currency pairs, metals, indices and cryptocurrencies. Can be used with binary options. Distinctive features No re-drawing; Simple and clear settings; Four types of alerts; Works on all timeframes and all trading tools; Suitable
RSI Speed mp
DMITRII GRIDASOV
Crypto_Forex MT4 指标“ RSI SPEED ”——卓越的预测工具,无需重绘。 - 该指标基于物理方程计算。RSI SPEED 是 RSI 本身的一阶导数。 - RSI SPEED 非常适合顺着主趋势方向进行剥头皮交易。 - 建议结合合适的趋势指标使用,例如 HTF MA(如图所示)。 - RSI SPEED 指标显示 RSI 本身方向变化的速度——它非常敏感。 - 建议将 RSI SPEED 指标用于动量交易策略:如果 RSI SPEED 指标的值小于 0:价格动量下降;如果 RSI SPEED 指标的值大于 0:价格动量上升。 - 指标内置移动端和 PC 端警报。 ................................................... 点击这里查看高质量的交易机器人和指标! 这是仅在 MQL5 网站上提供的原创产品。
PZ Harmonacci Patterns
PZ TRADING SLU
3.17 (6)
可以说,这是您可以为MetaTrader平台找到的最完整的谐波价格形成自动识别指标。它检测19种不同的模式,像您一样认真对待斐波那契投影,显示潜在的反转区域(PRZ),并找到合适的止损和获利水平。 [ 安装指南 | 更新指南 | 故障排除 | 常见问题 | 所有产品 ] 它检测19种不同的谐波价格形态 它绘制了主要,衍生和互补的斐波那契投影(PRZ) 它评估过去的价格走势并显示每个过去的形态 该指标分析其自身的质量和性能 它显示合适的止损和获利水平 它使用突破来表明合适的交易 它在图表上绘制所有样式比率 它实现了电子邮件/声音/视觉警报 受斯科特·M·卡尼(Scott M. Carney)的书的启发,该指标旨在满足最纯粹和最熟练的交易者的需求。但是,它采取了一种使交易更容易的方式:在向交易发出信号之前,它会等待Donchian朝正确方向突破,从而使交易信号非常可靠。 斐波那契投影与向量无关 它实现了电子邮件/声音/推送警报 它绘制了ABCD投影 重要提示: 为了符合 Scott M. Carney先生 的商标申诉,某些图案名称已重命名为不言自明的替代方式, Scott M.
该产品的买家也购买
FFx Engulfing Setup Alerter gives trade suggestions with Entry, Target 1, Target 2 and StopLoss. Below are the different options available: Entry suggestion - pips to be added over the break for the entry 3 different options to calculate the SL - by pips, by ATR multiplier or at the pattern High/Low 3 different options to calculate the 2 TPs - by pips, by ATR multiplier or at Risk/Reward Offset the dashboard - any place on the chart Remove the suggestion once the price reached the SL line Lines
FFx InsideBar Setup Alerter gives trade suggestions with Entry, Target 1, Target 2 and StopLoss. Below are the different options available: Entry suggestion - pips to be added over the break for the entry Minimum candle size - to avoid too close buy/sell entry suggestions 3 different options to calculate the SL - by pips, by ATR multiplier or at the pattern High/Low 3 different options to calculate the 2 TPs - by pips, by ATR multiplier or at Risk/Reward Offset the dashboard - any place on the c
FFx OutsideBar Setup Alerter gives trade suggestions with Entry, Target 1, Target 2 and StopLoss. Below are the different options available: Entry suggestion - pips to be added over the break for the entry. 3 different options to calculate the SL - by pips, by ATR multiplier or at the pattern High/Low. 3 different options to calculate the 2 TPs - by pips, by ATR multiplier or at Risk/Reward. Offset the dashboard - any place on the chart. Remove the suggestion once the price reached the SL line.
FFx PinBar Setup Alerter gives trade suggestions with Entry, Target 1, Target 2 and StopLoss. Below are the different options available: Entry suggestion - pips to be added over the break for the entry Minimum candle size - to avoid too small candles 3 different options to calculate the SL - by pips, by ATR multiplier or at the pattern High/Low 3 different options to calculate the 2 TPs - by pips, by ATR multiplier or at Risk/Reward Offset the dashboard - any place on the chart Remove the sugges
FFx MACD Divergences
Eric Venturi-Bloxs
The purpose of this new version of the MT4 standard indicator provided in your platform is to display in a sub-window multiple timeframes of the same indicator with its divergences. See the example shown in the picture below. But the display isn't like a simple MTF indicator. This is the real display of the indicator on its timeframe. Here's the options available in the FFx divergences indicator: Select the timeframes to be displayed (M1 to Monthly) Define the width (number of bars) for each tim
FFx RSI Divergences
Eric Venturi-Bloxs
The purpose of this new version of the MT4 standard indicator provided in your platform is to display in a sub-window multiple timeframes of the same indicator with its divergences. See the example shown in the picture below. But the display isn't like a simple MTF indicator. This is the real display of the indicator on its timeframe. Here's the options available in the FFx divergences indicator: Select the timeframes to be displayed (M1 to Monthly) Define the width (number of bars) for each tim
FFx CCI Divergences
Eric Venturi-Bloxs
The purpose of this new version of the MT4 standard indicator provided in your platform is to display in a sub-window multiple timeframes of the same indicator with its divergences. See the example shown in the picture below. But the display isn't like a simple MTF indicator. This is the real display of the indicator on its timeframe. Here's the options available in the FFx divergences indicator: Select the timeframes to be displayed (M1 to Monthly). Define the width (number of bars) for each ti
The FFx Dashboard MTF alerter will show you on a single chart all the timeframes (M1 to Monthly) with their own status for the indicator. 2 Alert Options: Single timeframe: each selected timeframe alert separately when a signal occurs Multi timeframes: all selected timeframes must agree for an alert to be triggered Both options have an input to select the timeframes to be used for the alert(s). How to Understand the Status: Green/Red square: histogram above/below 0 line Green square + Red bord
The FFx Dashboard MTF alerter will show you on a single chart all the timeframes (M1 to Monthly) with their own status for the indicator. 2 Alert Options: Single timeframe: each selected timeframe alert separately when a signal occurs Multi timeframes: all selected timeframes must agree for an alert to be triggered Both options have an input to select the timeframes to be used for the alert(s). How to understand the status: Green/Red square: RSI above/below 50 line Green square + Red border: R
The FFx Dashboard MTF alerter will show you on a single chart all the timeframes (M1 to Monthly) with their own status for the indicator. 2 Alert Options: Single timeframe: each selected timeframe alert separately when a signal occurs Multi timeframes: all selected timeframes must agree for an alert to be triggered Both options have an input to select the timeframes to be used for the alert(s). How to understand the status: Green/Red square: Stoch above/below 50 line Green square + Red border:
The FFx Dashboard MTF alerter will show you on a single chart all the timeframes (M1 to Monthly) with their own status for the indicator. 2 Alert Options: Single timeframe: each selected timeframe alert separately when a signal occurs Multi timeframes: all selected timeframes must agree for an alert to be triggered Both options have an input to select the timeframes to be used for the alert(s). How to understand the status: Green/Red square: Price above/below Cloud (Kumo) Green square + Red bo
The FFx Dashboard MTF alerter will show you on a single chart all the timeframes (M1 to Monthly) with their own status for the indicator. 2 Alert Options: Single timeframe: each selected timeframe alert separately when a signal occurs Multi timeframes: all selected timeframes must agree for an alert to be triggered Both options have an input to select the timeframes to be used for the alert(s). How to understand the status: Green/Red square: MA pointing Up/Down Green square + Red border: MA po
The FFx Dashboard MTF alerter will show you on a single chart all the timeframes (M1 to Monthly) with their own status for the indicator. 2 Alert Options: Single timeframe: each selected timeframe alert separately when a signal occurs. Multi timeframes: all selected timeframes must agree for an alert to be triggered. Both options have an input to select the timeframes to be used for the alert(s). How to understand the status: Green square: Price above PSAR Red square: Price below PSAR Options
The FFx Dashboard MTF alerter will show you on a single chart all the timeframes (M1 to Monthly) with their own status for the indicator. 2 Alert Options: Single timeframe: each selected timeframe alert separately when a signal occurs Multi timeframes: all selected timeframes must agree for an alert to be triggered Both options have an input to select the timeframes to be used for the alert(s). How to understand the status: Green/Red square: CCI above/below levels (ie. 100/-100) Grey square: C
The FFx Dashboard MTF alerter will show you on a single chart all the timeframes (M1 to Monthly) with their own status for the indicator. 2 Alert Options: Single timeframe: each selected timeframe alert separately when a signal occurs Multi timeframes: all selected timeframes must agree for an alert to be triggered Both options have an input to select the timeframes to be used for the alert(s). How to understand the status: Green/Red square: ADX above level Grey square: ADX below level Red bor
The FFx Dashboard MTF alerter will show you on a single chart all the timeframes (M1 to Monthly) with their own status. 2 Alert Options: Single timeframe: each selected timeframe alert separately when a signal occurs Multi timeframes: all selected timeframes must agree for an alert to be triggered Both options have an input to select the timeframes to be used for the alert(s). How to understand the status: Green/Red square: bullish/bearish candle Options available in the FFx Dashboard Alerter
THE GRAFF III
Antonin Skaryd
The [GRAFF] III manual trading system is based on multiple MetaTrader (MT4) indicators. Together, the entire PACK of GRAFF III indicators makes an advanced trading tool. The system consists of over 20 different custom-built indicators which have been carefully selected and tested in the long term to produce strong and efficient trading signals. The particular indicators are based on different mathematical formulas, so the entire system is calibrated to remove false signals from its own indicator
FFx Universal Strength Meter PRO is more than a basic strength meter. Instead of limiting the calculation to price, it can be based on any of the 19 integrated strength modes + 9 timeframes. With the FFx USM, you are able to define any period for any combination of timeframes. For example, you can set the dashboard for the last 10 candles for M15-H1-H4… Full flexibility! Very easy to interpret... It gives a great idea about which currency is weak and which is strong, so you can find the best pai
FFx Basket Scanner
Eric Venturi-Bloxs
MetaTrader 5 version available here : https://www.mql5.com/en/market/product/24882 FFx Basket Scanner is a global tool scanning all pairs and all timeframes over up to five indicators among the 16 available. You will clearly see which currencies to avoid trading and which ones to focus on. Once a currency goes into an extreme zone (e.g. 20/80%), you can trade the whole basket with great confidence. Another way to use it is to look at two currencies (weak vs strong) to find the best single pairs
FFx Pivot SR Suite PRO
Eric Venturi-Bloxs
MetaTrader 5 version available here: https://www.mql5.com/en/market/product/25794 FFx Pivot SR Suite PRO is a complete suite for support and resistance levels. Support and Resistance are the most used levels in all kinds of trading. Can be used to find reversal trend, to set targets and stop, etc. The indicator is fully flexible directly from the chart 4 periods to choose for the calculation: 4Hours, Daily, Weekly and Monthly 4 formulas to choose for the calculation: Classic, Camarilla, Fibonac
Sweet Waffle
Christophe Godart
The arrows are calculated with: -     2 Parabolic  parameters -     2 ADX parameters -     4 Stochastic parameters We recommend to combine it with Parabolic, ZigZag or Elliot waves indicator. Always trade the trend! If you make sure to draw your trend lines and support/resistance zones you will just have to wait for the signal to appear. Take the trade. For Binary Options it is advisable to set the expiry time to 5-15 min in M1 chart. THIS INDICATOR IS ZERO REPAINT Best assets to trade: - EUR
Let´s try to make some real money! Call me profit addicted. I thought why not try to make THE dream come reality. With discipline, a clear strategy and this indicator I focus on entering the perfect trades. This indicator is very easy to use as you will get perfect entry points for Put or Call trades. The arrows are calculated with: -     Momentum  parameters -     Candle stick patterns -     Fundamental Price action We recommend to combine it with Parabolic, ZigZag or Elliot waves indicator
Golden Chip
Daishon Cotman
Golden Chip provides Basic Market Structure, Fibonacci, supply and Demand Zones. Letting you identify when a sell off point is approaching or whne a buy opportunity is arriving. The awesome thing about Golden Chip is that, you will see rejection levels or continuation before ANYBODY ! This indicator moves directly with price and lines up perfectly with the Chart. Some indicators would lag but NOT this one ! Golden Chip is amazing for Clean chart (Naked Chart). GOLDEN CHIP IS ONLY ON METATRADER (
***** The REAL , ORIGINAL, Non-Repainting, Non-Delaying, Arrow Trade Entry indicator for Very Low-Risk market execution ***** ***This is the Golden standard in arrow indicators for MT4.*** BING Setup Arrows Indicator(BSA) will show easy-to-read High Probability trading situations with Non-Repainting , Non-Delaying , Up or Down arrows on the graph.  So simple, it's brilliant. Always shows very good trading setups, no flashy colors, confusing configurations, hard-to-read dashboards, etc.  Perfec
****** Easy to understand, correct Trade direction indicator, quick and easy to visualize******* BING Proper Path Indicator(BPP) will show BUY/SELL signals on-screen in an easy-to-understand 'Traffic Light' format. Provides a final 'reassurance' and 'peace of mind' for taking an educated, high probability, low-risk, trade decision. In the same way, you use a rearview mirror for instantaneous information while taking a driving decision, the same way BING Proper Path Indicator(BPP) will help you
Risk Reward ratio indicator for MT4  BING Risk Reward indicator is a powerful, basic, very needed tool for every trader. Clearly visualize Open Price , Stop Loss , and Top Profit levels on your graphs with easy-to-see colors and trendlines. Does BING Risk Reward show alerts? Of course! BING Risk Reward Indicator offers all Alerts available for the MT4 platform(Email, Popups, Sound, and Push). It shows alerts on Open Price , Stop Loss , and Top Profit. That way, besides easily seeing what is go
The channels
Mansour Rahkhofteh
Counter trade type indicator. Jcounter can capture the timing of the trend collapse phase. There are signs of a trend collapse. It is the world standard to confirm the sign with LSMA adopted by Jcounter. The numerical setting of LSMA is very important, but after many years of verification, the numerical value was identified and completed. When the trend starts, the rising market moves like a support, and the falling market moves like a resistance. Gradually overtake the candlestick and
Axebagsh
Batsukh Sumchin Khuyagbaatar
Only work on Crude Oil H1  time frame  Swing follow trend.  do not trade against trends Specifies the first destination and entry and exit points For 16 years, I only traded on CrudeOil. Crude oil is one of the most extreme combinations in the world and it is safe to say that such a good indicator has never been made before.   This indicator will save you a lot of money because it introduces a new type of approach, Good luck
作者的更多信息
PipsMinerFast
Remi Passanello
3 (2)
PipsMinerFast is mainly a trend follower with a bit of price action. At first sight, you will think: "Oh well, one more indi showing everything I've missed today but not giving a clue about what will happen..." Okay, you can believe this when just looking at it but start a test it and you will see that PipsMinerFast: Shows you the trend immediately Is not repainting Has minimum lagging Counts pips immediately Adapts to your spread level Works from M1 to H1 Is heading in the right direction 90% o
Scalp Tool
Remi Passanello
5 (1)
头皮工具是一个非常有效的反趋势指标。 它旨在供任何人使用,即使是交易新手也可以使用它。 头皮工具不会重新绘制。 指示从接近到接近或从接近到可见水平给出。 头皮工具可单独使用,无需其他指标。 头皮工具指示 在哪里打开您的交易。 何时关闭它们。 在哪里下止损单。 在现场测试期间准确率超过 80%。 头皮工具工作 使用任何工具,如外汇对、指数、金属、期货或其他... 在任何时间范围内。 与任何经纪人。 头皮工具特点 TradeType Wise:将进行短暂的交易以限制风险和风险。箭头将指示您何时停止。 TradeType Medium:平衡的配置文件,通过中等长度的交易产生更多的点数。停止由灰色带和箭头指示。 TradeType 最大值:通过相当长的交易产生更多的点数。停止由绿色和红色色带和箭头指示。 如果交易是积极的,则在止损箭头上显示检查。 如果交易为负,则在止损箭头上显示十字。 显示支撑和阻力 显示盈亏平衡 如何使用头皮工具 只需将其放在您的图表上即可。 选择你最喜欢的颜色。 确定您希望使用的交易类型:明智、中等或最大。 是否设置警报。 只需按照箭头指示即可。 支撑
Trend Wave
Remi Passanello
5 (5)
Trend Wave 是一种先进的交易工具;基于支撑和阻力的趋势和反向交易指标。 Trend Wave 旨在随时进行活跃交易 趋势波并不落后 在新蜡烛的开头给出指示 趋势波表示 指标窗口显示 S 和 R 的实际计数以获取总体趋势 白线显示即时趋势。 在主图表窗口上,彩色箭头显示最后一个有效的 S 和 R。这也有助于查看趋势。 趋势波作品 在任何时间范围内 与任何乐器 与任何经纪人 趋势波功能 主动 R/S 的直方图表示 平均 R/S 线 带彩色箭头的 R/S 直方图上的反转指示 如何使用趋势波 非常容易设置... 把它放在你的图表上 调整输入 跟随趋势直到出现反转(白线离开主要趋势的边缘) 很高兴知道 不要将彩色箭头视为“设置交易”指示,因为它们显示 R/S。当支撑或阻力被打破时,你会看到它们消失了,所以只剩下完整的 R 或 S;这就是“波”的概念。 如果您打算使用箭头作为交易指标(我不推荐),最好是为每笔交易使用非常小的手数(1% 的风险就足够了) 输入(针对 V1.4 更新) 在图表上显示箭头:[bool] true = 在图表上显示趋势箭头 fals
Trend Compound
Remi Passanello
3 (2)
Trend Compound is a trend indicator using a mix of 3 internal other indicators. Please have a look at "how to test in the tester" at the bottom of this page before to test. It's designed to be used by anyone, even the complete newbie in trading can use it. Trend Compound does not repaint . Indications are given from close to close. Trend Compound can be used alone , no other indicators are required. Trend Compound indicates Where to open your trades. When to close them. The potential quantity o
Breakout Pro 黄牛解决方案 该指标是 RPTrade Pro Solutions 系统的一部分。 Breakout Pro Scalper 解决方案是使用价格行为、动态支撑和阻力的每日趋势指标。 它旨在供任何人使用,即使是绝对的交易初学者也可以使用它。 从不重新粉刷。 指示是从接近到接近给出的。 设计为单独使用,无需其他指标。 在一天开始时为您提供趋势和潜在的获利。 特定图表根据历史数据向您显示潜在利润。 它是如何工作的 Breakout Pro Scalper 解决方案使用结合价格行为和动态支撑和阻力的突破策略。 分析夜间趋势和波动性以在第二天使用。 通过该分析确定突破限制(蓝色和深橙色线)以及止盈 由于图表上的图表,可以立即检查策略和设置的“成功”。 OnChart 图表允许立即查看策略中是否存在任何“漏洞”,并最终选择另一个更适合的时间帧或符号。 实时从蜡烛收盘到蜡烛收盘,趋势指标等待信号条件有效,然后通过箭头显示(绿色表示买入,橙色表示卖出) 红色点划线显示了止盈和最终止损的位置。 交易是一一指示的,永远不会同时进行两笔交易。 大多数交易(80%)在白天完成
Waxter D1
Remi Passanello
瓦克斯特 D1 该机器人是 RPTrade Pro Solutions 系统的一部分。 WAXTER 是一个使用趋势指标、振荡器和价格行为的机器人。 它旨在供任何人使用,即使是绝对的交易初学者也可以使用它。 主要为D1设计,最终也可用于H4 使用获利、止损和追踪止损。 也可作为无止损/止盈的开关 为玩家提供鞅和反鞅系统。 适用于任何对 很多 .Set 文件可用。 它是如何工作的 WAXTER 是 Trend-Wise EA,意味着它的策略是顺着趋势的方向进行交易。 WAXTER 使用结合价格行为和动态支撑和阻力的趋势策略。 特定的嵌入式 WAX 指标用于确定趋势 当检测到趋势时,根据参数,在其方向上开始交易 交易被 TP/SL/TS 或下一个相反的交易停止。 没有对冲,没有平均。 一笔交易必须在下一笔交易开始之前结束。 WAXTER 仅控制柱线开盘,意味着它在开盘价模式下工作。 瓦克斯特作品 使用任何工具,如外汇对、指数、金属、期货或任何其他工具。 每种不同的工具都需要优化和回测 在 D1 和 H4 中(使用前的回测)。 与任何经纪人。 无论如何。 WAXTER 特点 屏
BPSPanel
Remi Passanello
BPS Panel Breakout Pro Scalper Solution Panel This indicator is part of the   RPTrade Pro Solutions  systems. BPS Panel   is a daily trend indicator using Price Action, Dynamic Support and Resistances. It's designed to be used by anyone, even the absolute beginner in trading can use it. NEVER repaints . Indications are given   from close to close . Designed to   be used alone , no other indicators are required. Gives you the trend and potential Take Profit at the beginning of the day. How doe
Market Shaver
Remi Passanello
市场剃须刀   市场黄牛 该指标是 RPTrade Pro Solutions 系统的一部分。 Market Scalper 是使用价格行为、动态支撑和阻力的每日趋势指标。 它旨在供任何人使用,即使是绝对的交易初学者也可以使用它。 从不重新粉刷。 指示是从接近到接近给出的。 设计为单独使用,无需其他指标。 为您提供清晰简单的指示 它是如何工作的 Market Shaver 正在使用 Dual TimeFrames 系统。 主要趋势由较高的 TF 采取,而较快的 TF 用于关闭交易 交易是一一指示的,永远不会同时进行两笔交易。 市场剃须刀表示: 何时进行交易 何时停止它,盈利或亏损。 交易奖励 许多统计数据可帮助您设置正确的 Period end TF 市场剃须刀工作 使用任何工具,如外汇对、指数、金属、期货或任何其他工具。 从 M1 到 H1。 与任何经纪人。 (较低的点差会给您带来更多的点数) 市场剃须刀功能 可靠的买入/卖出信号。 非常简单的输入。 (默认的应该适用于几乎所有的乐器) 屏幕提醒 + 推送通知 + 电子邮件通知 所有通知都非常详细,并且还提供获利,它允许
The Daily Trader
Remi Passanello
每日交易者   该指标是 RPTrade Pro Solutions 系统的一部分。 每日交易者是仅使用统计数据的每日指标。 它旨在供任何人使用,即使是绝对的交易初学者也可以使用它。 从不重新粉刷。 指示是从接近到接近给出的。 设计为单独使用,无需其他指标。 为您提供清晰简单的指示 它是如何工作的 统计系统分析历史以发现符号行为中的冗余。 交易是一一指示的,永远不会同时进行两笔交易。 它表示: 何时进行交易 在哪里放置止盈 未来 24 小时内要进行的交易 作品 使用任何工具,如外汇对、指数、金属、期货或任何其他工具。 仅在 H1 与任何经纪人。 (较低的点差会给您带来更多的点数) 特征 可靠的买入/卖出信号。 非常简单的输入。 屏幕提醒 + 推送通知 + 电子邮件通知 所有通知都非常详细,并且还提供获利,它允许从移动设备进行交易。 帮助您找到正确设置的利润图表 只需启用/禁用每日交易,即可直接在图表上调整设置 如何使用它 ? 只需将其放在您的图表上即可。 只需遵循指示即可。 输入 UsePush: [Bool] true 将发送推送通知。 UseMail: [Boo
GannRS Trend Scalper   GannRS is an advanced trading tool based on Gann Law and Supports and Resistances. designed to have an   active trading at any time not lagging Indications are given at the beginning of a new candle Please watch the full tutorial video. How to use GannRS Very easy to set up... Put it on your chart Adjust inputs Inputs Show Resistance and support : [bool]  true = Shows R/S on chart false = does not show Show Levels :[bool]  true = Shows levels on the chart false = does n
Trendy Scalper
Remi Passanello
该指标是 RPTrade Pro Line 系统的一部分。 Scalper Pro Line 是使用价格行动的短期趋势指标。 它旨在供任何人使用,即使是绝对的交易初学者也可以使用它。 从不重新粉刷。 指示是从接近到接近给出的。 设计为单独使用,无需其他指标。 特定图表根据历史数据向您显示利润和最终回撤。 它是如何工作的 Scalper Pro Line 使用内部趋势指标与价格行为系统相结合。 在启动时,系统正在分析 10000 条历史记录以找到最佳设置。 然后将这些设置应用于整个历史记录并实时使用;这是获得最可靠的准确性和稳定的交易信号的保证。 由于图表上的图表,可以立即检查策略和设置的“成功”。 OnChart 图表允许立即查看策略中是否存在任何“漏洞”,并最终选择另一个更适合的时间帧或符号。 实时从蜡烛收盘到蜡烛收盘,趋势指标等待信号条件有效,然后通过箭头显示(绿色表示买入,橙色表示卖出) 然后,当价格走势告诉停止或趋势耗尽时,指标会显示一条趋势线,这意味着是时候停止交易了。 然后显示“虚拟交易”的结果并将其添加到 OnChart Graph 数组中。 有时无法立即关闭交易
TrendSwift
Remi Passanello
趋势迅捷 它旨在供任何人使用,即使是交易的绝对初学者也可以使用它。 切勿重新粉刷。 指示是从接近到接近给出的。 设计为单独使用,不需要其他指标。 它是如何工作的 TrensSwift 使用内部趋势指标结合价格行为和斐波那契系统。 该策略被严格应用,没有任何后期重新计算、平滑或插值。 通过评论部分的统计数据可以立即检查该策略的“成功” 从蜡烛收盘到蜡烛收盘,趋势指标实时等待信号条件有效,然后用箭头显示(绿色表示买入,橙色表示卖出) 该指标在交易机会开始时显示止损和止盈,并在整个交易过程中保持它们。 没有惊喜。 TrendSwift 表明 在哪里开启您的交易。 何时关闭它们。 止盈和止损 TrendSwift 有效 使用任何仪器,不受限制。 在任何时间范围内 与任何经纪人。 TrendSwift 功能 没有优化。 非常简单的输入。 非常强大和准确的策略 如何使用TrendSwift 只需将其放在您的图表上即可。 只需遵循箭头和趋势线指示即可。 输入 交易机会时播放声音:当交易机会临近时播放声音(以警告交易者)
UniversalTrader
Remi Passanello
4.64 (11)
通用交易平台(UT) 该EA是RPTrade Pro解决方案系统的一部分。 UT是使用趋势和振荡器指标的交易机器人。 它旨在供任何人使用,即使是交易的绝对初学者也可以使用它。 专为每个时间表而设计 用途止盈,止损和尾随止损。 也可以作为不带SL / TP的交换机使用 适用于任何一对 它是如何工作的 UT是趋势追随者。 它使用A内置的超级趋势指标来查找交易条目,并使用抛物线SAR来止损/追踪/折损甚至头寸 TP / SL / TS或下一个相反的交易将停止交易。 不套期保值,不求平均。 在下一个交易开始之前,交易必须结束。 UT控制每个刻度线或每个柱线,可以以实际刻度线或开盘价进行优化。 测试中 在测试之前必须进行优化。专门的支持站点将很快提供完整的描述和指导。 输入项 IsMicroAccount:[布尔] True将最小手数设置为0.01 False将最小手数设置为0.1 CompletedBars:[布尔] True将仅在新的柱线开盘时交易(开盘价模式) 虚假将交易每一刻 GlobalTimeFrame:[ENUM TIMEFRAME]选择整个EA的时间范围 FiveDig
Netting Scalper
Remi Passanello
5 (2)
该机器人是 RPTrade Pro Solutions 系统的一部分。 Netting Scalper 是一个使用动态动态和净额结算系统的快速交易机器人。 它旨在供任何人使用,即使是绝对的交易初学者也可以使用它。 专为 M1 设计 使用获利、止损和追踪止损。 也可作为无止损/止盈的开关 适用于任何对 它是如何工作的 Netting Scalper 是一款快速的 M1 黄牛。 它没有使用任何指标。 它遵循经纪人的分时分布。 交易被 TP/SL/TS 或下一个相反的交易停止。 没有对冲,没有平均。 一笔交易必须在下一笔交易开始之前结束,但它可以进行多笔交易。 Netting Scalper 控制每个分时,有必要仅在实际分时对其进行优化。 净剥头皮工作 使用任何工具,如外汇对、指数、金属、期货或任何其他工具。 每种不同的工具都需要优化和回测 与任何经纪人。 在 NETTING 帐户上。 测试 在测试之前观看教程视频 检查“最大手数”和“每笔交易输入手数”,最好都输入 100。手数将由资金管理系统自动调整,以适应下面所示的百分比风险。 另请查看“在 x% 处停止交易”,默认值为 1
GannRS Trend Scalper   GannRS is an advanced trading tool based on Gann Law and Supports and Resistances. designed to have an   active trading at any time not lagging Indications are given at the beginning of a new candle Please watch the full tutorial video. How to use GannRS Very easy to set up... Put it on your chart Adjust inputs Inputs Show Resistance and support : [bool]  true = Shows R/S on chart false = does not show Show Levels :[bool]  true = Shows levels on the chart false = does n
Straddle Scalper
Remi Passanello
概述: 跨式剥头皮交易是一种 EA 在特定时间和/或日期开盘跨式交易。 止盈是使用 ATR 比率动态生成的。 要求: 开立跨式交易需要一个对冲账户。 严格的优化(在公开价格中)是强制性的。 什么是跨骑? 跨式交易是同时打开买入和卖出的操作。 这个 EA 是如何工作的? 成功优化后,EA 将在优化指定的每个新柱(H1 时间框架)处打开一个跨式。 开立新交易的决定是根据所需的最小波动率做出的(由 ATR 衡量并在交易历史上进行统计) 止盈将根据优化计算的 ATR 比率动态放置。 同时只能有 1 或 2 笔交易,以获利或新柱关闭。 此 EA 不使用以下系统:对冲、网格、鞅。 如何优化? 看一下图片,有一张显示优化集文件的基本设置。 始终在 H1 中优化和使用,它不适用于任何其他时间范围。 首先,优化开盘价,因为 EA 只在新柱上设置交易。 (明确适用于开盘价) 安全的长期交易: 如果你想真正安全,最好是长期优化,比如几年。 尝试找到具有许多交易和最低回撤的结果。 观察利润曲线,它必须尽可能稳定地呈现上升趋势,尤其是在最后。 潜在快速大回报的风险交易: 使用像 100
筛选:
无评论
回复评论