The Daily Trader
- 指标
-
Remi Passanello
 你好,
你好,
在过去的15年里,我是机器人行业的建设者和代码开发。
作为业界和这么多其他的事情都转向噩梦,因为法国落入极权共产主义共和国,我决定停止这项工作,并启动其他东西。
我从去年年底(2012年),并开始人工交易,那么我现在用我的知识来开发EA MT5.. - 版本: 1.0
- 激活: 20
每日交易者
该指标是 RPTrade Pro Solutions 系统的一部分。
每日交易者是仅使用统计数据的每日指标。
它旨在供任何人使用,即使是绝对的交易初学者也可以使用它。
从不重新粉刷。
指示是从接近到接近给出的。
设计为单独使用,无需其他指标。
为您提供清晰简单的指示
它是如何工作的
统计系统分析历史以发现符号行为中的冗余。
交易是一一指示的,永远不会同时进行两笔交易。
它表示:
何时进行交易
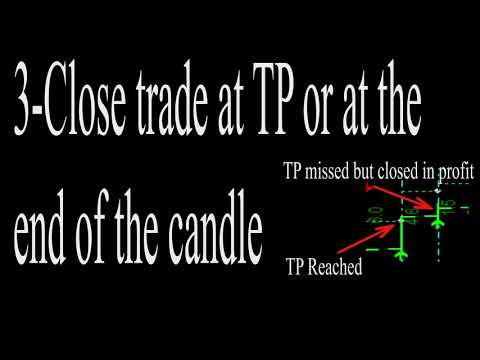
在哪里放置止盈
未来 24 小时内要进行的交易
作品
使用任何工具,如外汇对、指数、金属、期货或任何其他工具。
仅在 H1
与任何经纪人。 (较低的点差会给您带来更多的点数)
特征
可靠的买入/卖出信号。
非常简单的输入。
屏幕提醒 + 推送通知 + 电子邮件通知
所有通知都非常详细,并且还提供获利,它允许从移动设备进行交易。
帮助您找到正确设置的利润图表
只需启用/禁用每日交易,即可直接在图表上调整设置
如何使用它 ?
只需将其放在您的图表上即可。
只需遵循指示即可。
输入
UsePush: [Bool] true 将发送推送通知。
UseMail: [Bool] true 将发送邮件。
Period 2: [Integer] 指标周期;从 1 到 ..... 较低的值 = 更多的多笔交易
计算周期:【多选】确定指标计算的持续时间
历史开始日期:[DateTime]设置开始计算指标的日期。
分割原始 TP:[双倍] 设置获利分割线。 1 不除,2 将 TP 除以 2。