Signals By Levels

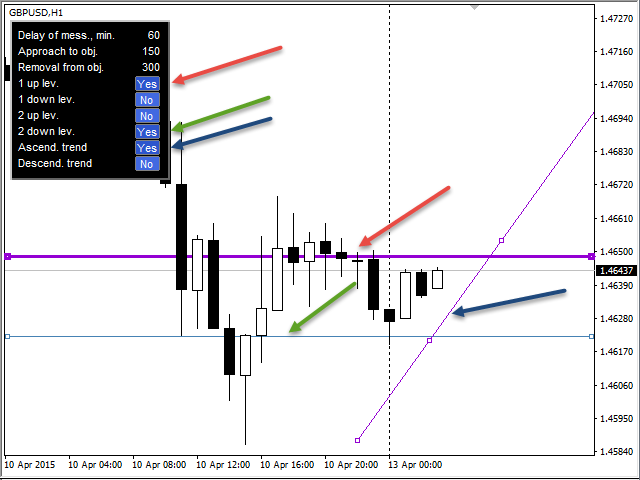
The indicator sends messages to e-mail and mobile terminal when the price approaches the horizontal levels and trend lines that are drawn using the handy panel! The levels and trend lines are deleted and placed to the chart using one click on the panel, and they can be dragged on the chart by mouse! It is possible to set the interval between messages in the settings, the interval is applied to each object separately!


Indicator Settings

===*** Main settings ***=== - below is the list of the main settings

  • Delay of messages, min. - the interval between messages sent from one object in minutes
  • Sending the message before closing candle, min. - the number of minutes until the candle closes, when sending messages is allowed. Used if signal are generated at candle closure
  • Sending Push messages - send messages to the mobile terminal (Android and iOS)
  • Sending EMail - send messages to EMail

===*** Levels settings ***=== - below is the list of settings for levels

  • First up level - first upper level
  • First down level - first lower level
  • Second up level - second upper level
  • Second down level - second lower level
  • Ascending trend line - upward trend line
  • Descending trend line - downward trend line
  • Space from the price to levels, pips - the distance in pips from the price to draw the objects by default
  • Approach to levels, pips - the distance from the object to start sending messages, when the price approaches
  • Move away from levels, pips - the distance from the object to stop sending messages, when the price moves away (together, the previous two parameters set the range above and below the object to send messages)
  • Signal type - signal type (two options: send messages when candle closes or immediately)

"===*** Trend lines settings ***===" - below is the list of settings for trend lines

  • Ascending trend line - upward trend line
  • Descending trend line - downward trend line
  • Space from the price to trend lines, pips - the distance in pips from the price to draw the lines by default
  • Approach to trend lines, pips - the distance from the line to start sending messages, when the price approaches
  • Move away from trend lines, pips - the distance from the line to stop sending messages, when the price moves away (together, the previous two parameters set the range above and below the object to send messages)
  • Signal type - signal type (two options: send messages when candle closes or immediately)

"===*** Drawing settings ***=== - below is the list of settings for drawing

  • Drawing on a background - draw objects in the background
  • First up level - color of first upper level
  • First down level - color of first lower level
  • Style of first levels - style of first levels
  • Width of first levels - width of first levels
  • Second up level - color of second upper level
  • Second down level - color of second lower level
  • Style of second levels - style of second levels
  • Width of second levels - width of second levels
  • Ascending trend line - color of upward trend line
  • Descending trend line - color of downward trend line
  • Style of trend lines - style of trend lines
  • Width of trend lines - width of trend lines
  • Create objects selected - draw objects as selected
  • X panel coordinate - the X coordinate of the panel
  • Y panel coordinate - the Y coordinate of the panel
  • Panel color - color of the panel
  • Frame color - color of the panel frame
  • Font color - text color
  • Buttons color - button color
推荐产品
PTW NON REPAINT TRADING SYSTEM + HISTOGRAM Non-Repainting ,   Non-Redrawing   and   Non-Lagging  Trading System. Does the following: - Gives Accurate Entry and Exit Points - Scalping, Day and Swing Trading  - 95% Accuracy  - Targets, where to take profits. - Shows Trends, Support and resistance levels - Works on All Brokers - Works on All Currencies, CFDs and Stocks - It does not place trades for you, it only shows you what trades to place. - It works on All Timeframes - It is for Trend or ran
Global Trend
Vitalii Zakharuk
Global Trend Indicator, shows the signals for entry. Displays both entry points and the trend itself. Shows statistically calculated moments for entering the market with arrows. When using the indicator, the risk factor can be optimally distributed. Settings: Uses all one parameter for settings. Choosing a parameter, it is necessary to visually resemble it so that the appropriate graph has a projection of extremes. Parameters: Length - the number of bars for calculating the indicator. Use
Happy Kangaroo
Pui Yan Leung
Overview Happy Kangaroo is a trend-following tool designed to identify market direction and provide high-probability entry signals based on volatility. By combining price action with the Average True Range (ATR), it visualize a dynamic support and resistance level of the price.     Key Features   The indicator's power lies in its customizable parameters and mathematical precision:  Dynamic Trend Detection: Uses the ATR period and factor to calculate the volatility bands. It identifies an Uptrend
Anemone
Sean Christian Hammond
使用人工智能 AI 创建,用于将生物体可见的行为模式纳入趋势分析。 混沌理论与移动平均线相遇。 滤食性海葵将其卷须伸入营养物质的海洋以丰富自身。 我不会用太长的描述浪费你的时间,这个概念在这些术语上是可以理解的。 它是一个可自定义的周期旋转移动平均线,可在简单、指数、加权和平滑之间切换,在您指定的时间输入上。 轮换是半混沌的,由市场本身注入的随机性。 当这些 MA 一个叠加在一起时,其效果就像海葵滤食一样,其卷须伸入环境........................................................................................................................................................................................................
這個獨特的自動趨勢線繪製指示器可在所有時間範圍內運行,可幫助您輕鬆交易短期趨勢反轉以及短期趨勢突破,表明市場上的資產更雄厚。 它獨特地使您可以儘早進入沉重的揮桿動作。 輸入包括: -Max Candles回顧趨勢線 -線型和顏色 -到外帶和帶週期的最大距離 -當確認蠟燭或價格收盤時,自動重新繪製趨勢線偏離樞軸的選項較低,較低或較高的高位(雙底低位和高支撐位)和最大蠟燭數以進行重新繪製。 -4個換行選項: 1)價格跌破線時刪除 2)不要刪除 3)燭線超出界限時刪除 4)在趨勢關閉時刪除 This unique auto trend line drawing indicator works on all time frames which can help you to easily trade short term trend reversals as well as  as well as short term trend breakouts indicating the stronger asset in the market. It uniquely allows you to
Vanguard Gold Sentinel: Robust H1 Trend-Following Engine Product Description: Vanguard Gold Sentinel is a high-precision algorithmic trading system designed exclusively for XAUUSD (Gold) on the 1-hour (H1) timeframe . Unlike generic EAs, this system has been subjected to rigorous robustness testing—including exhaustive Walk Forward analysis—to ensure its adaptability across shifting market cycles from 2015 to 2026. At its core, Sentinel is engineered to capture institutional trends by combining
Transition Trend
Tatiana Savkevych
The Transition Trend indicator shows the points of potential market reversal. The indicator's smart algorithm detects the trend, filters out market noise and generates entry signals and exit levels. Simple, visual and efficient trend detection. Uses just one parameter for settings. The indicator does not redraw and does not lag. You can set up message alerts as sound or email. Works on all currency pairs and all timeframes. Ready-made trading system.
Linear Trend Predictor — 结合切入点和方向支撑线的趋势指标。按照突破高/低价通道的原理运作。该指标算法过滤市场噪音,考虑波动性和市场动态。 指示器功能  使用平滑方法,显示市场趋势和开立买入或卖出订单的切入点。  适合通过分析任何时间范围内的图表来确定短期和长期的市场走势。  输入参数可适应任何市场和时间范围,允许交易者独立定制指标。  设定的指示信号不会消失,也不会重新绘制——它是在蜡烛收盘时确定的。  几种类型的通知以箭头组合。  该指标既可以作为独立的交易系统使用,也可以作为其他交易系统的补充。  可供任何经验水平的交易者使用。 主要参数 Volatility Smoothing Level - 指标的主要参数,允许您配置指标以实现舒适的操作。 它的数字范围是 1 到 100,从而增加了您可以获得更长趋势运动的平滑度。 通过少量的数字,您可以获得短期走势并快速退出交易。 使用指标进行交易的时刻:  红线和箭头表示下降趋势和卖出开盘信号。止损应根据前一个上分形来设置。  黄线和箭头表示上升趋势和买入开盘信号。止损应根据前一个下分形来设置。
GreenBox
Taro Mitsuyasu
It is an indicator that analyzes the high and low prices in real time by Dow theory, draws a trend line, and draws the predicted arrival point in the Box format after breaking the low price and the high return price. The high and low prices are determined by the nBars parameter (initial value = 5), but displaying the corresponding moving averages (SMA and EMA 4 to 5 times nBars) at the same time makes it easier to understand the trend change. (D ownload the demo version of the free GreenBox and
EMA Dashboard
Chantal Sala
1 (1)
Ema Dashboard is an innovative dashboard that allows you to monitor Moving Average on multiples symbols and different timeframes. This dashboard allows you to analyze information on 28 pairs on an unique chart. Its functionality includes analysis of All Time Frames. This configuration allows you to identify the Long Term Trend with extreme ease. This panel allows you to take very important directional movements. A click on button opens a new chart (symbol and timeframe). Graphic Object Symbol l
Strong Pairs
Angelico Jurado
5 (1)
This indicator calculates the strength of the major currencies (EUR, USD, CAD, GBP, CHF, NZD, USD, JPY) and shows the top 4 strongest currency pairs that are currently in a high probability trend for the day or for the week. Usage The indicator displays 8 currency pairs with a trend direction (e.g. "EURUSD-DOWN") and ranked according to strength, with 1 being ths strongest. There will be 4 pairs for intraday and 4 pairs for intraweek If a currency pair is present in the top 4 intraday, it is in
Note : The slow loading of the indicator issue has been addressed . This new version loads fast and does not slow the platform. Version 1.3 : We have updated the indicator to include an historical bar scanning option . So instead of scanning all bars in the history (which can make the indicator slow sometimes ) , you can select the maximum number of bars it can scan which can increase the performance and make the indicator faster. This indicator scans the 1-3 Trendline pattern . The indicato
Implement
Vitalii Zakharuk
5 (1)
Implement analyzes market dynamics for pivot points. If you want to learn how to spot the correct reversals for consistently likely profitable trading, buy this indicator. Shows favorable moments of entering the market in stripes. Ready-made trading system. The principle of operation of the indicator is to automatically determine the current state of the market when placed on a chart, analyze historical data based on historical data and display instructions for further actions on the trader's
Oscillator helps determine the direction of the market Shows the direction of the price movement and is painted in the appropriate color. Allows you to conduct trend and counter trend trading It works on all timeframes, on any currency pairs, metals and cryptocurrency Can be used when working with binary options Distinctive features Does not redraw; Simple and clear settings; It works on all timeframes and on all symbols; Suitable for trading currencies, metals, options and cryptocurrency (Bitco
Parabolic SAR Auto Trader EA
Mohammad Khairy Abdul Ghany
Parabolic SAR Auto Trader EA v1.0 is a fully automated trading system for MetaTrader 4 based on the popular Parabolic SAR indicator, designed to follow market trends and capture momentum movements efficiently. This Expert Advisor automatically detects trend reversals using Parabolic SAR signals and executes trades with built-in risk management and trailing stop functionality. Key Features: Fully automated Parabolic SAR trading system Trend-following strategy using SAR reversal signals Fixe
Apex Trend Sniper
Steffen Reinhold Noll
Apex Trend Sniper Apex Trend Sniper 是一款用于 MetaTrader 4 的趋势跟踪指标。它通过将 Williams Percent Range 振荡器与多层过滤系统相结合来识别价格方向变化。信号以箭头的形式直接显示在图表上。该指标适用于比特币(BTCUSD)、主要指数(US30、GER40、NAS100、SPX500)以及黄金(XAUUSD)。 工作原理 核心信号来源于 Williams Percent Range 振荡器。当振荡器穿越设定的阈值水平时,将生成方向性信号。计算周期会自动调整:如果在最近几根K线上检测到显著的价格波动,则采用较短的周期。 每个原始信号在图表上绘制箭头之前,须通过三个独立的过滤器。 趋势过滤器使用当前时间框架上的两条移动平均线来确定趋势方向。与趋势方向相悖的信号将被抑制。 横盘市场过滤器使用平均趋向指数来衡量趋势强度。若指数值低于可配置的阈值,则市场被视为横盘整理状态,不生成任何信号。 高级时间框架确认在更高的时间框架上计算第二组移动平均线。与高级时间框架方向相悖的信号将被屏蔽。为防止重绘,仅使用高级时间框架上已收盘的K
FREE
MoveWave
Andriy Sydoruk
MoveWave - Moving waves are very handy indicators for determining pivot levels. Most Forex traders make decisions based on technical analysis. This type of analysis determines patterns and trends in the market. With the help of complex mathematical equations that are combined and made out in the form of this indicator, the trader will be able to more accurately determine the price reversal levels. Wave theory mathematically represents various behavioral models of the market. It is used as the ba
Arrow up down
Levi Kevin Midiwo
Arrow up down is a mt4 indicator that shows various levels to enter the market. It consists of two signals; Buy signal Sell signal Buy signals are shown as blue arrows on the chart once you install the indicator. Sell signals are shown as red signals on the chart. The indicator uses other underlying indicators like moving average together with statistical calculations to generate signals.
KFX Trade Manager
Joe Christopher Ramirez
Introducing the "KFX Trade Manager" expert advisor for MetaTrader 4 (MT4), a comprehensive solution for advanced trade management and risk control. This powerful tool is designed to enhance your trading experience by automating various aspects of order handling, profit optimization, and alert notifications. With the "KFX Trade Manager," you can take your trading to the next level and streamline your operations for improved efficiency and better risk management. Key Features: Trade Management Set
R Var 移动平均线指标是为顽固的趋势追随者设计的趋势跟踪指标。 它是股票交易者和商品交易者中非常流行的外汇交易指标,它的流行源于它能够向用户提供真正的赚钱信号。 该指标由放置在黄褐色线上的绿色和红色点组成。 绿点指向看涨信号,而红点表示看跌信号。 基本交易信号 买入信号:当指标的黄褐色线上的点变为绿色时,做多。 卖出信号:当指标的黄褐色线上的点变为红色时做空。 退出买入交易:如果在看涨趋势持续期间,指标的西耶娜线上出现红点,则关闭所有买入订单。 退出卖出交易:如果在看跌趋势持续期间,R Var 移动平均线指标的西耶纳线上显示绿点,则关闭所有卖出订单。 尖端 在使用 R Var 移动平均线指标时,利用适度的止损来防止错误信号。 将其用于各种交易方式,包括剥头皮交易和日间交易。 特征 平台:MetaTrader 4 货币对:任何 自定义选项:变量(periodAMA、nfast、nslow、G、dK、UseSound、SoundFile)、宽度和样式。 时间范围:1 分钟、5 分钟、15 分钟、30 分钟、1 小时、4 小时、1 天、1 周、1 个月 类型:趋势
FREE
停止猜测,开始用统计优势交易 股票指数的交易方式与外汇不同。它们有固定的交易时段,隔夜会出现跳空,并遵循可预测的统计模式。这个指标为您提供所需的概率数据,让您能够自信地交易DAX、标普500和道琼斯等指数。 与众不同之处 大多数指标向您展示已经发生的事情。而这个指标向您展示接下来可能发生什么。每个交易日,指标都会根据100天的历史数据分析您当前的设置。它会找到具有相似跳空、相似开盘位置的日子,并准确计算价格到达关键水平的频率。不再猜测跳空是否会回补,或者昨天的高点是否会被测试。您将获得基于真实数据的精确百分比。 完整手册及所有参数说明请访问: https://www.mql5.com/en/blogs/post/766370 帮助您找到优质设置的策略指南: https://www.mql5.com/en/blogs/post/766371 搭配风险回报计算 + 快速交易管理按钮EA,轻松进行股指日内交易 - https://www.mql5.com/en/market/product/78020 MT5 Version:  https://www.mql5.com/en/market/
This is a simple PriceTMA bands, non repaint! it can be used for a trend following system or sometimes reversals. as a main signal or a filter for others strategies, it depends on the trader main strategy. calculations for this indicator are a combined Algorithm between moving averages "MA" and average true range"ATR". good luck with your trading! i hope it is helpful Cheers
Trend MagicX
Hafis Mohamed Yacine
A trending market is one in which price is generally moving in one direction. ... When trading a trend-based strategy, traders usually pick the major currencies as well as any other currency utilizing the dollar because these pairs tend to trend and be more liquid than other pairs.  Best Trend Indicator That Tells You the Direction of the Trend   Trend MagicX_v1.1 displays the trend direction, duration, intensity and the resulting trend rating for all time frames in real time. You'll see at a
Calculated
Vitalii Zakharuk
Calculated trend indicator, can be used with an optimal risk to profit ratio, shows successful signals. Uses two options for settings. Shows favorable moments for entering the market with arrows. The probability of a successful trend is not very bad! The indicator can be used both for pipsing on small periods, and for long-term trading. The indicator does not redraw and does not lag. It works on all currency pairs and on all timeframes.
本指标是实践实战交易完善的波浪自动分析的指标 !  案例... 注: 波浪分级用西方叫法不习惯,因受到缠论(缠中说禅)命名方式习惯的影响,我是将基础波浪命名为 笔 ,将二级波段命名为 段 ,同时具有趋势方向的段命名为 主趋段 (以后笔记中都是这种命名方式,先告知大家),但是算法上和缠论关系不大切勿混淆.反映的是本人分析盘面总结的 千变万化纷繁复杂的运行规律 . 对波段进行了标准化定义,不再是不同人不同的浪  ,   对人为干扰的画法进行了排除,在严格分析进场起到了关键的作用 . 使用这个指标,等于将交易界面提升美感,抛弃最原始的K线交易带你进入新的交易层次.如果不是为了交易,在宣传上也将使客户观感提升层次. 指标内容: 1. 基础波浪 (笔) : 首先我们找出了价格波动过程中的基础波动拐点,当然他的有序性低,为下一步的计算提供基础. 2. 二级波段( 段 ) :在基础波浪的基础上,通过算法分析得到层级更明显的二级波段,二级波段为波浪提供了分析基础 3. 波浪( 浪 ): 有着更清晰的趋势,更清晰直观的方向.分析一个波浪是否延续,需要看二级波段的形态,分析二级的构成,可以得出波浪后
指标就像婆婆,话多,话多,而且经常说得不恰当。 该指标除了为我们提供有关我随后列出的参数的进入信号外,还监控小时时间框架的趋势,OSMA 了解进入方向,RSI 感知任何超买或超卖情况,ATR 用于趋势的波动率和 ADX。 不建议新手使用该指标。 只有这些参数的人为判断,结合进场信号,才能使指标真正有效。 建议在合适的时间 (9.30-11 15.30-17 20-22 GMT+2) 在指数和主要外汇交易所使用它,时间范围为 5 分钟。 对于对所产生的信号缺乏成熟和严格判断的新手,不建议使用它。 该指标依赖于简单移动平均线的标准差,这些标准差在历史上构成了可能的关键水平,以在 SL 或 TP 中关闭订单。 开幕式完全基于:      (仅适用于外汇)检查基础货币对其他汇率的强度      相对于前一根蜡烛的收盘价,价格对我们有利      OSMA 参数是:      Max Risk in cash : 每笔交易的基础货币的最大风险      与...比较:仅适用于外汇。 比较WhatchList或整个平台的变化      等待关闭蜡烛:仅在前一根蜡烛收盘时生成信号 对于其余部
This indicator is designed to detect the best of all candlestick reversal patterns: Three Line Strike . According to the bestselling author and candlestick guru Thomas Bullkowski, this pattern has a winning percentage between 65% and 84% . This indicator scans for you up to 30 instruments (forex, indices or commodities) on up to 8 timeframes. You can get alerts via MetaTrader 4 and email if a Three Line Strike pattern occurs. Please note: Higher timeframes bring the most reliable signals. This i
Trend and Lines
Oliver Hinrichs
This indicator draws lines at the open, close, high and low price of the last chart candle from the set timeframe. In addition, a label shows whether it was an up or down candle. The standard settings follow the original idea of ​​getting the price data from the daily timeframe for day trading/scalping, but since this indicator is fully customizable, you can also set a different timeframe. Based on the drawn price lines, you can then also display Fibonacci levels. This function can also be
SpeedMomentum
Michael Oko Oboh
Adaptive Tick Impulse Momentum Meter PRO Institutional Non-Repainting Momentum Engine for MT4 The Adaptive Tick Impulse Momentum Meter PRO is an advanced institutional-style momentum and speed detection indicator designed for traders who want to identify explosive market moves before they fully develop. Unlike traditional indicators that rely on lagging averages or simple candle analysis, this engine combines: Tick imbalance analysis Adaptive volatility intelligence Momentum acceleration Kalman
Fibonacci Trend Marker
Grigoriy Malychenko
斐波那契趋势标记 ( Fibonacci Trend Marker ) 是一种趋势指标,通过使用斐波那契回撤水平分析当前K线相对于前几根K线的最高-最低 (HL) 范围的行为。它通过K线颜色的变化,直观地跟踪趋势强度,提示可能的趋势减弱或反转。 特点: 专为趋势交易者设计,帮助基于斐波那契水平快速识别趋势变化。 在市场波动性充足且有3-5根K线形成明显趋势时,适用于任何时间框架。 K线大小自动适应图表比例,确保缩放时显示正确。 对趋势变化的高度敏感性源于对当前K线的实时分析,使其非常适合在M1和M5时间框架上进行剥头皮交易。 如何交易? 入场: 在前一根已关闭的K线颜色变化后开仓。例如,如果一根K线在红色后关闭为蓝色,表明上升趋势—开启买入 (Buy) 交易。 离场: 当前一根K线的颜色反转时平仓,或在达到目标时平仓,例如趋势方向上的1-2根K线,具体取决于市场波动性。 当前(未关闭)K线的颜色会随报价变化而改变,这对剥头皮交易者尤其有用,可在K线完成前提前平仓。 设置: 周期 (Period) — 设置用于计算的前几根K线的数量(例如3、5、10)。 斐波水平 (Fibo
该产品的买家也购买
Neuro Poseidon MT4
Daria Rezueva
4.96 (25)
Neuro Poseidon is a new indicator by Daria Rezueva. It combines precise trading signals with adaptive TP/SL levels - creating best possible trades as a result! Message me and get  Neuro Poseidon Assistant  as a gift to automize your trading process! What makes it stand out? 1. Proven profitability on all assets and timeframes 2. Only confirmed BUY and SELL signals present on the chart 3. Adaptive TP & SL levels generated by the software for each trade 4. Easy to understand - suitable for all
M1 Sniper
Oleg Rodin
5 (23)
M1 SNIPER 是一款易于使用的交易指标系统。它是一个专为 M1 时间框架设计的箭头指标。该指标可以作为独立的系统在 M1 时间框架下进行剥头皮交易,也可以作为您现有交易系统的一部分使用。虽然该交易系统专为 M1 时间框架交易而设计,但它也可以用于其他时间框架。我最初设计此方法是为了交易 XAUUSD 和 BTCUSD。但我发现这种方法在其他市场交易中也同样有用。 指标信号既可以顺势交易,也可以逆势交易。我教授一种特殊的交易技巧,帮助您利用指标信号进行双向交易。该方法基于使用特殊的动态支撑位和阻力位区域。 购买后,您可以立即下载 M1 SNIPER 箭头指标。此外,我还为所有 M1 SNIPER 工具用户免费提供下方屏幕截图所示的 Apollo Dynamic SR 指标!这两个指标的组合可以帮助您更轻松、更准确地利用 M1 时间框架进行交易。 购买后请联系我,免费获取交易提示和奖励指标! 祝您交易成功!
Gann Made Easy
Oleg Rodin
4.84 (164)
Gann Made Easy 是一个专业且易于使用的外汇交易系统,它基于使用先生理论的最佳交易原则。 W.D.江恩。该指标提供准确的买入和卖出信号,包括止损和获利水平。您甚至可以使用推送通知在旅途中进行交易。 购买后请联系我,即可免费获得交易指导和超棒的额外指标! 您可能已经多次听说过江恩交易方法。通常 Gann 的理论不仅对于新手交易者而且对于那些已经有一定交易经验的人来说都是非常复杂的东西。这是因为江恩的交易方法在理论上并不那么容易应用。我花了几年时间来完善这些知识,并将最好的原则应用到我的外汇指标中。 该指标非常易于应用。您所需要的只是将其附加到您的图表并遵循简单的交易建议。该指标不断进行市场分析工作并寻找交易机会。当它检测到一个好的入口点时,它会为您提供一个箭头信号。该指标还显示止损和获利水平。 换句话说,当您像先生一样进行交易时,该指标会为您提供最佳江恩建议。江恩亲自告诉你此时此刻该做什么。但最好的部分是您不需要了解任何有关江恩交易原则的知识,因为该指标会为您完成整个市场分析工作。
Scalper Inside PRO
Alexey Minkov
4.74 (68)
Scalper Inside PRO Scalper Inside PRO 是一款适用于 MetaTrader 4 的日内趋势与剥头皮指标,使用专有算法快速识别市场方向和关键目标价位。它能够自动计算进场价、出场价以及多级止盈目标,并显示详细的绩效统计,让您了解不同交易品种和策略以往的表现情况,从而帮助您为当前的市场环境选择最合适的交易工具。此外,您还可以将自己的箭头指标轻松接入 Scalper Inside PRO,快速评估其统计数据和历史表现。 该指标可用于任何交易品种和任何周期(建议在 M5 上进行日内交易),并内置多种交易策略,因此既可以作为独立的剥头皮工具使用,也可以作为您交易系统中功能强大的分析组件。 主要功能 通过专有算法(Next‑Generation Trend Detection Algorithm,NG TDA)快速识别当前市场趋势。 自动计算日内交易的进场价、出场价和多级止盈目标。 内置策略与统计模块,用于评估不同市场环境下各品种的表现。 支持接入自定义箭头指标(PRO 模式),并计算其详细信号统计数据。 适用于外汇、金属、指数、股票、商品、期货和加密货币等各类市
PRO Renko System
Oleg Rodin
5 (30)
PRO Renko Arrow Based System for trading renko charts.  准确的信号交易任何外汇工具. 另外,我将免费提供系统的附加模块! PRO Renko系统是RENKO图表上高度准确的交易系统。该系统是通用的。 该交易系统可应用于各种交易工具。 该系统有效地中和了所谓的市场噪音,打开了获得准确反转信号的通道。 该指标易于使用,只有一个参数负责产生信号。 您可以很容易地使算法适应您感兴趣的交易工具和renko酒吧的大小。 我很乐意通过提供任何咨询支持来帮助所有客户有效地使用该指标。 祝您交易成功!购买后,立即写信给我! 我将与您分享我的建议和我的renko发电机。 另外,我将免费提供系统的附加模块!
Dynamic Forex28 Navigator
Bernhard Schweigert
4.43 (7)
Dynamic Forex28 Navigator - 下一代外汇交易工具。 当前 49% 折扣。 Dynamic Forex28 Navigator 是我们长期流行的指标的演变,将三种功能合二为一: 高级货币强度 28 指标 (695 条评论)+ 高级货币 IMPULSE 带警报 (520 条评论)+ CS28 组合信号(奖励)。 有关指标的详细信息 https://www.mql5.com/en/blogs/post/758844 下一代强度指标提供什么? 您喜欢的原始指标的一切,现在通过新功能和更高的精度进行了增强。 主要特点: 专有货币强度公式。  所有时间范围内的平滑和准确的强度线。 非常适合识别趋势和精确进入。 动态市场斐波那契水平(市场斐波那契)。  此指标独有的独特功能。 斐波那契应用于货币强度,而不是价格图表。 适应实时市场活动以获得准确的反转区域。 实时市场动量。  第 9 行显示市场是活跃还是被动。 对于定时交易至关重要。 全面的警报和显示。  每种货币最强的买入和卖出动量。 ​​28 对的双重动量买入和卖出。 超买/超卖警告外部范围和止损。 反转
Trend Catcher ind
Ramil Minniakhmetov
趨勢捕捉指標 趨勢捕捉指標結合了作者獨有的客製化自適應趨勢分析指標,用於分析市場價格趨勢。它透過過濾掉短期噪音,並專注於潛在的動能強度、波動性擴張和價格結構行為,來識別真實的市場方向。此外,它還結合了平滑和趨勢過濾等客製化指標,例如移動平均線、相對強弱指標 (RSI) 和波動率過濾器。 您可以在這裡查看實際運行情況以及我的其他產品: https://www.mql5.com/en/users/mechanic/seller 請注意,我不會在 Telegram 上出售 EA 或任何設置,那是騙局。所有設定都可以在我的部落格上免費取得。 重要提示!購買後請立即聯繫我,以獲取使用說明和額外獎勵! 請注意,我不會在 Telegram 上出售 EA 或任何設置,那是騙局。所有設定都可以在我的部落格上免費取得。
Trend Lines PRO
Roman Podpora
5 (1)
TREND LINES PRO 帮助您了解市场真正的方向转变点。该指标显示真实的趋势反转点以及主要参与者重新入场的时机。 您可以看到 BOS线、 趋势变化和更高时间框架的关键水平——无需复杂的设置或不必要的干扰。信号不会重绘,并在K线收盘后仍然保留在图表上。 VERSION MT 5    -   与……搭配使用时,可发挥其最大潜力   RFI LEVELS PRO 指示器 该指标显示的内容: 实际变化 趋势(BOS 线) 一旦信号出现,它就始终有效!这与会重绘的指标有着重要的区别,后者可能会发出信号后又改变信号,从而导致资金损失。现在,您可以更精准、更准确地进入市场。此外,还有一个功能,会在箭头出现后为K线着色,直到达到目标价位(止盈)或出现反转信号为止。 重复条目   以及主要玩家的充值 为了提高寻找入场点时的视觉清晰度,我们创建了一个模块,该模块首先显示买入/卖出区域,并在该区域内寻找最佳入场点。此外,我们还加入了智能逻辑来管理止损位,该逻辑会随着时间的推移逐步降低止损位的大小,从而降低入场交易时的初始风险(移动止损位)。 信号强度水平(BOS) 该指标采用三个显著性等级来衡量
Enigmera
Ivan Stefanov
5 (8)
ENIGMERA: 市场的核心 重要提示:MQL5.com 演示版本在策略测试器中运行,可能无法完全反映 Enigmera 的功能。请查看描述、截图和视频了解详细信息。如有任何问题,请随时联系我! 该指标的代码已完全重写。版本 3.0 增加了新功能并修复了自指标发布以来积累的错误。 简介 这个指标和交易系统是金融市场的一种独特方法。ENIGMERA 使用分形周期来精确计算支撑和阻力水平。它展示了真实的积累阶段,并提供了方向和目标。无论是在趋势中还是在修正中,这个系统都能工作。 它是如何工作的 指标的大部分功能通过图表左侧的按钮控制,使得能够快速响应不同的市场情况。 按钮 ON/OFF – 显示或隐藏整个指标。 Channel – 激活支撑通道,显示可接受的偏差范围。 Dev1 (第一偏差) – 指示价格在支撑偏差内的波动,信号表示市场正在整合或积累力量。 Dev2 (第二偏差) – 显示价格在偏差之间的波动,表示趋势形成和方向。 Dev3 (第三偏差) – 表示趋势的显著加速和高波动性。 45deg (45度) – 显示市场的节奏和相对于 45 度线的运动稳定性。 Tgt1/2
KT Alpha Hunter Arrows MT4
KEENBASE SOFTWARE SOLUTIONS
大多数箭头指标只给你一个信号,然后把剩下的判断全部留给你自己。KT Alpha Hunter Arrows 给你的,是一套完整的交易计划。 每一个信号箭头出现时,图表上都会同时绘制完整计划:入场线、止损位、四个止盈目标,以及实时 Edge 结论,告诉你当前品种和时间周期是否值得交易。套装中还包含 Trade Manager EA,在你手动入场后负责后续执行,让你在市场波动和情绪干扰下依然保持纪律。非重绘。只在K线收盘后给出信号。适用于 Forex、黄金、指数,以及你交易的其他任何品种。 核心功能 非重绘买入和卖出箭头,只在K线收盘后出现。 每个信号都带有入场线、结构性止损和四个止盈目标。 Edge Dashboard 会分别评估当前图表上的买入和卖出机会。 结论系统:No Edge、Marginal、Tradeable、Good 或 Strong。 一键 Auto Optimize 按钮,可根据当前品种和时间周期自动调整设置。 完整套装包含 Trade Manager EA,并内置五种专为本指标设计的交易管理方案。 Prop Firm Risk Panel 可在图表上实时追踪日内回撤
Genesis Matrix Pro is a professional multi-timeframe trend detection indicator designed to help traders identify high-quality market alignment with clarity and structure. It combines 12 different technical indicators into one visual alignment matrix, allowing traders to quickly see when market conditions are bullish, bearish, or neutral. A signal is generated only when the selected strategies are aligned, helping reduce noise and improve decision-making. PLEASE CONTACT ME AFTER PURCHASE TO GET
本产品已针对 2026 年市场进行更新,并针对最新 MT5 版本进行了优化。 价格更新通知: Smart Trend Trading System 目前价格为 $99 。 接下来的 30 次购买 后,价格将上涨至 $199 。 特别优惠: 购买 Smart Trend Trading System 后,请发送私信给我,即可免费领取 Smart Universal EA ,并将您的 Smart Trend 信号转换为自动交易。 Smart Trend Trading System 是一套完整的交易系统,具备不重绘、不回绘、不延迟的特点,专为希望获得更清晰信号、更准确趋势方向以及更有组织交易方式的交易者打造。 Online course , manual and download presets . 它将 10 多种交易工具 整合到一个系统中,包括趋势检测、反转区域、Smart Cloud、移动止损逻辑、支撑与阻力、K线着色、提醒以及多周期分析。 该系统旨在帮助您应对不同的市场环境: 趋势市场: 识别主要趋势,发现回调,跟随动能,并通过止损指导和移动止损选项寻找更清晰的入场机会。 震荡
MTF Supply Demand Zones
Georgios Kalomoiropoulos
4.82 (22)
下一代自动化供需区。适用于任何图表的创新算法。所有区域都是根据市场的价格行为动态创建的。 两种类型的警报 --> 1) 当价格触及区域时 2) 当新区域形成时 你不会再得到一个无用的指标。您将获得一个完整的交易策略和经过验证的结果。     新的功能:     价格触及供需区时发出警报     创建新的供应/需求区时发出警报     推送通知警报     以点为单位的区域宽度标签     关于 MTF 的又一个时间表。因此,现在您将能够看到高于当前 3 个时间帧,而不是高于当前 2 个时间帧     启用/禁用警报/区域/MTF 功能的按钮 您获得的优势:     消除交易中的情绪。     客观化您的交易条目。     通过高概率设置提高您的利润。     节省绘图区域的时间。     像专业人士一样交易金融市场。     任何市场的即时多时间框架分析。 你在图表上看到了什么?     蓝色和红色矩形是当前时间范围的供需区。     虚线样式线是当前上方第一个时间范围内的供需区域。     实线样式线是当前上方第二个时间范围内的
PZ Trend Trading
PZ TRADING SLU
4.8 (5)
许多盈利交易者不仅知道如何识别市场趋势,而且也能把握趋势建立后的交易机会。 Pz 趋势交易 指标设计用来在趋势行情中尽可能的赚取利润。 已建立的趋势提供了一揽子交易机会,但大多数趋势交易指标完全忽视了它们,让交易者在趋势行情时完全不知道该如何做!一般趋势指标只通知有关的趋势变化,但根本不足以得到卓越的回报. Pz 趋势交易 指标比一般趋势指标显示多达 20 倍的交易 , 因为它注重所谓的市场时机。它不仅显示当前的市场趋势,也有回调,内柱线的突破和调整。它令您在趋势回调之后介入,安全的柱线内突破金字塔加仓,以及发现潜在的反转,和已知的调整。 趋势改变 一个趋势改变在市场方向变化时发生。趋势变化在图表上用带数字的彩色圆圈显示。蓝色 (1) 信号为上涨开始, 而红色 (1) 信号为下跌开始。趋势变化并非评估当前价格动作的结果, 它意味着交易设置是不定时地。如果您正确使用本指标, 在趋势变化时, 您将将已经入场 (参看下面的调整)。 回调 但凡趋势在运动中,行情上下抖动,盈利者收割利润,且其它参与者入场。趋势回调代表好的买入机会,通常是由主力获利离场导致。如果行情在回调后回归上行, 指标将
Step into the world of Forex trading with confidence, clarity, and precision using   Gold Indicator   a next-generation tool engineered to take your trading performance to the next level. Whether you’re a seasoned professional or just beginning your journey in the currency markets, Gold Indicator equips you with powerful insights and help you trade smarter, not harder. Built on the proven synergy of three advanced indicators, Gold Indicator focuses exclusively on medium and long-term trends eli
MetaBands M4
Vahidreza Heidar Gholami
3.5 (6)
MetaBands使用强大且独特的算法绘制通道并检测趋势,以便为交易者提供进出交易的潜在点。它是一个通道指标和强大的趋势指标。它包括不同类型的通道,可以通过使用输入参数简单地合并以创建新通道。MetaBands使用所有类型的警报通知用户市场事件。 功能 支持大多数通道算法 强大的趋势检测算法 能够合并不同类型的通道 多时间帧和多货币(信号矩阵) 所有类型的警报功能(声音、屏幕闪烁、推送通知、电子邮件、弹出窗口、箭头) 它永远不会重绘 趋势检测 MetaBands使用在通道内振荡的蓝色线来检测趋势。当该线遇到通道的上界时,表明开始下跌趋势,当它遇到下界时,表明开始上涨趋势。如果蓝线接近中线,则市场处于整理期。 该指标使用独特的方法来检测趋势。一开始可能看起来有些复杂,但如果您观看视频教程,您就会意识到它是多么强大且易于使用。 入场和出场信号 当趋势变化或价格穿过上下通道时,MetaBands会立即通过不同的方法提醒交易者,这些方法可以在指标设置中启用。 信号矩阵 要监视来自不同时间框架的多个符号并在一个地方查看信号,请单击右上角按钮或按键盘上的M键以打开信号矩阵。该矩阵可以快速概览
Current event:  https://c.mql5.com/1/326/A2SR2025_NoMusic.gif A. 什么是 A2SR ?   * 这是一个领先的技术指标(没有重绘,没有滞后)。  -  指导 : -- 在  https://www.mql5.com/en/blogs/post/734748/page4#comment_16532516 -- 和  https://www.mql5.com/en/users/yohana/blog A2SR 在确定支撑(需求)和阻力(供应)水平方面有一种特殊的技术。 与我们在网上看到的普通方式不同,A2SR 在确定实际 SR 级别时有一个独创的概念。 原技术不是从网上拿来的,也没有在网上公开过。 A2SR 将根据您的交易风格自动选择 SR 级别。 即使您正在更改时间范围,但 SR 级别仍将保留在其位置上。 因为实际的 SR 不是从你使用的时间范围内获得的。 A2SR 拥有完整的交易工具 。 实际支持(需求)和阻力(供应)的真正概念。 新闻事件和央行讲话的市场情绪。 新闻事件和趋势的主要货币强度 (MCS) 的真正概念
M30/H1/H4 波段版已上线 想抓住M5/M15无法捕捉的大行情? Gold Signal Swing Pro(M30/H1/H4)现已发售。 目标每笔$20-$80+。 https://www.mql5.com/en/market/product/177643 KURAMA GOLD SIGNAL PRO(MT4版)— 7层过滤器、自动TP/SL、品质评分搭载 XAUUSD完整交易系统 不重绘。不重画。不延迟。每个信号永久固定。所见即所得。 福利:购买买断版许可证可免费获得 AI Zone Radar(价值$59)+ 完整PDF手册。购买后请给我发消息。 AI Zone Radar: https://www.mql5.com/en/market/product/175834 交易员的信赖:已被活跃的黄金交易员社区使用。因精度和易用性获得赞誉。 你的问题 — 以及解决方案 你知道黄金每天波动$30-50。你知道这里有钱可赚。但是: - 入场过早,价格反向$10后才朝你的方向走 -
BTMM State Engine Pro MT4
Garry James Goodchild
BTMM State Engine Pro is a MetaTrader 4 indicator for traders who use the Beat The Market Maker approach: Asian session context, kill zone timing, level progression, peak formation detection, and a multi-pair scanner from a single chart. It combines cycle state logic with a built-in scanner dashboard so you do not need the same tool on many charts at once. What it does Draws the Asian session range; session times can follow broker server offset or be set in inputs. Tracks level progression (L
Advanced Supply Demand
Bernhard Schweigert
4.91 (300)
现在优惠 40%! 任何新手或专业交易者的最佳解决方案! 该指标是一款独特、高质量、且价格合理的交易工具,因为我们已经整合了许多专有功能和新公式。 依据此更新,您将能够显示双重时间帧区域。 您不仅可以显示一个较高的时间帧,还可以同时显示图表时间帧,加上更高的时间帧:显示嵌套时区。 供需双方所有交易者都会喜欢它。 :) 重要信息披露 高级供需的最大潜力,请访问 https://www.mql5.com/zh/blogs/post/720245   想象您的交易如何得以改善,是因为您能够精准定位入场或目标位吗? 构建于新的底层算法,它可以更轻松地识别出买卖双方之间的潜在失衡。 这是因为它以图形方式展示供需最强劲区域,及其过去的表现(显示旧区域)。 这些功能旨在帮助您更轻松地发现最佳入场区域和价位。 现在您可以针对您的交易品种和时间帧来优化和编辑区域强度! 高级供需指标适用于所有产品和时间帧。 它是一个新的公式,非常新的功能是两个区域强度函数可由用户输入进行调整! 这在交易中是一大优势。 当您学习如何使用专有功能,例如带有价格游离最小 X 因子的区域强度时,您能够判断该区域强劲与否。 供需
Neo Wave PRO
Nikolay Raykov
Price & Time Market Structure Indicator A professional market structure tool that analyzes waves through both price and time — not price alone. Main Description NeoWave PRO is a professional market structure indicator for MetaTrader 4 designed for traders who want to move beyond traditional one-dimensional wave tools such as ZigZag, swing indicators, and basic high/low systems. Most wave indicators analyze only one thing: Price. But a real market wave is not only a price movement. A true wave de
RFI levels PRO
Roman Podpora
5 (1)
该指标能够准确显示反转点和价格回落区域。     行业领军人物 。您能洞察新趋势的形成,并以最高的精准度做出决策,掌控每一笔交易。 与……结合时,展现其最大潜力     趋势线专业版   指标  VERSION MT5 该指标显示的内容: 新趋势开始时的反转结构和反转水平及其激活。 显示屏   获利了结   和   止损   风险回报比最低的水平     RR 1:2       。 具有智能减值逻辑的止损。 显示指定指标中两种趋势类型的反转形态。 指标: 根据     趋势线     (全球趋势变化) 潮流专业版     (趋势快速变化) 简单有效   扫描器   实时趋势(新增)。 多时间框架工具筛选。 展示   利润   在 LOGIC AI 信号之后。 以下列出今日走势积极的金融工具。(RB键) 能够为终端启用通知(警报)功能,并向移动设备推送通知。 逻辑人工智能     — 利用人工智能寻找最佳切入点。 只有在启用 MTF(多时间框架分析)模式时,该功能才可用。 兼容性。 当与趋势线指标结合使用时,该指标能发挥其最大潜力。 这     RFI LEVELS PRO    
Quant Direction
Georgios Kalomoiropoulos
Quant Direction 是一款三维市场分析工具。它通过同时计算多个维度上的精确百分比偏差,提供完全客观的、基于算法的市场分析视角。该算法采用先进的人工智能建模工具开发,并经过全面测试,旨在以独特的精准度解读市场。它可以分析您平台上的任何货币对或金融工具。 无论您是短线 交易者、日内 交易者还是波段交易者,Quant Direction 都是您的理想之选。 交易者的真正优势 Quant Direction 的真正优势在于彻底消除情绪、屏幕疲劳和过度思考。它无需手动点击十几个图表来寻找方向并反复质疑自己的偏好,引擎即可在几毫秒内即时处理 8 个时间周期(从 5 个月到月线)。它能准确告诉你任何时刻谁在掌控市场,确保你始终朝着概率最高的方向进行交易。 市场分析的三个维度 该算法将市场分为三个不同的交易维度,为您提供完整的宏观和微观视角: 超短线交易分析: 捕捉即时、快速的动量变化和较低时间框架的执行点。 日内分析: 识别真实的、潜在的每日方向性偏差。 波动分析: 专注于宏观趋势,确保您不会与大盘机构的走势背道而驰。 独家评分引擎 Quant Direction 的底层采用了一套
MonsterDash Harmonic Indicator
Paul Geirnaerdt
4.54 (26)
MonsterDash Harmonic Indicator is a harmonic pattern dashboard. It recognizes all major patterns. MonsterDash is a dashboard that displays all detected patterns for all symbols and (almost) all timeframes in sortable and scrollable format. Users can add their own user defined patterns . MonsterDash can open and update charts with the pattern found. Settings MonsterDash's default settings are good enough most of the time. Feel free to fine tune them to your needs. The color settings are for thos
Apollo SR Master
Oleg Rodin
5 (2)
Apollo SR Master 是一款支撑/阻力指标,其特殊功能使利用支撑/阻力区域进行交易更加便捷可靠。该指标通过检测局部价格顶部和底部,实时计算支撑/阻力区域,没有任何时间延迟。为了确认新形成的支撑/阻力区域,该指标会显示特殊信号,表明该支撑/阻力区域可以作为实际的卖出或买入信号。在这种情况下,支撑/阻力区域的强度会增强,因此从该区域进行交易的成功率也会更高。这正是该指标的核心理念。 SR区域也使止损和止盈的操作更加便捷。根据信号方向,可以将SR区域上方或下方的空间用作止损位。此外,相对的SR区域也可以用作潜在的止盈区域。 我还免费向所有 Apollo SR Master 指标的用户提供我的“Apollo 价格行为系统”指标。这两个指标结合使用将帮助您找到更好的入场点。 购买后请联系我,即可免费获得我的交易技巧以及我的“阿波罗价格行为系统”指标作为赠品!
Advanced Currency Strength28 Indicator
Bernhard Schweigert
4.91 (657)
目前40%的折扣 任何新手或专家交易者的最佳解决方案! 这个指标是一个独特的、高质量的、可负担得起的交易工具,因为我们纳入了一些专有的功能和一个新的公式。只需一个图表,你就可以读出28个外汇对的货币强度!想象一下,你的交易将如何得到改善,因为你的交易是在你的手中进行的。想象一下,你的交易将如何改善,因为你能够准确地确定新趋势或剥头皮机会的触发点? 用户手册:点击这里  https://www.mql5.com/en/blogs/post/697384 这是第一本,原版的! 不要买一个毫无价值的崇拜者的克隆品。 特别的 子窗口中的箭头显示强劲的货币势头GAP将指导你的交易! 当基础货币或报价货币处于超卖/超买区域(外盘斐波那契水平)时,在个人图表的主窗口中出现警告信号。 当货币力量从外围区间回落时,回撤/反转警报。 十字星模式的特别警报 可选择多个时间框架,以快速查看趋势! 货币强度线在所有的时间框架中都非常平稳,当使用较高的时间框架来识别总体趋势,然后使用较短的时间框架来确定精确的入口时,效果非常好。你可以根据自己的意愿选择任何时间框架。每个时间框架都由其自身进行了优化。
Auto Optimized Parabolic RSI: 高级 3D 动量引擎 大多数零售指标之所以失效,是因为它们依赖于静态输入,一旦市场波动率发生变化,这些输入就会崩溃。Auto Optimized Parabolic RSI 通过不断重新计算自身的数学优势,解决了“指标衰退”的问题,将机构级别的量化自适应能力直接引入您的 MT5 终端。 核心优势:定制的内存 3D 优化   标准的自动优化器通常会导致 MT5 平台卡顿,因为它们通过标准的指标调用使终端超载。该工具完全绕过了这些性能瓶颈。内部引擎采用定制的原生基于 RAM 的计算器构建,每次加载图表或更改时间周期时,它都会执行极速的 3D 网格搜索。它同时扫描 RSI 周期(频率)、SAR 步长(加速度)和 SAR 最大值(速度限制),在绝对的毫秒级时间内测试数以万计的参数组合,且完全不会拖慢您的平台。它不是仅仅寻找一个“不错”的设置,而是映射整个参数空间,以寻找资产当前动量结构的绝对全局最大值。 严格的财务评分与逼真的交易模拟   与基于抽象“指标点数”进行优化评分的业余工具不同,该引擎的 3.10 版本严格与资金数学挂钩。每
PZ 123 Pattern
PZ TRADING SLU
1 (1)
123模式 是最受欢迎,功能强大和灵活的图表模式之一。该模式由三个价格点组成:底部,峰值或谷值以及38.2%至71.8%之间的斐波纳契回撤位。当价格突破最后一个峰值或谷值时,该形态被认为是有效的,此时指标绘制箭头,发出警报并可以进行交易。 [ 安装指南 | 更新指南 | 故障排除 | 常见问题 | 所有产品 ] 清除交易信号 可自定义的颜色和尺寸 实施绩效统计 可定制的斐波那契回撤水平 显示适当的止损和获利水平 该指标可用于查找连续或反转形态 它是不可重涂和不可重涂的 它实现了电子邮件/声音/视觉警报 123模式 可以表现为连续或反转模式。为了简化操作,该指标使您可以选择要寻找哪种类型的形态,使其成为趋势或反转交易者的绝佳工具。 设置 将指标加载到任何图表时,将显示一组选项作为输入参数。如果您认为它们太多,请不要感到失望,因为参数被分组为不言自明的块。这就是每个参数块的作用。 幅度-幅度表示替代价格点之间的最小柱线量。要找到大图案,请增加幅度参数。要查找较小的模式,请减小幅度参数。 闵。回撤-形态中所需的最小斐波那契回撤。设置为零不对其进行评估。 最大。回撤-形态中可能的最大斐
Market Makers
Mohamed Hassan
5 (4)
After purchase, contact me privately to receive 1 month of free testing with EA Forex Proton! This advanced MT4 trading robot automatically executes signals from any MT4 indicator, including Market Makers. The latest version also includes AI integration, allowing each trade signal to be analyzed using Artificial Intelligence. Live Signal with EA Forex Proton: Click here Market Makers is a powerful price action trading system designed to identify high-probability Buy and Sell opportunities based
Scalper Vault
Oleg Rodin
5 (37)
Scalper Vault 是一个专业的剥头皮系统,为您提供成功剥头皮所需的一切。该指标是一个完整的交易系统,可供外汇和二元期权交易者使用。推荐的时间范围是 M5。 该系统为您提供趋势方向的准确箭头信号。它还为您提供顶部和底部信号以及江恩市场水平。无论您拥有何种交易经验,该系统都易于使用。您只需要遵循简单的规则并每天重复该过程。 建议将此系统用于主要货币对。感谢您的关注! 请注意,该指标在策略测试器中可能无法正常工作。因此,我建议仅在模拟或真实账户的真实交易条件下使用该系统。 指示器提供所有类型的警报,包括推送通知。 购买指标后请与我联系。我将免费与您分享我的个人交易建议和出色的奖励指标! 祝您交易愉快,盈利!
作者的更多信息
Va bank
Viktor Glovluk
5 (1)
This multi-currency EA analyzes the last closed candle of a specified timeframe (Weekly is recommended), calculated candle body and, if it exceeds the set parameter, opens an order in the opposite direction from the calculated price. Pairs are specifies in the EA's settings. It has the trailing stop function. You can also set a trading day (for D1, W1) and day of closing open orders. Specify trading type in settings: all pairs or by the largest candle body . Manual tests of the strategy using "b
The script draws levels based on the weekly options reports published on the ftp server of CME Group ftp://ftp.cmegroup.com/bulletin/. On the server, select the report for the day preceding the one you want to draw the levels on (to draw levels on 02.10.2015 download a report of 01.10.2015, most reports are published at 10:00 Moscow time the day after the reporting date, this is exactly what we need). Select the required option from the downloaded ZIP file, for example for EURUSD you need Sectio
Gridder
Viktor Glovluk
This is a grid Expert Advisor using EMA to filter a trend and CCi to enter the market. It allows you to manually filter flat and trend parts of the market or traded symbols. The lot is calculated based on the smart algorithm depending on the order location. The EA features the filter of the minimum distance between unidirectional orders calculated based on the specified percentage of the average daily candle for 21 days allowing the EA to avoid excessive load on the deposit. The profit is fixed
Zig Zag Alert
Viktor Glovluk
Standard ZigZag with added alert, push notifications and email messages on breakout of the last formed HIGH - LOW! It does not consider the current extremum of the ZigZag, that is being redrawn! Indicator Settings Depth - determines the size of the interval or the number of candles after the previous extremum of the indicator, on which it will not look for a new extremum Deviation - the number of points between the extremums (Lows or Highs) of two adjacent candlesticks to form a local bottom of
MA collection
Viktor Glovluk
MA collection - мультитаймфреймовый индикатор, вобравший в себя множество разработок в сфере усреднения ценового ряда. Включает свыше 20-ти разновидностей индикаторов усреднения и более 10-ти единиц ценовых данных к которым может быть применено усреднение. В индикаторе предусмотрена цветовая и звуковая индикация смены тенденции. Методы усреднения: Simple Moving Average Exponential Moving Average Wilder Exponential Moving Average Linear Weighted Moving Average  Sine Weighted Moving Average Triang
The indicator builds the ranges of the probable price movement according to the specified timeframe. The range is built starting from the Open level of the specified timeframe and extended to the timeframe's Close, shifting relative to the extremes. The upper boundary is laid from the minimum and moves only downward when the Low is updated. The lower border is laid from the maximum and rises only when the High is updated. When the price approaches the range boundaries, the probability of movemen
Trend assist
Viktor Glovluk
5 (1)
Easy to use trend indicator. Only one adjustable parameter that does not require optimization, which is responsible for the timeframe of the second line of the indicator. It can take three values: current - the second line is not calculated, one higher - one timeframe higher that the current one, two higher - two timeframes higher than the current one. The system for determining the market direction is based on a proprietary method, which uses the two most effective standard indicators (CCi and
筛选:
无评论
回复评论