Fibo Retracement

Description 

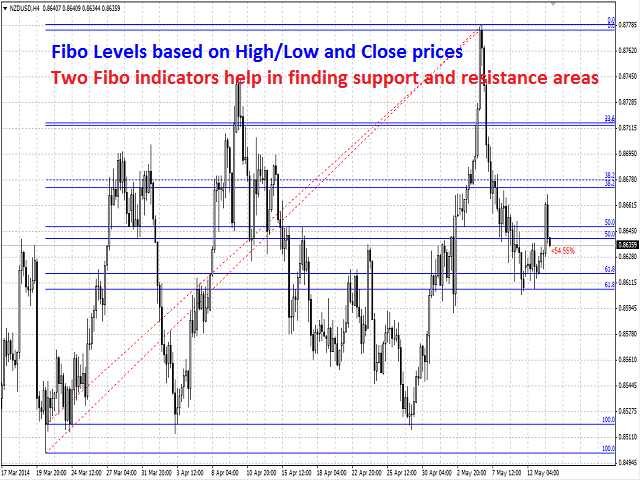
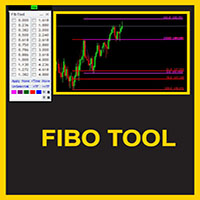
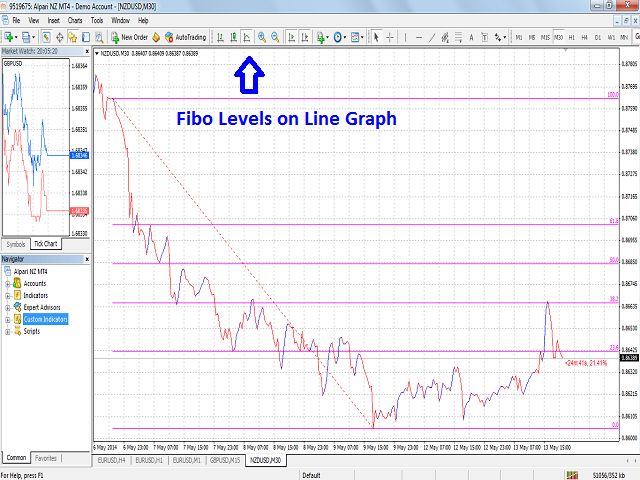
Fibo Retracement is an indicator that automatically plots Fibonacci levels in the main chart based on Close prices, which distinguishes it from the Fibo Levels indicator that plots levels based on High/Low prices.

Thus, using both indicators provides the trader with the opportunity of determining support and resistance zones by Fibonacci!

The levels are calculated and plotted over a certain interval using the number of bars specified by the user.

The user can display Fibonacci levels of the bullish and bearish trends in different colors.

Furthermore, the indicator may be set to display the time remaining until the completion of the current bar in <d:h:m:s format, as well as Fibonacci retracements, where:

  • < - an indication of the current bar.
  • d - days.
  • h - hours.
  • m - minutes.
  • s - seconds. 


Purpose

The indicator can be used for manual or automated trading as part of an Expert Advisor. For automated trading, use the indicator buffer of double type: 

  1. Fibonacci retracement of the bullish trend - buffer 0, must not be equal to -1.
  2. Fibonacci retracement of the bearish trend - buffer 1, must not be equal to -1.


Input Parameters

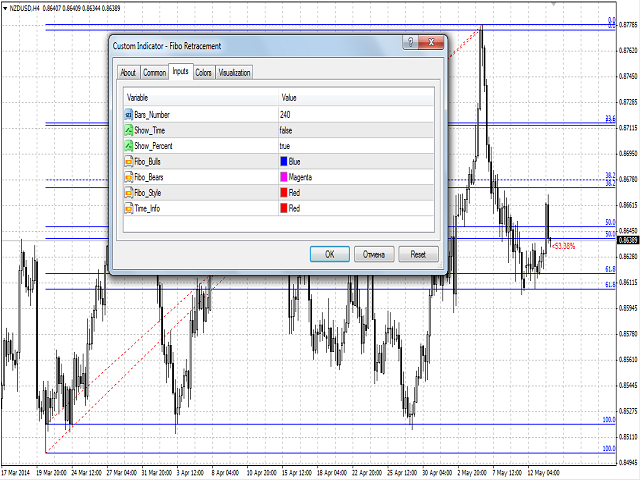
  1. Bars_Number - number of bars (recommended value is 240 or 250).
  2. Show_Time - permission to display the time remaining until the completion of the current bar.
  3. Show_Percen - permission to display the current Fibonacci retracement.
  4. Fibo_Bulls - color of Fibonacci levels in the bullish environment.
  5. Fibo_Bears - color of Fibonacci levels in the bearish environment.
  6. Fibo_Style - color of the auxiliary line.
  7. Time_Info - color of the displayed information.


Recommendations

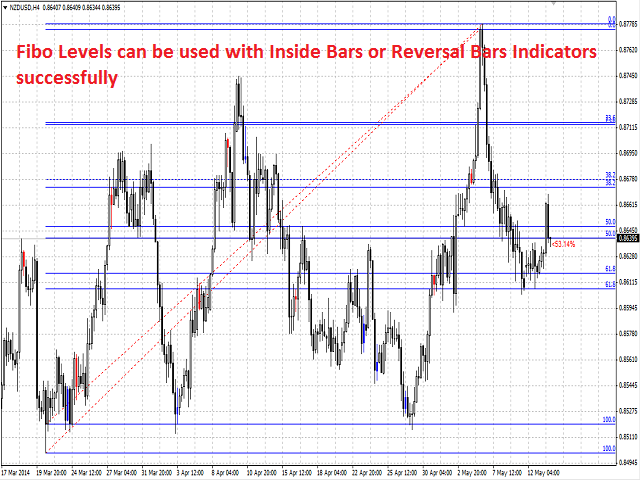
The indicator can be used successfully together with another indicators such as Impulse Systems, Inside Bars or Reversal Bars and so on.
推荐产品
The   Five Minutes Strategy   EA is designed for trading binary options. EURUSD on the five-minute period is strongly recommended. Trading is performed by the opening prices based on the signals of the   Five Minutes   indicator. It requires at least 100 bars in history to operate. Input Parameters Initial Deposit - initial deposit. Lot Value - lot size. Lot Type - lot type: Fixed - fixed. Variable - variable. Last Lot Value - last lot value (used in cases when the EA is reattached) Day lot typ
This indicator is a great utilities tools for Fibonacci Trader that draw their chart manually. This indicator do not draw any Fibonacci Retracement or Fibonacci Expansion. It is a utilities tool for modifying the Fibonacci level for Fibonacci object manually drawn on the chart. Just draw using the Fibonacci Retracement or other Fibonacci tool in MT4 as per normal. The select the Fibonacci you have just drawn. Make sure you have only 1 object selected. Then open up this Fibonacci Level Management

mql5 version:  https://www.mql5.com/en/market/product/44815 Simple indicator to calculate profit on fibonacci retracement levels with fixed lot size, or calculate lot size on fibonacci levels with fixed profit. Add to chart and move trend line to set the fibonacci retracement levels. Works similar as default fibonacci retracement line study in Metatrader. Inputs Fixed - select what value will be fix, lot or profit Fixed value - value that will be fix on all levels Levels - levels for which to ca
AutoPivot
Hafis Mohamed Yacine
This indicator will draw monthly, weekly, and daily pivot. Pivot line will be calculated automatically again when the period ends. Auto Pivot Metatrader 4 Indicator The Auto Pivot indicator for Metatrader 4 automatically updates the pivot point (PP), support (S1,S2,S3) and resistance levels (r1,r2,r3) every day. Price above the pivot point means positive while price below the pivot point means negative. S3 indicates extremely oversold while price above resistance r3 means extremely overbought.
Flat finder MT4
Yuriy Lyachshenko
该指标检测平仓,并在发现的区域画上一个彩色的矩形。 该指标的主要思想是,当价格填满图表上的某个区域时,检测出一个平盘。 输入参数: Color rectangle - 要着色的矩形的颜色。 Bars in rectangle - 矩形中允许的最小条数。 Density in % - 扁平的密度,设置为矩形区域的百分比。 __________________________________________________________________ __________________________________________________________________ ________________________
FIBO Price Calculator 功能简介 1. 自动绘制斐波那契回调线 本指标可自动在MT4图表上绘制斐波那契回调线,助您快速识别潜在支撑和阻力位。 2. 自定义斐波那契数列 用户可自定义斐波那契数列的数值,指标会根据当前市场价格自动换算成相应价格水平。 3. 灵活调整指标窗位置 指标窗可放置在图表的四个角中的任意位置,方便用户根据个人喜好和交易习惯调整布局。 综上所述,本指标不仅能够帮助交易者自动绘制斐波那契回调线,还提供了自定义输入斐波那契黄金数列换算成价格以及自定义指标窗位置的功能,为交易者提供了更便捷、更灵活的技术分析工具。无论是初学者还是经验丰富的交易者,都能够通过本指标更好地把握市场趋势,提高交易成功率。
The Wing Patterns indicator scans for many different kinds of Patterns using an XABCD structure. The term Wing Pattern is used to refer to all types of patterns based on a general XABCD structure, which is plotted in an alternate high-low extreme form. In other words, assume that point X is started at a low point on the chart. The point A is plotted at the next highest point within a certain number of bars. This certain number of bars is called the depth level. In this example, point B would be
Fibonacci retracements can be used to draw support lines, identify resistance levels, place stop-loss orders and set target prices. The Advanced Automatic Fibonacci retracements draws automatically all the levels. You have a lot of options to choose. For exemple you can use the tracements of another time frame (MTF) in the current chart, you can also choose between the closest level or less close to draw the retracements. You can also add 2 levels of your choice. You can add levels extensions o
The PUA MultiType Pivot indicator is built on the daily chart of the previous day. The PUA MultiType Pivot indicator is one of the most popular tools in technical analysis, used by traders to identify potential reversal points in financial markets. This indicator constructs three types of Pivot points: Classic, Fibonacci, and Camarilla, each offering its unique approach to market analysis. The advantages of this indicator include: Simplicity and Clarity PUA MultiType Pivot provides clearly defi
Fibo Bands
Igor Semyonov
5 (1)
Fibo Bands is an innovative indicator and an analyzer for trading in the current trend direction. The indicator builds a Fibonacci channel (bands), and consists of a trend line (middle line), channel bands, colored bars and reference information. After completion of the current bar, the trend line, the channel and the color of the bar are not redrawn. However, the channel width can be changed after a reset or restart of the indicator depending on volatility. The channel is built in accordance wi

Mean Reversion Supply Demand Indicator Mean Reversion Supply Demand is the indicator to detect the important supply demand zone in your chart. The concept of supply demand trading relies on the quantity mismatching between buying and selling volumes in the financial market. Typically, supply demand zone serves to predict the turning point. The wave pattern, for any supply demand zone to work as an successful trade, looks like the price must touch the base zone, move away and then return to zone
Description  Fibo Levels  is an indicator that automatically plots  Fibonacci  levels. The levels are calculated and plotted    over a certain interval using the number of bars specified by the user . When the price achieve one of the target levels (23.6%, 38.2%, 50% or 61.8%) the indicator at the request of the user gives a sound signal and/or sends the message by e-mail. Example of the e-mail notification: Subject:  Fibo Up Signal Message:  Signal,H1 - Correction of EURUSD reached 23.6% - 2014
Demark mtf
Sergey Fionin
該指標顯示德馬克模式並以箭頭和警報的形式給出交易信號。 在報價歷史上顯示 De Mark 行。 具有多幀。可以在較低的時間範圍內顯示較高時間範圍的 DeMark 模式。 具有顯示分形的可切換功能。 交易信號伴隨著聲音警報,並將它們發送到郵件和移動設備。 /////////////////////////////////////////////////////////////////////////////////////////////////////////// /////////////////////////////////////////////////////////////////////////////////////////////////////////// /////////////////////////////////////////////////////////////////////////////////////////////////////////////
该指标旨在与艾略特波浪理论相结合,提供了两种不同的工作方式: 自动工作: 在此模式下,指标会自动检测图表上的所有五个动机波浪,并为您提供预测和潜在的逆转区域。它还可以提供警报和推送消息。这种自动功能简化了识别和分析艾略特波浪模式的过程。 手动工作: 此选项适用于喜欢手动方法的交易员,用于手动绘制九个不同等级的波浪。每个等级都可以在它们出现后通过调整图表上的绘制线条来单独定义。此功能简化了手动绘制波浪的过程,使其更加高效。需要注意的是,所有绘图数据将保存在平台的数据文件夹中,以备将来参考。 参数: Name: 指标名称。 Use_System_Visuals: 启用或禁用指标主题,以匹配交易平台的整体外观。 Explain_Comment: 允许启用或禁用波浪编号的解释性注释,有助于理解已识别的波浪。 Show_Last_Candle_Counter: 启用或禁用蜡烛计时器,提供有关当前蜡烛收盘的剩余时间的信息。 Candle_Counter_Color: 蜡烛计时器文本的颜色。 Basic_Wave_Color: 用于表示波浪的主要颜色。 Bullish_Wave_Color: 当检测
Rainbow Price Visualizer
Vincent Jose Proenca
Rainbow Price Visualizer v1.21 See where the market really breathes. Turns your MT4 chart into an ultra-precise heatmap that highlights price zones favored by big players. Why it matters 300 price levels at 0.2‑pip resolution — microscopic detail. 8 visual themes (Rainbow, Fire, Ocean…) for instant readibility. Smart opacity: low noise fades, real zones pop. Lightweight rendering with automatic cleanup. Fully customizable: saturation, opacity, resolution, history depth. Bands project into the f
Fibonacci Retracement object is an object that has been provided by metatrader 4 platform. But  Fibonacci Retracement  object doesn't automated adjust the chart. You have to put and manage it manually to the chart. Because of that, this indicator was created. If you like using filbonacci retracement indicator, highly recommended to use Automated Fibonacci Retracement Indicator if you want to get better result in here: https://www.mql5.com/en/market/product/95515 LT Automated Fibonacci Retraceme
FREE
Данная утилита (эксперт который сам не открывает ордера) ищет на графике паттерны Price Action : DBLHC и DBHLC Рельсы CPR Пин-бар HR PPR TBH и TBL OB где каждый паттерн имеет гибкие настройки того, как он должен выглядеть по Вашему мнению. К примеру, возьмём пин-бар, который имеет так называемый нос а также левый и правый глаз. Так вот в настройках Вы можете указать минимальную длину этого самого носа, максимальный размер самого тела и хвоста, и минимальный размер левого глаза, по отношению
Auto Levels
Yaroslav Varankin
Auto Level this tool is able to determine the levels of support and resistance. search and display when the price has broken through the level and when it pushed off from it. the indicator can be useful if you use resistance support levels in your trading. or the highs and lows of the price, then it will greatly simplify your work and help you more quickly and more accurately determine the rebound or breakdown of the current trend or tendencies level. blue line bottom uptrend red line on top dow
晨星 PRT 指標採用早盤持平突破原理。此指標顯示早晨持平水平並顯示可能的目標。 指標中增加了額外的斐波那契水平,以及有關設定中指定的目標水平與夜間持平水平相交的聲音警報。 晨星 PRT 指標在夜間結束時建造了一個夜間平坦通道,以及兩個向上和向下的斐波那契價格水準。這些水平可以被視為目標水平和逆轉水平。 晨星 PRT 指標適用於所有時間範圍,但在 M15 間隔上使用它最有效。 The Morning Star PRT indicator uses the morning flat breakout principle. The indicator displays morning flat levels and shows possible targets. An additional Fibonacci level has been added to the indicator, as well as sound alerts about the intersection of both target levels specified in the settings and
Reversal Pattern AI
Stanislav Konin
5 (1)
Reversal Pattern AI is a groundbreaking advancement in indicator development, combining artificial intelligence algorithms, multi-level market analysis, and classical technical analysis methods. It not only detects reversal patterns but also evaluates market inefficiencies, generating highly accurate trading signals.Thanks to its hybrid model, which utilizes price action analysis, volume, volatility, VWAP, and Volume AVG %, the indicator easily adapts to any market conditions. Reversal Pattern A
F ully automated Expert Advisor using the  advanced   algorithm for trading the EURUSD Designed for profit in a short period of time and big profit in a long run. Prefers EURUSD 1H. Principle of operation The SELL and BUY orders are opened (depending on the parameters set), guided by signals and the market situation.     Recommended parameter: Use an ECN broker account. minimum deposit of 100$ USD. use it in H1 time frame recommended symbol is EURUSD input parameter: TrendType                 
El indicador "MR BEAST ALERTAS DE LIQUIDEZ" es una herramienta avanzada diseñada para proporcionar señales y alertas sobre la liquidez del mercado basándose en una serie de indicadores técnicos y análisis de tendencias. Ideal para traders que buscan oportunidades de trading en función de la dinámica de precios y los niveles de volatilidad, este indicador ofrece una visualización clara y detallada en la ventana del gráfico de MetaTrader. Características Principales: Canal ATR Adaptativo: Calcula
Fibonacci SR Indicator
Martin Eshleman
5 (1)
菲波纳奇支撑阻力指标 本指标创建支撑和阻力线。此指标基于菲波纳奇回撤和扩展级别。它会考虑菲波纳奇级别的多种组合,并在这些基础上绘制支撑/阻力线。此指标使用的顶部和底部由之字折线指标计算而来。如有必要,之字折线也可以在图表上绘制。 本指标考虑许多过去的反转点和菲波纳奇比率级别的组合,而当它看到多条线在相同的价格汇合,那么这将成为指标绘制的支撑/阻力线。未来的市场反转往往会正好出现在这些线附近。这是一个自动指标。所以,旧线将被删除,新线将随着市场的进步而绘制。 设置 Bars_Back - 向后一定数量的柱线用于所有计算。数量较少则较少反转点将被使用,因此,绘制的支撑和阻力线较少。向后更多柱线则有更多反转点将被使用,因此,绘制的支撑和阻力线较多。  Buffer_Space - 这表示每个已计算的菲波纳奇级别所需的汇合之间的最大点数。该数值越高,则确切的汇合必须越少。数字越低,则精确汇合必须更多,因此有较高的可靠性。例如, 让我们设为 10 点, 且指标运行在非分形的 4-位报价经纪商 (同样是 10 点)。此指标看到 3 个 菲波纳奇 回撤级别,分别在 1.4995, 1.5000,
FREE
自适应图表垂直缩放 忘记频繁手动调整图表! 市场在变化 —— 图表也应该自动适应。 ScaleFix Smart Auto Scaling 是一款适用于 MetaTrader 4 的智能工具,可自动将价格保持在舒适的可视区域内: • 上方极值 —— 距离顶部边缘约 ~10%; • 下方极值 —— 距离底部边缘约 ~10%。 无论市场波动如何,您的图表始终保持整洁、专业且易于阅读。 为什么交易者选择 ScaleFix Smart Auto Scaling 节省注意力 在高强度交易过程中,每一秒专注都非常重要。 无需再在每次价格波动后手动调整图表缩放。 更舒适的分析体验 价格不再“贴”在图表边缘。 您可以更清晰地观察市场结构、动能、区域与形态。 特别适用于: 剥头皮交易 日内交易 Price Action 分析 支撑阻力位交易 多时间周期分析 专业级图表外观 您的交易终端将显得整洁且专业 —— 如同专业交易员和 Prop 团队所使用的界面。 工具功能 自动进行图表垂直缩放 保持上下最佳边距 实时运行 无需手动调整缩放(开启一次即可长期使用) 帮助您将全部注意力集中在市场本身 技术特点 安
MultiFiboDynamicMT4
Andrey Spiridonov
MultiFiboDynamicMT4 is a powerful, professional indicator for estimating the most important support and resistance levels. The main advantage is that it plots the Fibonacci levels at all timeframes simultaneously, which allows the trader to see the full picture of the possible price movement of the trading instrument! Advantages of the indicator The indicator is perfect for scalping and trading binary options. Suitable for beginners and experienced traders. Works on all timeframes. Works on any
FREE
Newlevel
Sergey Nanov
Indicator. Zones of support and resistance levels The most reliable tool in the hands of any technical analyst is support and resistance levels.It is these levels that magically work in the market, because the price then bounces off them, on the contrary, gaining maximum acceleration, punching them and striving for a new price point.However, in practice, many beginners face enormous difficulties in building them.This is due to the fact that the price may react quite differently to them, and ofte
FREE
BPSPanel
Remi Passanello
BPS Panel Breakout Pro Scalper Solution Panel This indicator is part of the   RPTrade Pro Solutions  systems. BPS Panel   is a daily trend indicator using Price Action, Dynamic Support and Resistances. It's designed to be used by anyone, even the absolute beginner in trading can use it. NEVER repaints . Indications are given   from close to close . Designed to   be used alone , no other indicators are required. Gives you the trend and potential Take Profit at the beginning of the day. How doe
Description  Fibo Levels is a color multicurrency/multi-symbol indicator that automatically plots  Fibonacci levels on a candlestick chart in a separate window below the chart of the main financial instrument. It can be used with any broker, regardless of the name of a financial instrument used because the symbol name must be entered manually as an input parameter. If you enter a non-existent or invalid name of a financial instrument, you will receive an error message saying that the specified f
Vortex with Alarm
Fabio Pacchioni
The Vortex Indicator was inspired by the work of an Austrian inventor, Viktor Schauberger, who studied the flow of water in rivers and turbines. Etienne Botes and Douglas Siepman developed the idea that movements and flows within financial markets are similar to the vortex motions found in water. The Vortex Indicator was also partly inspired by J. Welles Wilder's concept of directional movement, which assumes the relationship between price bars gives clues as to the direction of a market. This i
If you wish to draw Support and Resistance lines, view: daily market opening, classical pivot levels, Fibonacci pivot levels, trend lines, Fibonacci levels, the remaining time to candle closing, and current spread. If you seek to place your orders with the exact lot that meets your desired stop loss risk. If you wish to do all this and more with just one click, then this is the perfect tool to use. This tool will allow you to feel more relaxed when deciding to open orders, as well as predicting
该产品的买家也购买
欢迎来到 Trade Manager EA——这是一个终极风险管理工具,旨在使交易变得更直观、精准和高效。它不仅仅是一个下单工具,而是一个用于无缝交易计划、仓位管理和风险控制的全面解决方案。不论您是新手交易员、资深交易员,还是需要快速执行的剥头皮交易员,Trade Manager EA 都可以满足您的需求,适用于外汇、指数、大宗商品、加密货币等各种市场。 借助 Trade Manager EA,复杂的计算已成过去。只需分析市场,在图表上用水平线标记入场、止损和止盈,设置您的风险水平,Trade Manager 就会立即计算出理想的头寸规模,并实时显示以点、账户货币计价的止损和止盈。每笔交易都得以轻松管理。 主要功能: 头寸规模计算器 :根据定义的风险瞬间确定交易规模。 简单的交易计划 :在图表上用可拖动的水平线直接计划交易,设置入场、止损和止盈。 实时显示 SL 和 TP :以账户货币、点或分显示止损和止盈,便于分析。 高级保护工具 盈亏平衡选项 : 基本盈亏平衡 :当您的交易达到设定水平时自动保护利润。 多级盈亏平衡 :设置多达 4 个级别以逐步保护利润。 尾随止损选项 : 基本尾随
Local Trade Copier EA MT4
Juvenille Emperor Limited
4.96 (110)
通过 Local Trade Copier EA MT4 获得非常快速的交易复制体验。它的简单1分钟设置,使您可以在同一台Windows计算机或Windows VPS上在多个MetaTrader终端之间复制交易,具有闪电般快速的复制速度,低于0.5秒。 无论您是初学者还是专业交易者, Local Trade Copier EA MT4 都提供了广泛的选项,可根据您的特定需求进行自定义。对于任何希望增加利润潜力的人来说,这都是终极解决方案。 今天就尝试一下,看看为什么它是市场上最快、最简单的贸易复印机! 提示: 您可以在您的模拟账户中下载并试用 Local Trade Copier EA MT4 模拟版: 这里 将下载的免费演示文件粘贴到您的 MT4 >> 文件 >> 打开数据文件夹 >> MQL4 >> 专家文件夹并重新启动您的终端。  免费演示版本每次可在 4 小时内发挥全部功能,仅限演示帐户。 要重置试用期,请转至 MT4 >> 工具 >> 全局变量 >> Control + A >> 删除。 请仅在非关键模拟账户上执行此操作,不要在挑战道具公司账户中执行此操作。 如果您无法在
Exp COPYLOT CLIENT for MT4
Vladislav Andruschenko
4.69 (65)
MetaTrader 4 专业交易复制器 快速、专业、可靠的 MetaTrader 4 交易复制器。 COPYLOT 可在 MetaTrader 4 与 MetaTrader 5 终端之间复制外汇交易,并为不同账户类型和交易场景提供灵活的同步方案。 COPYLOT MT4 版本支持: MetaTrader 4 → MetaTrader 4 MetaTrader 5 Hedge → MetaTrader 4 MetaTrader 5 Netting → MetaTrader 4   MT5 版本 完整说明 + DEMO + PDF 如何购买 如何安装 如何获取日志文件 如何测试与优化 Expforex 的全部产品 您也可以使用 MetaTrader 5 版本,在 MetaTrader 5 → MetaTrader 5 和 MetaTrader 4 → MetaTrader 5 之间进行复制: COPYLOT CLIENT for MT5 COPYLOT 是一款专业级交易复制器,可稳定运行于 2、3 甚至 10 个终端之间。 支持从模拟账户和投资者密码账户进行复制 可同时运行在多个终端上
News Filter EA: Advanced Algo Trading Assistant News Filter EA is an advanced algo trading assistant designed to enhance your trading experience. By using the   News Filter EA , you can integrate a Forex economic news filter into your existing expert advisor, even if you do not have access to its source code. In addition to the news filter, you can also specify   trading days   and   hours   for your expert. The News Filter EA also includes   risk management   and   equity protection   features
Trade Assistant MT4
Evgeniy Kravchenko
4.43 (197)
它有助于计算每笔交易的风险,容易安装新的订单,具有部分关闭功能的订单管理, 7 种类型的追踪止损和其他有用的功能。 附加材料和说明 安装说明 - 应用程序说明 - 模拟账户应用程序的试用版 线条功能  - 在图表上显示开仓线、止损线、止盈线。 有了这个功能,就可以很容易地设置一个新的订单,并在开仓前看到它的附加特性。   风险管理  - 风险计算功能在考虑到设定的风险和止损单的大小的情况下,计算新订单的成交量。它允许你设置任何大小的止损,同时观察设定的风险。 批量计算按钮 - 启用 / 禁用风险计算。 在 " 风险 " 一栏中设置必要的风险值,从 0 到 100 的百分比或存款的货币。 在 " 设置 " 选项卡上选择风险计算的变量: $ 货币, % 余额, % 资产, % 自由保证金, % 自定义, %AB 前一天, %AB 前一周, %AB 前一个月。   R/TP 和 R/SL - 设置止盈和止损的关系。 这允许你设置相对于损失的利润大小。 例如, 1 : 1 - 这决定了 TP = SL 的大小。 2 : 1 - 这意味着 TP 是 SL 的两倍。 RR - 它禁用比率。  
一旦您確定了要進行交易的關鍵區域,就會自動交易支撐和阻力或供需區域。該 EA 允許您只需單擊即可繪製買入和賣出區域,然後將它們準確地放置在您預期價格轉向的位置。然後,EA 會監控這些區域,並根據您為這些區域指定的價格行為自動進行交易。一旦進行初始交易,EA 就會在您放置的相反區域(即目標區域)獲利。然後,您有兩種選擇,要么關閉交易並繪製新的區域進入,要么獲利退出並立即反向反向交易,創建「始終在」的市場風格策略。 包含輸入和策略的完整手冊位於: https://www.mql5.com/en/blogs/post/760256 該 EA 專為在市場上不使用固定或硬止損的頭寸交易者或美元成本平均交易策略而設計。相反,它的目的是透過在下一個可用支撐或阻力區域以相同方向進行新交易來縮小不正確的交易,並調整您在市場中頭寸的平​​均價格。如果需要的話,還有備用退出標準,形式為每筆交易的最大損失金額或基於時間的退出。 只需按下按鈕即可繪製準備放置在感興趣等級的區域。 關閉按鈕和關閉最舊的按鈕可退出所有交易,或僅退出舊交易(如果它們跌幅過大而無法立即調整您的平均頭寸)。 適用於任何時間範圍內的
Trade copier MT4
Alfiya Fazylova
4.56 (32)
Trade Copier 是一种专业实用程序,旨在复制和同步交易账户之间的交易。 复制发生从供应商的帐户/终端到收件人的帐户/终端,安装在同一台计算机或 vps 上。 促销活动 - 如果您已经购买了“Trade copier MT5”,您可以免费获取“Trade copier MT4”(用于 MT4 > MT5 和 MT4 < MT5 的复制)。欲了解更多详细条款,请通过私人消息与我们联系! 在购买之前,您可以在演示帐户上测试演示版本。 演示 这里 。 完整说明 这里 。 主要功能和优点: 支持复制MT4>MT4、MT4>MT5、MT5>MT4,包括МТ5 netting账户。 供应商和收件人模式在同一产品中实现。 简单直观的界面,允许您直接从图表中实时控制复制。 连接中断或终端重新启动时不会丢失设置和位置。 允许您选择要复制的符号,也可以替换接收者的符号,例如 EURUSD> USDJPY。 支持回拷贝。 能够仅复制某些订单。 允许您设置开仓交易价格的最大差异和最大时间延迟。 正确复制部分订单关闭的执行。 计算复制手数的几种方法。 同步止盈和止损。有几种方法可以计算它们的位置。 支持
Trade Copier Professional — 本地复制解决方案   Trade Copier Professional 是一款可靠的本地交易复制系统,适用于 MetaTrader 4/5。它允许交易者在同一台电脑上的多个账户之间即时复制仓位,内置安全控制,并配备专业级仪表盘。   概览   该 EA 可在单一文件中同时运行 Master 和 Slave 模式,并可无缝切换。交易可在 MT4 与 MT5 终端之间复制,无需依赖互联网,采用本地文件通信以实现最高速度与稳定性。实时仪表盘显示连接状态、复制统计以及每日表现。   手数与风险管理   提供四种手数模式:固定手数、倍数、风险百分比和余额百分比。止损与止盈可按比例调整或缩放,必要时可反向复制信号。安全功能包括每日亏损与交易限制、最小/最大手数控制、断线保护以及错误跟踪与自动关闭。   过滤与可靠性   交易可按品种或 magic number 进行过滤,配置灵活。系统通过错误检测、重试逻辑、安全关闭和全面日志确保可靠性。优化后的执行速度几乎即时,且资源占用极低。   使用方法   将 EA 附加到图表,设置为 Ma
DrawDown Limiter MT4
Haidar Lionel Haj Ali
5 (8)
Drawdown Limiter EA You are in the right place if you were searching for Drawdown control, Drawdown limiter, Balance protection, Equity Protection or Daily Drawdown Limit related to Prop Firm, FTMO, or Funded account trading, or if you want to protect your trading account. Have you suffered from controlling your drawdown when trading funded accounts? This EA is meant for you. Prop firms usually set a rule called “Trader Daily Drawdown”, and if it is not respected, you are disqualified.  I am an
CloseIfProfitorLoss with Trailing
Vladislav Andruschenko
4.87 (31)
Close If Profit or Loss with Trailing for MetaTrader 4 — 按总盈利或总亏损自动平仓 这是一款适用于 MetaTrader 4 的实用型交易管理工具。当总盈利或总亏损达到您设置的水平时,EA 可以自动关闭选定的持仓。 Expert Advisor 会监控当前交易,计算浮动盈亏,并可使用利润跟踪功能,帮助交易者比手动操作更快地管理风险和锁定结果。 MetaTrader 4 仍然被大量手动交易者、剥头皮交易者、网格交易者和 EA 用户使用。但 MT4 本身没有一个方便的内置工具,可以按一组订单的总结果来自动平仓。这个工具正是为了解决这个问题。 Close If Profit or Loss with Trailing 可用于手动交易,也可以与其他 Expert Advisors、网格系统、加仓策略、恢复策略和多品种交易一起使用。您设置规则,EA 负责监控结果,并在条件达到时执行平仓。 MT5 版本 | 完整说明 + DEMO + PDF | 如何购买 | 如何安装 | 如何获取日志文件 | Expforex 的所有产品 为什么 MT4
Support and Resistance Dashboard for MT4 is a multi-timeframe and multi-symbol scanner and alert system that finds S/R zones and pivot points for all timeframes and symbols and alerts when price has interaction with them. If you are using support and resistance (or supply and demand) zones in your trading strategy, this dashboard and its alert and filtering system is a big time saver for you. Download demo version   (works on M 1,M5,M30,W1   timeframes) Full description of scanner parameters ->
试用版下载 Copy Cat More (跟单猫) MT4 交易跟单器 (Trade Copier) 不仅仅是一个简单的本地交易跟单器;它是一套 完整的风险管理与执行框架 (risk management and execution framework), 专为当今的交易挑战而设计。从自营公司 (prop firm) 挑战到个人投资组合管理,它凭借 稳健的执行、资金保护、灵活的配置和先进的交易处理的结合,适应各种情况。 该跟单器同时支持   主控端 (Master,发送方) 与 受控端 (Slave,接收方)   两种模式,可实时同步市价单与挂单、交易修改、部分平仓以及对锁平仓 (Close By) 操作。它兼容模拟与真实账户、交易或投资者登录,并通过持久化交易记忆 (Persistent Trade Memory) 系统确保恢复——即使 EA、终端或 VPS 重启也不例外。可借助唯一 ID 同时管理多个主控端与受控端,跨经纪商差异则通过前缀/后缀调整或自定义品种映射自动处理。 试用版:  先试用看看 :   你可以从下方链接下载并体验   Copy Cat More (跟单猫
Telegram to MT4 Multi-Channel Copier 可自动将您 Telegram 频道中的交易信号直接复制到 MetaTrader 4。无需机器人,无需浏览器扩展,无需手动复制。您在 Telegram 上收到信号,EA 会在几秒钟内在您的终端上开仓。 本产品包含两个组件:一个监听您 Telegram 频道的 Windows 应用程序,以及在您的 MT4 终端上执行信号的 EA。同时也提供 MT5 版本。 设置指南和应用程序下载: https://www.mql5.com/en/blogs/post/768988 工作原理 Windows 应用程序使用您自己的 API 凭据连接到 Telegram,而不是机器人。这意味着它可以读取您订阅的任何频道、群组或话题,包括私人和 VIP 频道。检测到信号后,它会进行解析并发送给 EA。EA 根据您的经纪商解析交易品种名称,基于您的风险设置计算手数,然后开仓。 整个过程都是自动的。您无需守在电脑前。 打开应用程序并登录 Telegram(仅第一次)。 选择要监听的频道或话题。 按下 Start。EA 会处理其余的一切。 支持的
Master Close via Telegram can help you perform some management tasks on MT4/MT5 remotely via your Telegram by one click, easy to set up & use. Demo here (see more Master Notify   Master Control  ) ************************************************************************************ LIST OF COMMANDS: info_acc -  Get account info info_pen -   Get pending orders details info_pos -   Get positions details info_pos_sum -   Get positions summary close_pen -   Delete all pending orders close_pos_all -
Strategy Builder offers an incredible amount of functionality. It combines a trade panel with configurable automation (covert indicators into an EA), real-time statistics (profit & draw down) plus automatic optimization of SL, TP/exit, trading hours, indicator inputs. Multiple indicators can be combined into an single alert/trade signal and can include custom indicators, even if just have ex4 file or purchased from Market. The system is easily configured via a CONFIG button and associated pop-up
PZ Trade Pad Pro MT4
PZ TRADING SLU
3.67 (3)
这是一个可视化的交易面板,可帮助您轻松进行交易管理,避免人为错误并增强交易活动。它结合了易于使用的视觉界面以及完善的风险和位置管理方法。 [ 安装指南 | 更新指南 | 故障排除 | 常见问题 | 所有产品 ] 易于使用 从图表轻松交易 精确的风险管理交易,无忧 保本是重中之重 让利润不受您的关注 尽快享受无风险交易 所有已开通交易的自动追踪止损 交易开始后立即设置初始止损 进行交易后,EA将执行以下任务: 初始止损/获利被自动放置 它会尽快锁定自由行(可选) 它将止损首次移动到盈亏平衡点(可选) 它使用您所需的方法跟踪止损,直到止损为止 其他很酷的功能是: 出色的终端活动报告 单一但功能强大的尾随止损方法 干净的图表界面 没有输入参数 我进行交易后会怎样? 这是您进行交易后EA的操作: 它放置初始止损并获利订单。 尽快搭便车并确保保本。默认情况下,这是通过在达到盈亏平衡点时关闭50%的交易来完成的,默认情况下为5点。这意味着,如果您日后被淘汰,您将一无所获(可选)。 盈亏平衡后,跟踪止损开始运行。 它跟踪止损,直到止损为止,让利润运行。 尾随止损如何运作? 追踪止损表示为所管
MT4 至 Telegram 信号提供者 是一款易用、可完全自定义的工具,它使发送信号到 Telegram 成为可能,将您的账户变成信号提供者。 消息的格式 可以完全自定义! 但是,为了简便使用,您也可以选择一个预设模板,并能够启用或禁用消息的特定部分。 [ 演示 ]  [ 手册 ] [ MT5 版本 ] [ Discord 版本 ] [ Telegram 频道 ]  New: [ Telegram To MT5 ] 设置 可通过 用户指南 获取逐步说明。 无需了解 Telegram API;开发者提供所需的一切。 主要特性 自定义发送给订阅者的订单详情的能力 您可以创建分层订阅模型,例如铜牌、银牌、金牌。金牌订阅可获得所有信号等。 按订单号、符号或备注过滤订单 包括执行订单的图表的屏幕截图 在发送的屏幕截图上绘制已关闭的订单,以便额外验证 推迟发送新订单消息的可能性,以便在发送前对位置进行调整 订单详情的全透明度: 新的市场订单 *附带屏幕截图 订单修改(止损、获利点) 已关闭订单 *附带屏幕截图 部分关闭订单 ** 新的挂起订单 修改的挂起订单(进场价格) 挂起订单激活(
The product will copy all telegram signal to MT4   ( which you are member  ) , also it can work as remote copier.  Easy to set up, copy order instant, can work with almost signal formats, image signal, s upport to translate other language to English Work with all type of channel or group, even channel have "Restrict Saving Content", work with  multi channel, multi MT5 Work as remote copier: with signal have ticket number, it will copy exactly via ticket number. Support to backtest signal. How to
一款面向手动交易的专业面板,把完整的交易流程都收进图表上的一个窗口,从精准入场到账户防护。按设定的风险精确计算手数,借助 RR Tool 直接在图表上用线条搭建交易,开立市价单和挂单、网格与 OCO。持仓的后续管理交给面板打理:最多五级分批平仓、六种跟踪止损、保本以及 Virtual SL/TP。日、周、月三档限额守护本金,一旦被突破即自动触发。 使用指南与免费 Live 演示 免费的 Live 演示版可在此获取 ( Free Live Demo )。 产品的使用指南见此 ( User Manual )。 NT Trade Manager 把交易者的整套工作流程收进图表上一块紧凑的面板,无需在终端各窗口之间反复切换,也不必在每次入场前埋头计算。它为坚持手动、独立判断的交易者而打造:主观交易者、剥头皮和波段交易者,外汇、金属、指数、大宗商品乃至加密货币等任何品种都适用。决策由你拍板,执行的琐碎操作、风控纪律和持仓跟踪则交给面板。没有你的指令,什么都不会发生:这是一件实战工具,而不是全自动交易程序,也不是信号服务。 功能概览 每笔交易的手数都严格按设定的风险算出:可取账户余额的百分比
TradePanel MT4
Alfiya Fazylova
4.84 (95)
交易面板是一款多功能交易助手。该应用包含超过50种手动交易功能,并允许您自动执行大多数交易任务。 在购买之前,您可以在演示账户上测试演示版本。下载用于演示账户的试用版应用程序: https://www.mql5.com/zh/blogs/post/762579 。 完整说明 这里 。 贸易. 只需单击一下即可执行交易操作: 打開掛單和頭寸,並自動計算風險。 一鍵打開多個訂單和頭寸。 打開訂單網格。 按組別關閉掛單和頭寸。 反轉頭寸方向(關閉買入>打開賣出,關閉賣出>打開買入)。 鎖定頭寸(通過開啟缺少的頭寸,使買入和賣出頭寸的數量相等)。 一鍵部分關閉所有頭寸。 將所有頭寸的止盈和止損設置在同一價格水平。 將所有頭寸的止損設置在盈虧平衡水平。 開倉時,可使用以下功能: 在多個訂單或倉位之間分配計算出的數量(在單擊一次時開啟多個訂單和倉位)。 在開啟訂單前在圖表上可視化交易水平。 僅在當前點差不超過設定值時才開啟倉位。 止盈和止損之間的自動比例。 虛擬止損和止盈。 自動將止損和止盈的大小增加為當前點差的大小。 基於ATR指標讀數計算止盈和止損。 設置掛單的到期日期。 為掛單設置追蹤(掛單
Trade Manager Ultimate (MT4/MT5) —— 专业风险与追踪管理系统 欢迎使用   Trade Manager Ultimate   —— 一款终极风险管理与追踪止损解决方案,旨在让您的手动交易更加直观、精准并具备高度可控性。它不仅仅是一个交易面板,更是一套完整的仓位管理与资金保护引擎。无论您是专业短线交易者还是长期趋势交易者,Trade Manager Ultimate 都能够适配您的交易策略,为您的交易提供机构级别的控制能力。 为什么选择 Trade Manager Ultimate? 在快速变化的金融市场中,计算错误和执行延迟都可能造成资金损失。Trade Manager Ultimate 消除了人为猜测与误差。它能够实时监控您的账户数据,并以毫秒级精度执行追踪与保护策略。 核心功能 ️ 高级追踪引擎 独立追踪止损:   为每个订单单独设置追踪止损参数,实现精准管理。 组合追踪(平均价格):   专为网格交易与多仓位交易者设计。系统会自动计算同方向(全部 Buy 或全部 Sell)仓位的加权平均价格,并统一移动止损,以锁定整体利润。 智能
Trade Copier Global
Laszlo Tormasi
5 (15)
Trade Copier Global: The name speaks for itself. This copier allows you to copy orders between MT4 terminals even if they are not installed on the same computer. Features Copying trades between MT4 terminals around the world with a short delay. Automatically recognizes symbol prefixes. Can connect many Slaves to the same Master. Supports pending and market orders. Supports partial order close (with limitations, see below) Can send messages and notifications to the Slaves from the Master Several
达到目标利润时自动锁定利润 EquityTargetCloser   — 是一款 MetaTrader 5 实用工具型专家顾问,当   净值(Equity)超过当前余额达到指定的利润金额时 ,它会自动平掉所有市价单并删除挂单。平仓后目标自动提高:新门槛 = 新余额 + 指定利润。该 EA 不负责开仓,仅管理现有头寸,帮助可靠地锁定利润并保护积累的资金。 MT5-version:  https://www.mql5.com/en/market/product/169839 工作原理 该专家顾问持续将   净值(Equity)   与动态目标进行比较: 目标 =   当前余额(Balance) + plusMoney   (美元)。 当净值大于或等于该金额时,触发保护机制: 平掉   所有市价单   (任何品种)。 如果参数   Delete pending orders = true ,则删除   所有挂单 。 平仓后余额更新,目标重新计算:   新余额 + plusMoney 。这样,EA 在每个成功周期后逐步提高利润锁定门槛。 重要提示 :触发条件取决于   累计浮动利润 ,而不是
跟单->方便快捷的界面交互,用户上手即用       ->>>> 推荐在windows电脑,或者VPS Windows上使用 特色功能: 多样化个性跟单设置: 1.对不同的信号源可以设置不同的手数模式 2.不同的信号源分别设置正向反向跟单 3.信号分别设置注释 4.是否根据合约手数校准手数 多样化个性跟单设置2: 1.对不同的品种可以设置不同的手数模式 2.不同的品种分别设置正向反向跟单 3.信号分别设置注释 4.是否根据合约手数校准手数 注释过滤,MAGIC过滤,信号手数过滤,本地品种过滤 净持仓模式(该模式下手数计算仅支持倍率) 工作时间设置 反向同步接收端的平仓 订单绑定功能:任意订单可以绑定到设置信号源订单上 (双击表格更改) 账户风险控制  基本功能: 跟单正常交互速度0.5s以下 自动检测信号源,并显示信号源账号列表 自动匹配品种,不同平台常用交易品种(后缀不同等特殊情况)95%自动匹配,基本无需手动设置,品种映射表可随意双击更改对应品种.(映射表具有快速搜索品种功能) 4种手数计算模式(1.倍率 2.固定手数 3.自适应资金风险 4.源账户资金比例风险) 特殊手数模式
Auto Trade Copier
Vu Trung Kien
4.76 (85)
自动交易复制器旨在以 100% 的准确度在多个 MT4/MT5 账户/终端之间复制交易。提供商和接收方账户必须位于同一台 PC/VPS 上。使用此工具,您可以将交易复制到同一台 PC/VPS 上的接收方账户。所有交易操作都将从提供商复制到接收方,不会有任何延迟。此版本仅适用于 MT4 账户。对于 MT5 账户,您必须使用 MT5 的自动交易复制器。参考: 参考: 对于 MT4 接收器,请下载“Trade Receiver Free” 这里 . 对于 MT5 接收器,请下载“Trade Receiver Free MT5”  这里 . 对于同一台 PC/VPS 上的 MT5 提供商,请检查“Auto Trade Copier MT5” 这里 . 如果您需要通过互联网在不同的 PC/VPS 上进行账户复制,请查看“Trade Copier Pro” 这里 . 如果您需要通过互联网在不同的 PC/VPS 账户之间进行复制,且接收方数量不限,请查看“无限交易复制器专业版” 这里 . 以下是重点功能 在 MT4 和 MT5 账户之间复制。 一个提供商可以将交易复制到多个接收者的账户。 一个提
Trading History MT4
Siarhei Vashchylka
5 (9)
Trading History - A program for trading and money management on the history of quotes in stratagy tester. It can work with pending and immediate orders, and is equipped with trailing stop, breakeven and take profit functions. Very good for training and testing different strategies. Manual (Be sure to read before purchasing) Advantages 1. Allows you to test any trading strategy in the shortest possible time 2. An excellent simulator for trading training. You can gain months of trading experience
Telegram to MT4 Coppy
Sergey Batudayev
4.09 (11)
Telegram 到 MT4: 终极信号复制解决方案 使用 Telegram 转 MT4 简化您的交易流程,这款先进的实用程序旨在将交易信号直接从 Telegram 频道和聊天复制到您的 MetaTrader 4 平台,无需 DLL 文件。这款强大的解决方案确保信号执行的无缝衔接,拥有无与伦比的精度和丰富的自定义选项,从而节省您的时间并提高您的效率。 [ Instructions and DEMO ] 主要特点 直接 Telegram API 集成 通过电话号码和安全码进行身份验证。 使用用户友好的 EXE 桥轻松获取和管理聊天 ID。 添加、删除和刷新多个频道/聊天以同时复制信号。 使用高级过滤器进行信号解析 跳过包含自定义例外词(例如“报告”、“摘要”)的不需要的信号。 支持灵活的 SL 和 TP 格式:价格、点数或点数。 当信号指定点而不是价格时自动计算入场点。 订单定制和灵活性 使用多种模式定制订单规模:固定手数、动态手数(% 风险)或特定符号手数。 使用信号数据或自定义参数调整 SL/TP。 配置滑点、挂单到期和重试设置以实现完美执行。 综合符号管理 排除特定符号或匹配自定义
Custom Alerts AIO:多市场智能监控,一键启动,无需设置 概述 Custom Alerts AIO 是一款“开箱即用”的高级市场扫描工具,无需额外安装任何其他指标或进行复杂设置。它内置了 Stein Investments 的所有核心指标(FX Power、FX Volume、FX Dynamic、FX Levels 和 IX Power),可帮助您轻松监控所有主要资产类别,如外汇、黄金、指数和加密货币。如果您的经纪商支持股票,您也可以手动添加个股进行监控。 1. 为什么选择 Custom Alerts AIO? 无需额外购买任何指标 • 所有关键指标均已内置,开箱即用。 • 专注于实时预警,不包含任何图形元素,性能高效,界面简洁。 全面覆盖所有主要市场 • 支持监控外汇、金属、加密货币和指数市场。 • 无需手动输入任何交易品种,只需在设置中勾选资产类别即可启用。 • 股票并不属于默认类别,如有需要可手动通过参数输入添加。 高效、专业、便捷 • 无需图表模板和手动加载,适合自动化或远程交易环境。 • 非常适合 VPS 上长期运行,或作为后台市场预警工具使用。 2
MACD Divergence Scanner is a multi-timeframe and multi-symbol dashboard and alert that checks all timeframes and symbols to find regular and hidden divergences between price chart and MACD indicator. This divergence scanner is integrated with support and resistance zones so you can check the MACD divergences in the most important areas of the chart to find trend reversals in the price chart. Download demo version   (works on M 1,M5,M30,W1   timeframes) Full description of scanner parameters ->  
TPSpro Risk Manager
Roman Podpora
3.67 (3)
TPSpro 风险管理器   是一个独特的专业风险控制系统,适用于任何培训和任何资本的交易者。让您避免交易中的损失和交易中的严重错误。 TPSpro 风险管理器对于风险管理是必要的,主要是对于剥头皮交易者和日间交易者而言,但任何交易风格的交易者都可以成功使用。 该面板有 3 列,每一列都包含有用的信息。 第一列显示截至当月初的账户信息,即以百分比和存款币种显示总体结果。 第二列显示设置中指定日期的风险。 第三列显示当前账户情况。 如果一天超过规定的风险或超过订单数量,顾问将关闭所有订单,并且不允许开设新订单,从而保护交易者免受“情绪交易”的影响。 “风险管理器”允许您根据以下参数控制交易: 每日损失限额 余额损失限额 交易数量限制 单一方向交易数量限制(网格保护) 连续亏损交易后被迫止损 连续两天亏损后,交易将被锁定一天 风险管理系统允许交易者: 保持每日利润 在线查看您的交易统计数据 理顺交易纪律,显着提高盈利能力(摆脱“倾斜”和“网格”) 查看当前资金并考虑经纪佣金 为了使风险经理能够满负荷工作,它必须位于远程 VPS 或任何其他偏远的地方,在情绪爆发时交易者无法快速到达并干扰
作者的更多信息
Reversal Bars
Igor Semyonov
Description The indicator determines the appearance of the bars that signal of a reversal of current local moods and plays a beep. It also paints these bars in accordance with the bullish and/or bearish priority. You can select the color for bullish and bearish moods. Inputs Sound_Play - a flag that allows the sound notification. Use Detection of the reversal bar can be a signal to perform appropriate trading activities.  The indicator can be used for manual or automated trading in an Expert A
Main Candles
Igor Semyonov
The indicator detects the following types of Japanese candlesticks: Doji, Hammer and/or Hanging Man, Shooting Star and/or Inverted Hammer, Spinning Top, Maribozu. The indicator is intended for manual and/or automated trading within an Expert Advisor. There is a possibility to choose colors for bullish and bearish candlesticks. For automated trading, use any indicator buffer of the double type: 0, 1, 2 or 3, whose value is not zero!
The indicator is intended for detecting big (long) and/or small (short) candlesticks. There is possibility of coloring the bullish and bearish candlesticks. The indicator can be used for manual and/or automated trading within an Expert Advisor. The indicator data that can be used for automated trading can be taken from one of four buffers of the double type: 0, 1, 2 or 3. Values must not be equal to zero. 
The indicator of DeMark fractals. The indicator can be drawn on the basis of price data and on the basis of a moving average. There is a possibility to color the up and down fractals. The indicator can be used for manual and for automated trading within an Expert Advisor. For automated trading, use any indicator buffer of the double type: 0 - up fractals, 1 - down fractals! Values of the buffers must not be equal to zero.  A moving average is drawn on the basis of input parameters: Calc_Method 
Stochastic Global
Igor Semyonov
4 (1)
Description A universal colored indicator Stochastic. The rising and falling lines and the levels of the indicator can be colored.   The indicator can be calculated as the standard one on the basis of a price or as a derivative on the basis of the following nineteen other indicators included in the standard package of the MetaTrader 4 terminal: AD - an indicator of accumulation and distribution of volume. OBV - On Balance Volume. Volume - tick volume indicator. AC - indicator of acceleration. AO
Description A universal colored indicator MACD Histo. The rising and falling of the indicator histogram can be colored.   The indicator can be calculated as the standard one on the basis of a price or as a derivative on the basis of the following twelve other indicators included in the standard package of the MetaTrader 4 terminal: AD - an indicator of accumulation and distribution of volume. OBV - On Balance Volume. Volume - tick volume indicator. Force - Force Index indicator. MFI - Money Flow
Description A colored universal indicator MACD Line (MA convergence-divergence indicator, shown as a histogram). The rising and falling of the indicator histogram can be colored. The indicator can be calculated as the standard one on the basis of a price or as a derivative on the basis of the following twelve other indicators included in the standard package of the MetaTrader 4 terminal: AD - an indicator of accumulation and distribution of volume. OBV - On Balance Volume. Volume - tick volume i
RSI Global
Igor Semyonov
Description A universal indicator RSI together with moving averages based on it. Depending on the need, moving averages can be disabled. You can color the indicator lines and levels: lines of RSI, moving average lines and thresholds of overbought and oversold levels.   The indicator can be calculated as the standard one on the basis of a price or as a derivative on the basis of the following eighteen other indicators included in the standard package of the MT4 terminal: AD - an indicator of accu
CCI Global
Igor Semyonov
5 (1)
Description A universal indicator CCI together with moving averages based on it. Depending on the need, moving averages can be disabled. You can color the indicator lines and levels: lines of CCI, moving average lines and thresholds of overbought and oversold levels.   The indicator can be calculated as the standard one on the basis of a price or as a derivative on the basis of the following eighteen other indicators included in the standard package of the MetaTrader 4 terminal: AD - an indicato
Description A multi-purpose multi-colored/multi-symbol indicator, which is a set of standard tools from the MetaTrader 4 terminal. The difference is that below the basic price chart it allows to calculate and build in a separate window any of the twenty indicators in a colored form, painting bulls and bears in different colors, for any financial instrument in accordance with the list below:  AD - an indicator of accumulation and distribution of volume. OBV - On Balance Volume. Force - Force Inde
AO Global
Igor Semyonov
Description A colored universal indicator AO (Awesome Oscillator). The rising and falling of the indicator histogram can be colored.   The indicator can be calculated as the standard one or as a derivative on the basis of the following eleven other indicators included in the standard package of the MetaTrader 4 terminal: AD - an indicator of accumulation and distribution of volume. OBV - On Balance Volume. Volume - tick volume indicator. Force - Force Index indicator. MFI - Money Flow Index. ATR
Description A colored universal indicator MACD Classic (MA convergence-divergence indicator) that combines two indicators: MACD Line and MACD Histo. The rising and falling lines, the signal line and the indicator histogram can be colored. The indicator can be calculated as the standard one on the basis of a price or as a derivative on the basis of the following twelve other indicators included in the standard package of the MetaTrader 4 terminal: AD - an indicator of accumulation and distributio
Description The universal colored multicurrency/multisymbol indicator MACD Classic, consisting of two MACD indicators: MACD Line and MACD Histo. The indicator may be used with any broker, irrespective of the name of the financial instrument since it is necessary to manually enter the name as an input parameter. If you enter a non-existent or incorrect name of a financial instrument, you will receive an error message that this financial instrument is unknown (does not exist). Inputs Currency_Nam
Description A colored universal indicator/oscillator based on crossing moving averages. The rising and falling lines of the indicator histogram can be colored. The combined use of the line and the histogram increases the level of the analysis when making a decision to open or close deals. The indicator can be calculated as the standard Price Oscillator or as a derivative on the basis of the following eleven other indicators included in the standard package of the MetaTrader 4 terminal: AD - an i
Description A universal colored multicurrency/multi-symbol indicator RAVI. Was proposed by T. Chand as a trend indicator. RAVI means Range Action Verification Index. The indicator may be used with any broker, irrespective of the name of the financial instrument since it is necessary to manually enter the name as an input parameter. If you enter a non-existent or incorrect name of a financial instrument, you will receive an error message that this financial instrument is unknown (does not exist).
Description A colored multicurrency/multisymbol oscillator of the market mood. The oscillator is designed for detecting the continuation or change of the market mood prior to its occurrence. An excellent example is the screenshots that show all the features of the oscillator. The oscillator may be used with any broker, irrespective of the name of the financial instrument since it is necessary to manually enter the name as an input parameter. If you enter a non-existent or incorrect name of a fin
Inside Bar
Igor Semyonov
Description The indicator determines the appearance of internal bars on the chart, and paints them in accordance with the bullish and/or bearish mood. The indicator can notify of the appearance of a formed internal bar by playing a beep, as well as display the time remaining until the end of the formation of the current bar in the format of <d:h:m:s, where: < means the current bar. d - days. h - hours. m - minutes. s - seconds. The bullish and bearish mood can be colored. Inputs Sound_Play - a
Description The indicator determines the appearance of bars that notify of the reversal of the current trend, and paints them in accordance with the bullish and/or bearish mood. The indicator can notify of the appearance of a formed reversal bar by playing a beep, as well as display the time remaining until the end of the formation of the current bar in the format of <d:h:m:s, where: < means the current bar. d - days. h - hours. m - minutes. s - seconds. You can select the color for bullish and
Description A universal colored multicurrency/multi-symbol indicator of moving averages: Moving Average, Double Moving Average, Triple Moving Average . The indicator is drawn in a separate window, so below the main trading chart a user can see the development of another financial instrument. It is very useful when considering the combined values of various moving averages for different financial instruments below the main trading chart.  The indicator may be used with any broker, irrespective of
Description A universal colored indicator of moving averages: Moving Average, Double Moving Average, Triple Moving Average . The indicator provides various opportunities for the analysis of prices based on different ways of constructing moving averages in the window of the main financial instrument. You can color bullish and bearish moods. Inputs MA_Type - type of multiplicity: Moving Average. Double Moving Average. Triple Moving Average. MA_Period - the MA period. MA_Method - the averaging met
Description A colored universal multicurrency/multi-symbol indicator Bollinger Bands to be drawn in a separate window below the main financial instrument. The rising and falling line of the main indicator and Bollinger Bands can be colored. The indicator can be calculated based on one of the eleven basic indicators included in the standard package of the MetaTrader 4 terminal: AD - an indicator of accumulation and distribution of volume. OBV - On Balance Volume. Force - Force Index indicator. MF
Description A colored universal multicurrency/multi-symbol indicator Channel to be drawn in a separate window below the main financial instrument. The indicator uses the calculation method of the Price Channel indicator. The rising and falling line of the main indicator and the Channel lines can be colored. The indicator can be calculated based on one of the eleven basic indicators included in the standard package of the MetaTrader 4 terminal: AD - an indicator of accumulation and distribution o
Keltner Channel
Igor Semyonov
5 (1)
Description Keltner's colored channel indicator,also called STARC band, drawn in the main chart window. The indicator uses the calculation technique of the three drawing options: basic, improved and modified . The first two were proposed by Keltner, the third one - by a successful trader L. Rakshe. You can also search for your own best parameters of the indicator. The upper, middle and lower bands can be colored. The indicator includes the basic analytical tool of the market moods by Keltner. Th
ZigZag Global
Igor Semyonov
Description A colored universal multicurrency/multi-symbol indicator ZigZag to be drawn in a separate window below the main financial instrument. The indicator may be used with any broker, irrespective of the name of the financial instrument since it is necessary to manually enter the name as an input parameter. If you enter a non-existent or incorrect name of a financial instrument, you will receive an error message that this financial instrument is unknown (does not exist).  The indicator can
Description A colored channel indicator Price Channel to be drawn on the main chart of a financial symbol. It can color bullish and bearish moods based on the middle line of the indicator, as well as change the color of the upper and lower lines of the channel. Purpose The indicator can be used for manual or automated trading in an Expert Advisor. Values of indicator buffer of the double type can be used for automated trading:  The middle line of the indicator - buffer 4. The upper line of the
Description Candlesticks is a colored multicurrency/multy-symbol indicator. It shows a financial instrument as a candlestick chart in a separate window below the chart of the main financial symbo. The indicator may be used with any broker, irrespective of the name of the financial instrument since it is necessary to manually enter the name as an input parameter. If you enter a non-existent or incorrect name of a financial instrument, you will receive an error message that this financial instrume
Description Candlestick Tools  is a colored multicurrency/multy-symbol indicator. It shows one of four standard indicators as a candlestick chart in a separate window below the chart of the main financial symbol. The indicator is calculated based on one of two indicators included in the standard package of the МetaТrader 4 terminal: CCI - Commodity Channel Index. RSI - Relative Strength Index. The default indicator is Commodity Channel Index. The indicator may be used with any broker, irrespecti
Pivot Pro
Igor Semyonov
Description Pivot Pro  is a universal color indicator of the  Pivot Points  levels systems. You can select one of its three versions:  Standard   Old , Standard New  and  Fibo . The system will automatically calculate the  Pivot Point  on the basis of market data for the previous day ( PERIOD_D1 ) and the system of support and resistance levels, three in each. It can also display price tags for each level. You can color the indicator lines. Only a method of calculation of the third level of supp
Price Levels
Igor Semyonov
Description The indicator is intended for labeling the chart using horizontal levels and/or half-round prices. The indicator works on any financial instrument regardless of the name and the number of digits. A user can choose colors for the indicator lines. Input Parameters Calc_Method - method of calculation of the lines: levels of round prices. levels of half-round prices. Digits_Accepted - flag for calculating the levels according to number of decimal places in the quotes of a financial inst
Description A colored universal multicurrency/multi-symbol indicator MACD Line Smart (the indicator moving average convergence divergence is displayed as a histogram) based on double or triple moving average .  Comparing to the standard MACD this indicator is more sensitive to what allows generating advance signals. he indicator may be used with any broker, irrespective of the name of the financial instrument since it is necessary to manually enter the name as an input parameter. If you enter a
筛选:
无评论
回复评论