Round Numbers Levels MT5
- 指标
- 版本: 1.2
- 更新: 24 十月 2021
- 激活: 5

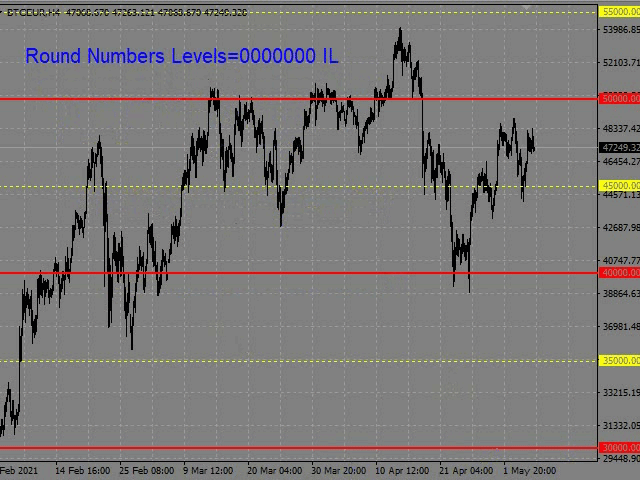
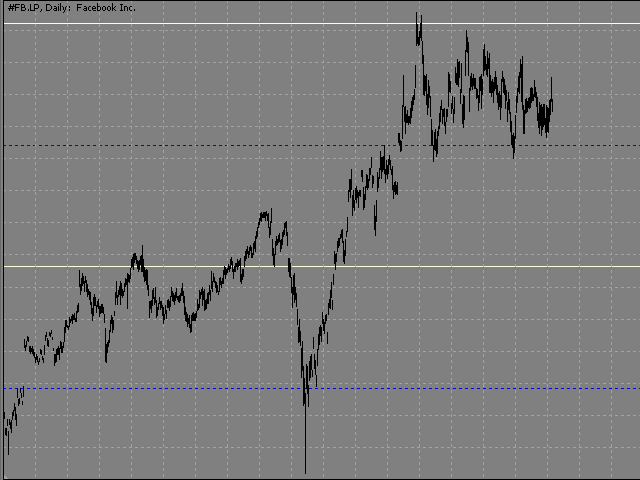
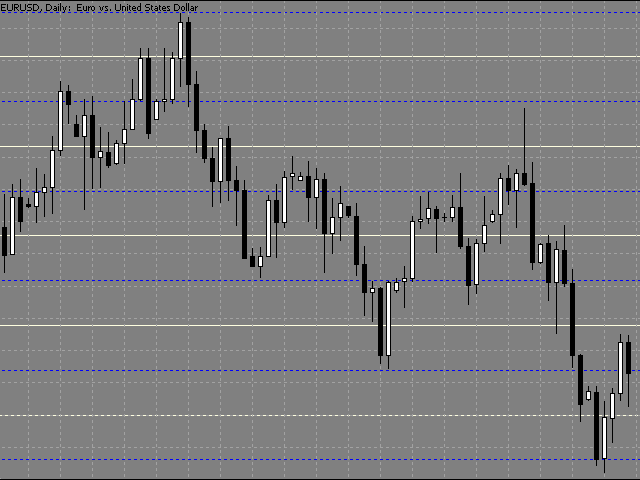
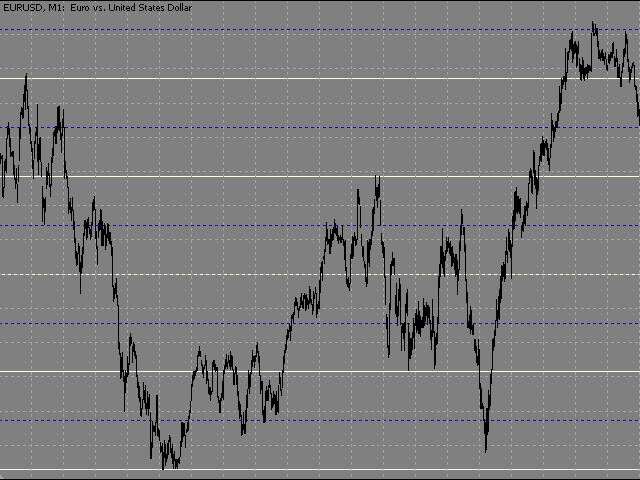
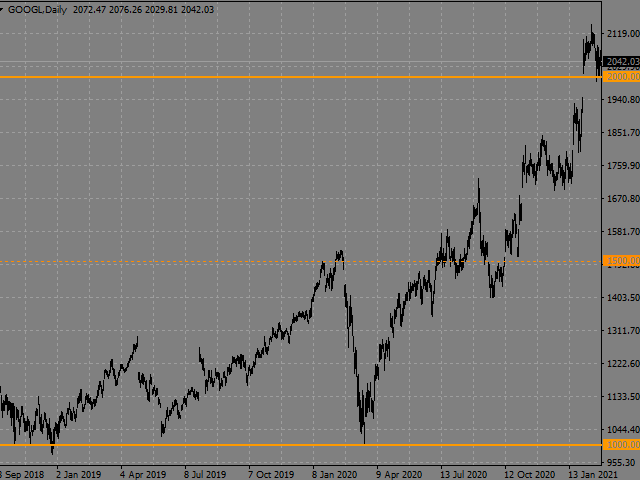
The indicator builds "psychological levels": levels of round numbers and intermediate levels of round numbers.
Round numbers play an important role in forming support and resistance levels. There is a pattern in which the decline or growth of the price can stop at round numbers.
The level whose price ends at 0 is the level of a round number of the first order.
Intermediate level, this is the level between two round levels, for example, between 10 and 20 this is level 15.
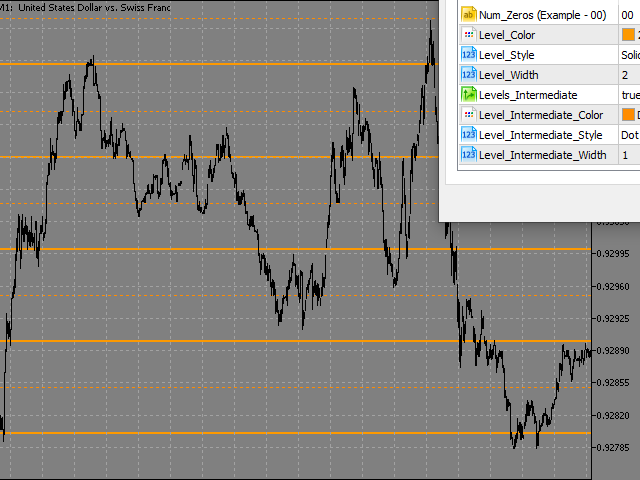
In the "Num_Zeros" setting, you can choose how many zeros to display the levels with.
There is a "text button" on the screen for quick adjustment of levels.
This button allows you to change the number of zeros in the levels, hide / show intermediate levels.
The indicator does not redraw.
In the indicator settings, you can change the color, type, and thickness of the line separately for round levels and separately for intermediate levels.