Multi Indicator Scanner

5

Multi Indicators Scanner

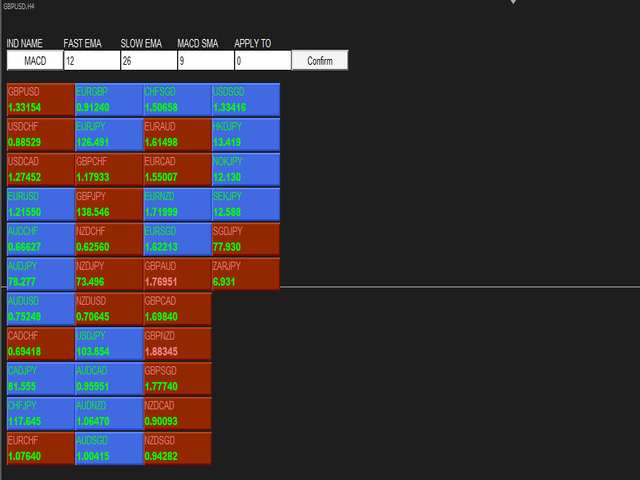
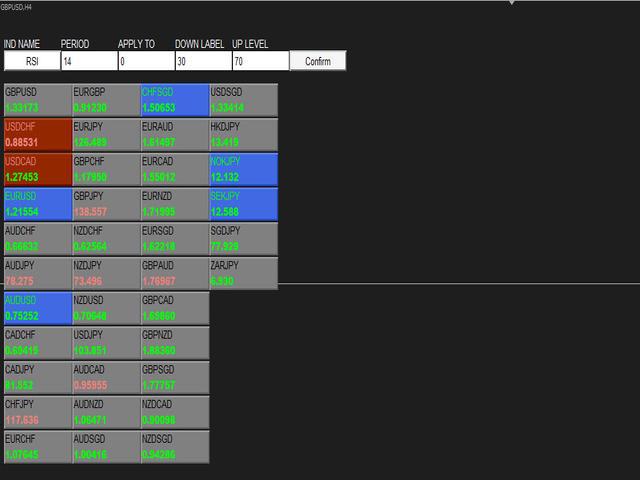
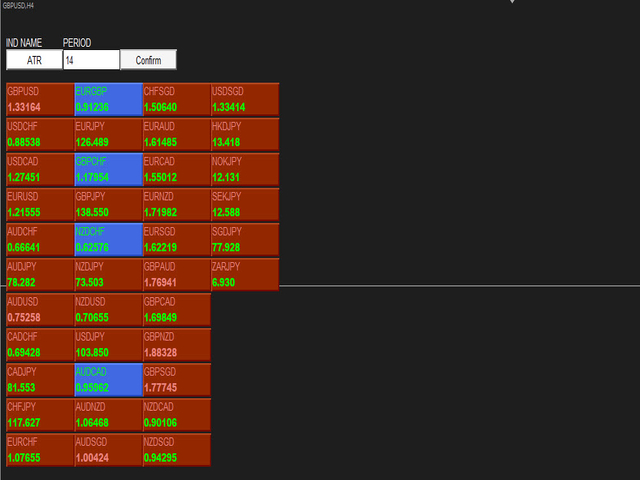
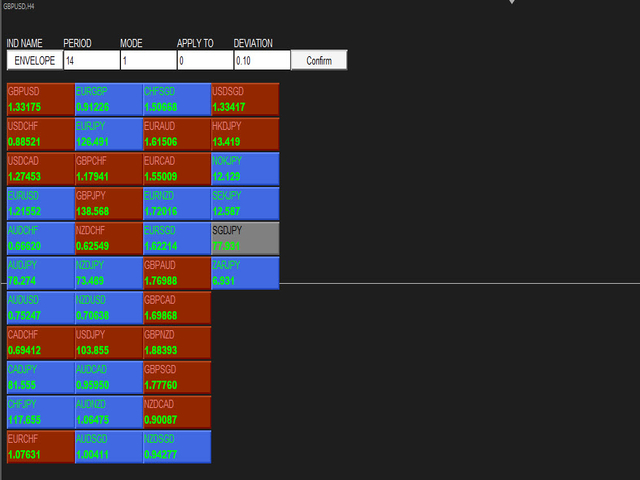
Indicator Scan  ADX ,Moving Average ,ENVELOPE ,SAR , MACD ,RSI  and ATR . We can change all input parameters in chart window. scanner works Multiple Time Frame we can change Timeframe .  Symbol button based on Trend color , we can click button and open chart .  We can also save templates in input.  

Default settings

Time Frame   1Hour

Templates Name  Default

Auto Arrange Chart  true

评分 1
tabban21
166
tabban21 2022.05.02 22:33 
 

Great value for money> So many signal indicators scanning the market for this affordable price ! Another good feature is you double click on the currency pair and it opens the chart for you, which is a small bonus. There are no push alerts to phone but hopefully could be in next iteration. I am pleased with the product. As with all these scanners there are delays in the signals depending on the time zone you are in so need to tweak slightly to get the best out of it but still very handy. Very customisable to time frame and indicator values

推荐产品
本指标是实践实战交易完善的波浪自动分析的指标 !  案例... 注: 波浪分级用西方叫法不习惯,因受到缠论(缠中说禅)命名方式习惯的影响,我是将基础波浪命名为 笔 ,将二级波段命名为 段 ,同时具有趋势方向的段命名为 主趋段 (以后笔记中都是这种命名方式,先告知大家),但是算法上和缠论关系不大切勿混淆.反映的是本人分析盘面总结的 千变万化纷繁复杂的运行规律 . 对波段进行了标准化定义,不再是不同人不同的浪  ,   对人为干扰的画法进行了排除,在严格分析进场起到了关键的作用 . 使用这个指标,等于将交易界面提升美感,抛弃最原始的K线交易带你进入新的交易层次.如果不是为了交易,在宣传上也将使客户观感提升层次. 指标内容: 1. 基础波浪 (笔) : 首先我们找出了价格波动过程中的基础波动拐点,当然他的有序性低,为下一步的计算提供基础. 2. 二级波段( 段 ) :在基础波浪的基础上,通过算法分析得到层级更明显的二级波段,二级波段为波浪提供了分析基础 3. 波浪( 浪 ): 有着更清晰的趋势,更清晰直观的方向.分析一个波浪是否延续,需要看二级波段的形态,分析二级的构成,可以得出波浪后
TDSequential Scanner
George Njau Ngugi
To access the TD sequential Scanner for MT5, please check https://www.mql5.com/en/market/product/123369?source=Site +Market+My+Products+Page. One of the MT5 versions includes additional timeframes such as M1, M2, M3,H2,H6,H8 and so on.( https://www.mql5.com/en/market/product/123367?source=Site +Market+My+Products+Page) TD Sequential Scanner: An Overview The TD Sequential scanner is a powerful technical analysis tool designed to identify potential price exhaustion points and trend reversals in fi
Koala Trend Pro MT4
Ashkan Hazegh Nikrou
考拉趋势线介绍: 我创建了这个指标来帮助交易者更好地发现趋势。该指标可以显示当前趋势线。 如您所知,趋势线必须在两个最高或最低点之间。 因此,基本逻辑是找到最高和最低点。 该指示器查找历史上所有的最高和最低点,并用红色和蓝色点显示它们。 这些最高和最低点是根据深度值计算的。深度值是可调的,可以由用户更改。 深度是什么意思? 如果深度为10,则表示任何最高的烛台应该是10根蜡烛之间的最高蜡烛。在上一个第五蜡烛台和下一个第五蜡烛台之间应该有最高的蜡烛台。 如果深度为10,则表示它周围的10点之间的最低蜡烛应该是最低蜡烛,而5和5之间的最低蜡烛应该是下一根蜡烛。 “连接到XTH”选项如何工作? 该指标需要2个点才能绘制下降趋势线。他朝相反的方向看,找到第二点。您可以使用此参数对第二点进行操作。可以是第一,第二,第三,第四或第n个最大值 “连接到最低XTH”选项如何工作? 该指标需要2个点才能绘制看涨趋势线。他朝相反的方向看,找到第二点。您可以使用此参数影响第二点。可以是最低的第1,第2,第3,第4或第n个下限 您可以在此处下载该产品的免费无限版本: https://www.mql5.com
The Best Choice compra y venta
Sandro Israel Hernandez Zamora
¿Has escuchado decir que la tendencia es tu amiga? pues nada es mas cierto en el mundo del trading. Este indicador analiza las tendencias y su fuerza para que puedas aprovecharlas y utilizamos un conjunto de indicadores como RSI, %W, MACD y EMAS para analizar el mercado y sus movimientos, por lo que podrás mantener tu gráfico limpio sabiendo que todos estos indicadores los tienes en uno solo. Este, como cualquier indicador, no representa una certeza de compra o venta definitiva, por lo siempre r
R Scalper Arrows 指标为任何货币对提供易于阅读的买卖信号箭头。 它适用于短期趋势预测: 向上箭头表示该货币对处于短期上升趋势中。 向下箭头表示该货币对处于短期下降趋势中。 对于多头交易,将止损设在点下方。 对于空头交易,在点上方设置止损。 提示 您可以将此指标与长期趋势跟踪外汇指标(例如简单移动平均线或指数移动平均线)一起使用。 仅按照趋势跟踪指标所示的趋势方向进行交易。 基本交易信号 R Scalper Arrows 指标信号很容易解释,看起来像这样: 买入交易:当图表上出现紫色向上箭头时,开启买入交易。 卖出交易:当图表上出现紫色向下箭头时,开启卖出交易。 交易退出:根据相反的信号退出交易,或使用您自己的交易退出方法。 特征 货币对:任何 平台:MetaTrader 4 类型:图表 自定义选项:颜色、宽度和样式。 时间范围:1 分钟、5 分钟、15 分钟、30 分钟、1 小时、4 小时、1 天、1 周、1 个月。 类型:短期趋势预测
MT Scanner
Niravkumar Maganbhai Patel
4 (2)
This indicator helps you to Scan symbols which are in the Market Watch Window  and filter out trends with alerts. It works based on the effective indicator "SUPERTREND" which is used by many traders for trading: When box color changes to " Green " or " Red " color, it indicates you for trend change for long and short entry. And also you will get alerted on screen. When it changes to " Green ", it indicates you that trend is going upwards, and you can take the long entry. If the color changes to
FREE
The indicator allows you to trade binary options. The recommended time frame is М1 and the expiration time is 1,2,3 minutes. The indicator suitable for auto and manual trading. A possible signal is specified as a arrows above/under a candle. You should wait until the candle closes! Arrows are not re-painted Trade sessions: TOKYO section (Half-end) Currency pairs: USD/JPY Working time frame: M1 Expiration time: 1,2,3 minutes. The indicator also shows good results when using the martingale strateg
FREE
“动态剥头皮震荡指标”是一款高级自定义加密货币外汇指标,适用于 MT4 平台,高效交易! - 新一代震荡指标 - 参见图片了解如何使用。 - 动态剥头皮震荡指标具有自适应超卖/超买区域。 - 震荡指标是一款辅助工具,可从动态超卖/超买区域找到准确的入场点。 - 超卖值:低于绿线,超买值:高于橙线。 - 该指标也非常适合与价格行为模式结合使用。 - 它比标准震荡指标更精准。适用时间范围:30 分钟、1 小时、4 小时、1 天、1 周。 - 提供 PC 和移动端警报。 ................................................................................................................. 点击这里查看高质量的交易机器人和指标! 本产品为原创,仅在 MQL5 网站上提供。
LordAutoFibonnaci
Igor Pereira Calil
5 (2)
Lord Auto Fibonnaci is a free indicator for Meta Trader, in order to show the most famous chart in the financial market known as "Fibonnaci". As we can see in the images below, the fibonnaci table will automatically analyze the graph for you, with trend factors through percentage, almost infallible use, you can always work when the percentage is low or high, start shopping and sales on time, great for analyzing entries! In the images below we can see an example in gold in H4, where we are at
FREE
Strong Volume Trend
Muhammed Emin Ugur
The Strong Volume Trend  MT4 indicator is a powerful tool designed to help traders identify and capitalize on significant volume trends in the financial markets. With its advanced algorithm, this indicator accurately detects the strength and direction of volume movements, allowing traders to make informed trading decisions. Features: Volume Strength Analysis: The indicator analyzes the volume data and identifies strong volume trends, helping traders spot potential market reversals, breakouts, or
Binary Option Signal
Yaroslav Varankin
Indicator for binary options arrow is easy to use and does not require configuration works on all currency pairs, cryptocurrencies buy signal blue up arrow sell signal red down arrow tips do not trade during news and 15-30 minutes before their release, as the market is too volatile and there is a lot of noise it is worth entering trades one or two candles from the current period (recommended for 1 candle) timeframe up to m 15 recommended money management fixed lot or fixed percentage of the depo
Read detailed description and extra indicators: https://www.mql5.com/en/blogs/post/758622 This Supertrend dashboard is a multi-currency and multi-timeframe dash which gives signals whenever supertrend changes it's trend direction. Please note, that this is not a full trading system. It will help you get initial Supertrend signals and higher timeframe trend alignments. And it’s to be used with your own Supertrend Strategies. Features: 1- Select one of In-Built Supertrend Indicators: xSupertren
No Repaint Bext
Andrey Kozak
1 (1)
No Repaint Bext 是一个完整的交易系统。它指示何时开仓、何时平仓以及交易方向。每当出现绿色箭头时,您需要开设买入交易。当出现红色箭头时,关闭所有买入交易。相反,每当出现红色箭头时,开设卖出交易,并在出现绿色箭头时关闭所有卖出交易。交易时使用 M5 时间框架,可以在任何货币对上进行交易。 该指标不会重绘,几乎没有延迟,唯一的自然条件是等待 K 线收盘。它使用 RSI 过滤器和两个经典的反转形态(吞没、Pin Bar),这使得几乎可以在反转发生的瞬间识别出来。 如何使用该指标进行高效交易? 可用于任何货币对(我们测试了 GBPUSD 和 EURUSD) 时间框架:M5 初始资金:500 美元起 交易手数:0.01 每当出现绿色箭头时,开设买入交易。当出现红色箭头时,关闭所有买入交易。 每当出现红色箭头时,开设卖出交易。当出现绿色箭头时,关闭所有卖出交易。 指标参数设置: RSI_Period - 默认值:14 说明:RSI(相对强弱指数)用于过滤信号。例如,当 RSI_Period 设为 14 时,RSI 计算过去 14 根 K 线的平均值。周期越长,RSI 趋势越平滑(减少
Moving Pivot Average    The pivot indicator compares the selected period with its counterpart from the previous period. The indicator uses very flexible algorithm for pivot value calculating. It allows you to allocate in days a certain time intervals (custom bars) and calculate the average pivot value based on High, Low and Close prices of these bars. How many custom bars will be taken into account is determined by the "Days" setting. The pivot line can be considered an average trend line and us
A useful scanner/dashboard that shows the RSI values for multiple symbols and time-frames. It can be easily hidden/displayed with a simple click on the scanner man top left of the dashboard. You can input upper and lower RSI values and the colours can be set to show when above/below these values. The default values are 70 and 30. There are also input colours for when the RSI is above or below 50 (but not exceeding the upper/lower levels Symbols and time-frames are input separated by commas.
Signal Arrows is an indicator that generates trade arrows. It generates trade arrows with its own algorithm. These arrows give buying and selling signals.  Can be used in all pairs. Sends a signal to the user with the alert feature. The indicator certainly does not repaint. Trade rules Enter the signal when the buy signal arrives. In order to exit from the transaction, an opposite signal must be received. It is absolutely necessary to close the operation when an opposite signal is received. The
Smart FVG indicator MT4
Ahmad Kazbar
4.67 (3)
Smart FVG 指标 MT4 – MetaTrader 4 高级公平价值缺口检测 Smart FVG 指标为 MetaTrader 4 提供专业的公平价值缺口(Fair Value Gap,FVG)检测、监控和告警功能,所有信息都直接显示在图表上。它将基于 ATR 的过滤与结构感知逻辑相结合,帮助你去除噪音、适应流动性,并只保留最关键的不平衡区域,从而做出更加精确的交易决策。 主要优势 精准的 FVG 检测:识别真正的市场低效,而不仅仅是简单的 K 线价格跳空。 基于 ATR 的自适应精度:根据不同市场与周期自动过滤低质量信号。 实时有效性跟踪:当价格填补或突破缺口时,相关区域会被自动延伸、调整或删除。 高度可视化与自定义:可根据任何模板自定义颜色、线型和填充样式。 实用告警功能:对新出现、被填补或被突破的 FVG 提供实时通知。 性能优化:轻量化设计,适合多品种、多周期同时扫描。 工作原理 将指标加载到任意 MT4 品种与时间周期图表上。 算法会扫描历史与实时 K 线,标出当前有效的 FVG 区域。 ATR 逻辑会根据当前波动率和流动性动态调整检测条件。 当价格完全回补缺口
FREE
BinaryMartini
Abdulkarim Karazon
индикатор для бинарной торговли, основанный на пересечении 3MA с macd, он дает сигналы на покупку и продажу при открытии бара и не перерисовывается и не перерисовывается Индикатор не ориентирован на высокий процент выигрышей, поскольку он создан для торговли по мартингейлу, индикатор ориентирован на наименьшее количество проигрышных сигналов подряд. Стратегия: Минимальный депозит 1000 юнит, торговлю начинаем с 1 юнит (размер сделки 1 юнит на каждые 1000 капитала) мы удваиваем размер сделки по сл
KT Aroon MT4
KEENBASE SOFTWARE SOLUTIONS
KT Aroon振荡器是对最初由Tushar Chande在1995年开发的原始Aroon振荡器的改进版本。它通过测量当前最高价和最低价之间的时间间隔,并根据该推断来计算市场趋势的方向和强度。  它基于这样一个理念:在上升趋势中,价格会连续创出新高;而在下降趋势中,则会不断创出新低。 买入信号: Aroon向上线穿越Aroon向下线时发出买入信号。 卖出信号: Aroon向下线穿越Aroon向上线时发出卖出信号。  功能特点 配有上下箭头,可在价格图表上标出Aroon信号。 有效展示市场趋势方向。 图表清晰简洁,没有任何杂乱。 支持所有Metatrader警报类型。 输入参数 周期: 用于计算Aroon Up和Aroon Down线的周期。 显示上下箭头: 设为True时,将在图表上显示每一个新信号的箭头。 警报设置: 可配置弹窗、声音、手机通知和邮件等多种警报方式。 关于Aroon的更多信息 Aroon振荡器与其他常见振荡指标不同,因为它结合了时间与资产价格。在日线图中,你可以这样理解它: Aroon Up: 表示自25日最高价以来过去的天数。 Aroon Down: 表示自2
EARLY REMINDER: The Starting price is 65 price will rise soon up to 365$ and then 750$ after first 10 copies of sales. Grab this offer now! Introduction Hello, traders! Welcome to the demonstration of the Forex Beast Indicator , a comprehensive tool designed to assist aspiring traders in navigating the complexities of the forex market. This indicator incorporates seven essential components to provide a well-rounded trading experience: Moving Averages Colored Zones Support and Resistance Levels
Great Safe Signal
Muhammed Emin Ugur
Are you in search of a reliable tool to enhance your trading experience on MetaTrader 4? Look no further! "Great Safe Signal" is here to elevate your trading strategy and provide you with invaluable insights for making informed decisions. Key Features: Precision Analysis: "Great Safe Signal" employs advanced algorithms to analyze market trends and price movements with pinpoint accuracy. This ensures that you have the most precise information at your fingertips. User-Friendly Interface: We unders
通过 Nadaraya Watson Envelope MT4 解锁您的交易策略潜力,这是一种创新指标,旨在为交易者提供精确的趋势分析和动态支撑与阻力水平。非常适合 forex、商品和加密货币交易者,这个工具增强了决策能力和识别市场反转及趋势延续的准确性。 Nadaraya Watson Envelope MT4 的突出之处在于利用先进的高斯核平滑技术创建自适应包络带,以响应市场波动。这使得交易者能够自信地捕捉关键价格波动,无论是快速获利的剥头皮交易,还是长时间持有的仓位。 MQL 产品安装指南 | 在 MT4 上更新已购买的 MQL 产品 | 常见故障排除指南 | 指标设置 / 指南 主要特点 缓冲区集成:将指标值暴露为可访问的缓冲区,用于基于信号的自动交易,使 Expert Advisor 能够有效利用数据。 快速且可回测:基于 MetaTrader 的原生 OnCalculate() 引擎进行快速计算,确保与策略测试器兼容以进行历史分析。 弹出警报:在信号事件上触发 MetaTrader 警报弹出窗口,确保您不会错过任何交易机会。 推送通知:实时推送通知直接发送到您的 MetaT
FREE
Crypto_Forex MT4 版“趋势入场柱状图”指标,无需重绘。 - 趋势入场柱状图指标可用于在 Entry_bar 出现后搜索趋势方向的入场信号。 - 该指标的独特之处在于它同时考虑价格和交易量进行计算。 - 趋势入场柱状图有两种颜色:红色表示看跌趋势,蓝色表示看涨趋势。 - 一旦趋势稳定(至少 10 个连续的相同颜色柱状图),请等待 Entry_bar。 - 入场信号是柱状图中第一列颜色与第一列相反,第二列颜色为初始趋势颜色(参见图片)。 - 使用短线目标 - 根据当前趋势,选择图表上最接近的高点/低点。 - 指标内置移动端和 PC 端警报。 指标使用方法: - 买入信号:稳定的看涨趋势(蓝色柱状图柱状图)+ 柱状图上的 1 个红色柱状图 + 1 个蓝色柱状图(在此开多头仓位)。 - 卖出信号:持续看跌趋势(红色柱状图)+ 1 条蓝色柱状图 + 1 条红色柱状图(在此开空头仓位)。 点击这里查看高质量的交易机器人和指标! 这是仅在 MQL5 网站上提供的原创产品。
Range Filtered AlgoAlpha 是一款技术分析工具,通过分析市场波动性帮助识别潜在交易机会。该指标是AlgoAlpha原创TradingView指标的MetaTrader改编版,融合多种分析方法提供直观的市场评估。 技术特点 采用卡尔曼滤波(Kalman Filtering)平滑价格数据 结合基于ATR的波动带(ATR-based Bands)衡量市场波动性 融入超级趋势(Supertrend)元素进行趋势分析 通过彩色K线(Candles)和标记(Markers)提供可视化信号 支持可配置的警报选项(Configurable Alerts) 功能 该指标处理市场数据实现以下功能: 使用ATR(平均真实波幅)计算波动范围 应用滤波技术(Filtering Techniques)减少市场噪音 通过可视化元素(Visual Elements)显示潜在趋势方向 适用场景 适用于基于波动性的交易策略(Volatility-based Trading) 可作为多种交易品种技术分析(Technical Analysis)的辅助工具 提供市场条件的直观参考(Visual Refer
PZ Mean Reversion MT4
PZ TRADING SLU
3 (4)
采用专业和量化方法进行均值回归交易的独特指标。它利用了价格以可预测和可衡量的方式转移并返回均值这一事实,这允许明确的进入和退出规则大大优于非量化交易策略。 [ Installation Guide | Update Guide | Troubleshooting | FAQ | All Products ] 清晰的交易信号 非常容易交易 可定制的颜色和尺寸 实现性能统计 优于大多数交易策略 显示合适的止损和止盈水平 它实现了电子邮件/声音/视觉警报 这个怎么运作 该指标从更高的时间范围测量完全可定制的移动平均线的标准偏差,并使用趋势跟踪方法精确地找到交易。交易是通过深入当前图表的价格行为发现的,并在价格返回到平均价格区间时关闭,根据您选择的更高时间范围计算。由于其编码方式,该指标将远离高波动性和强劲趋势市场,并且仅在可预测的情况下进行交易,在可接受的波动性与方向性比率范围内,回归均值是可行的。 指标剖析 绿线是更高时间范围内的移动平均线(也就是平均值) 虚线区域是移动平均线周围的典型价格区间 蓝线是看涨交易的突破价格 红线是看跌交易的突破价格 交易是针对均值进行的,并在典型的价格
Super Ichi
Sinan Durkan
What is the Super Ichi Indicator? Super Ichi is an advanced combination of Ichimoku Kinko Hyo and SuperTrend indicators. This powerful technical analysis tool is designed to identify market trends and generate trading signals. What Does It Do? Dual-Level Trend Analysis : Uses customized versions of Tenkan-sen and Kijun-sen lines Automatic Signal Generation : Displays visual markers (arrows) at crossover points Real-Time Alert System : Provides audio and visual alerts when new signals occur Dynam
FREE
The trader uses the Trend for Neuro indicator to determine the market situation. This is a trending algorithm that is convenient to download, install and use. The algorithm with acceptable accuracy generates input signals and output levels. Strategy for trend trading, filtering and all the necessary functions built into one tool! By launching the indicator, the user will see only two types of arrows that can change color to blue during an uptrend, to red during a downtrend there is no uncertaint
MTF Stochastic and RSI
Georgiy Gazaryan
5 (2)
A simple but effective helper that will allow you to track both global and local market trends. The indicator combines the work of two oscillators: Stochastic and RSI. Both indicators can be set to any timeframe. Advantages of Use Multitimeframe - you can adjust both indicators to the desired timeframes. To obtain the entry points, you can use the Elder's triple screen system. Highly customizable - you can configure not only the parameters of the indicators, but also their appearance (color and
FREE
Mostafa System
Zhong Jie Wang
重力拋物線系統 (Mostafa System) 輕鬆判別趨勢走向   提示完美進場點位   交易輔助清單   順勢交易系統 系統介紹: 重力拋物線系統,使用多項式非參數回歸方法計算拋物線重心及趨勢方向,而價格有非常高的機率會按照拋物線的趨勢方向前進,在依個上升趨勢拋物線中,綠線將會是我們第一個進場點,橘線會是第二個進場點,止損位置僅需要放置在橘線下方。此系統可大幅增加趨勢交易的勝率,交易者可清楚分辨當前交易方向,以及系統建議的進場位置。 影片教學: UncleForex 外匯大叔 ( https://youtu.be/G4Xahx2Mivg ) 今天大叔跟大家分享一套由歐洲的分析師,同時也是交易冠軍的 Mostafa Belkhayate 大師所創建的重力拋物線系統策略。 在交易的道路上我們時常聽到"順勢而為" ,按著趨勢方向去交易,然而大部分的交易者很難了解當下的盤面,到底是上升趨勢還是下降趨勢呢? 而重力拋物線系統,卻可以一眼輕鬆辨別趨勢?! 且還能找到最佳的進出場點位!趕緊觀看影片了解吧 ~
Rainbow MT4
Jamal El Alama
Rainbow MT4 is a technical indicator based on Moving average with period 34 and very easy to use. When price crosses above MA and MA changes color to green, it’s a signal to buy. When price crosses below MA and MA changes color to red, it’s a signal to sell. The Expert advisor ( Rainbow EA MT4) based on Rainbow MT4 indicator, as you can see in the short video below is now available here .
FREE
该产品的买家也购买
Gann Made Easy
Oleg Rodin
4.83 (162)
Gann Made Easy 是一个专业且易于使用的外汇交易系统,它基于使用先生理论的最佳交易原则。 W.D.江恩。该指标提供准确的买入和卖出信号,包括止损和获利水平。您甚至可以使用推送通知在旅途中进行交易。 购买后请联系我,即可免费获得交易指导和超棒的额外指标! 您可能已经多次听说过江恩交易方法。通常 Gann 的理论不仅对于新手交易者而且对于那些已经有一定交易经验的人来说都是非常复杂的东西。这是因为江恩的交易方法在理论上并不那么容易应用。我花了几年时间来完善这些知识,并将最好的原则应用到我的外汇指标中。 该指标非常易于应用。您所需要的只是将其附加到您的图表并遵循简单的交易建议。该指标不断进行市场分析工作并寻找交易机会。当它检测到一个好的入口点时,它会为您提供一个箭头信号。该指标还显示止损和获利水平。 换句话说,当您像先生一样进行交易时,该指标会为您提供最佳江恩建议。江恩亲自告诉你此时此刻该做什么。但最好的部分是您不需要了解任何有关江恩交易原则的知识,因为该指标会为您完成整个市场分析工作。
M1 Sniper
Oleg Rodin
5 (23)
M1 SNIPER 是一款易于使用的交易指标系统。它是一个专为 M1 时间框架设计的箭头指标。该指标可以作为独立的系统在 M1 时间框架下进行剥头皮交易,也可以作为您现有交易系统的一部分使用。虽然该交易系统专为 M1 时间框架交易而设计,但它也可以用于其他时间框架。我最初设计此方法是为了交易 XAUUSD 和 BTCUSD。但我发现这种方法在其他市场交易中也同样有用。 指标信号既可以顺势交易,也可以逆势交易。我教授一种特殊的交易技巧,帮助您利用指标信号进行双向交易。该方法基于使用特殊的动态支撑位和阻力位区域。 购买后,您可以立即下载 M1 SNIPER 箭头指标。此外,我还为所有 M1 SNIPER 工具用户免费提供下方屏幕截图所示的 Apollo Dynamic SR 指标!这两个指标的组合可以帮助您更轻松、更准确地利用 M1 时间框架进行交易。 购买后请联系我,免费获取交易提示和奖励指标! 祝您交易成功!
Auto Optimized Parabolic RSI: 高级 3D 动量引擎 大多数零售指标之所以失效,是因为它们依赖于静态输入,一旦市场波动率发生变化,这些输入就会崩溃。Auto Optimized Parabolic RSI 通过不断重新计算自身的数学优势,解决了“指标衰退”的问题,将机构级别的量化自适应能力直接引入您的 MT5 终端。 核心优势:定制的内存 3D 优化   标准的自动优化器通常会导致 MT5 平台卡顿,因为它们通过标准的指标调用使终端超载。该工具完全绕过了这些性能瓶颈。内部引擎采用定制的原生基于 RAM 的计算器构建,每次加载图表或更改时间周期时,它都会执行极速的 3D 网格搜索。它同时扫描 RSI 周期(频率)、SAR 步长(加速度)和 SAR 最大值(速度限制),在绝对的毫秒级时间内测试数以万计的参数组合,且完全不会拖慢您的平台。它不是仅仅寻找一个“不错”的设置,而是映射整个参数空间,以寻找资产当前动量结构的绝对全局最大值。 严格的财务评分与逼真的交易模拟   与基于抽象“指标点数”进行优化评分的业余工具不同,该引擎的 3.10 版本严格与资金数学挂钩。每
PZ Harmonacci Patterns
PZ TRADING SLU
3.17 (6)
可以说,这是您可以为MetaTrader平台找到的最完整的谐波价格形成自动识别指标。它检测19种不同的模式,像您一样认真对待斐波那契投影,显示潜在的反转区域(PRZ),并找到合适的止损和获利水平。 [ 安装指南 | 更新指南 | 故障排除 | 常见问题 | 所有产品 ] 它检测19种不同的谐波价格形态 它绘制了主要,衍生和互补的斐波那契投影(PRZ) 它评估过去的价格走势并显示每个过去的形态 该指标分析其自身的质量和性能 它显示合适的止损和获利水平 它使用突破来表明合适的交易 它在图表上绘制所有样式比率 它实现了电子邮件/声音/视觉警报 受斯科特·M·卡尼(Scott M. Carney)的书的启发,该指标旨在满足最纯粹和最熟练的交易者的需求。但是,它采取了一种使交易更容易的方式:在向交易发出信号之前,它会等待Donchian朝正确方向突破,从而使交易信号非常可靠。 斐波那契投影与向量无关 它实现了电子邮件/声音/推送警报 它绘制了ABCD投影 重要提示: 为了符合 Scott M. Carney先生 的商标申诉,某些图案名称已重命名为不言自明的替代方式, Scott M.
Scalper Inside PRO
Alexey Minkov
4.74 (69)
Scalper Inside PRO – Since 2020. An exclusive indicator that utilizes an innovative algorithm to swiftly and accurately determine the market trend. The indicator automatically calculates opening, closing, and profit levels, providing detailed trading statistics. With these features, you can choose the most appropriate trading instrument for the current market conditions. Additionally, you can easily integrate your own arrow indicators into Scalper Inside Pro to quickly evaluate their statistics
PRO Renko System
Oleg Rodin
5 (30)
PRO Renko Arrow Based System for trading renko charts.  准确的信号交易任何外汇工具. 另外,我将免费提供系统的附加模块! PRO Renko系统是RENKO图表上高度准确的交易系统。该系统是通用的。 该交易系统可应用于各种交易工具。 该系统有效地中和了所谓的市场噪音,打开了获得准确反转信号的通道。 该指标易于使用,只有一个参数负责产生信号。 您可以很容易地使算法适应您感兴趣的交易工具和renko酒吧的大小。 我很乐意通过提供任何咨询支持来帮助所有客户有效地使用该指标。 祝您交易成功!购买后,立即写信给我! 我将与您分享我的建议和我的renko发电机。 另外,我将免费提供系统的附加模块!
Quantum Breakout Indicator PRO
Bogdan Ion Puscasu
4.96 (26)
介绍     Quantum Breakout PRO   ,突破性的 MQL5 指标,正在改变您交易突破区域的方式!   Quantum Breakout PRO 由拥有超过 13 年交易经验的经验丰富的交易者团队开发,旨在通过其创新和动态的突破区域策略将您的交易之旅推向新的高度。 量子突破指标将为您提供带有 5 个利润目标区域的突破区域的信号箭头,以及基于突破框的止损建议。 它既适合新手交易者,也适合专业交易者。 量子 EA 通道:       点击这里 MT5版本:   点击这里 重要的!购买后请私信我领取安装手册。 建议: 时间范围:M15 货币对:GBPJPY、EURJPY、USDJPY、NZDUSD、XAUUSD 账户类型:ECN、Raw 或 Razor,点差极低 经纪商时间:GMT +3 经纪商:IC Markets、Pepperstone with Raw 和 Razor 的点差最低 规格: 不重漆! 最多 5 个建议利润目标区域 建议止损水平 可定制的盒子。您可以设置自己的 Box Time Start 和 Box Time End。 接触 如果您
The Propfolio Master Suite is the ultimate all-in-one analytical workstation for professional traders. Combining the power of the Beat The Market Maker (BTMM) methodology, Smart Money Concepts (SND/Liquidity), and Advanced Volume Profile, this suite replaces multiple different indicators with one optimized engine. Monitor up to 14 pairs simultaneously from a single chart, instantly identify market cycles, and seamlessly map institutional footprints with the click of a button. The Command Center
购买此指标即可免费获得我的专业交易管理器。 首先,值得强调的是,这个交易系统是一个非重绘、非重画和非滞后的指标,这使得它非常适合手动和机器人交易。 在线课程,手册和下载预设。 “智能趋势交易系统 MT5”是专为新手和经验丰富的交易者量身定制的综合交易解决方案。它结合了超过 10 个优质指标,具有 7 多个强大的交易策略,使其成为适用于各种市场条件的多功能选择。 趋势跟随策略:提供精确的入场和止损管理,以有效地跟随趋势。 反转策略:识别潜在的趋势反转,使交易者能够利用区域市场的机会。 剃头策略:专为快速准确的日内交易和短期交易而设计。 稳定性:所有指标都不会重绘、不会重画和不会滞后,确保可靠的信号。 定制:支持自定义策略,以满足个人交易偏好。超过 7 种策略和组合可帮助您找到最佳策略。 信号清晰度:提供箭头信号,以指示清晰的入场和退出点。 实时警报:通过交易进出警报使交易者保持了解。 深入分析:提供更高时间框架的趋势分析和实时交易监控。 自适应颜色编码:利用蜡烛颜色编码来显示成交量、趋势和反转蜡烛信号。通过蜡烛颜色分析市场方向。 “智能趋势交易系统 MT5”赋予交易者必要的工具,以便在
Please send me Direct message on MQL5 CHAT after purchasing the Indicator for Training and Installation Support There are some additional files that is important to use with the Indicator . So be sure to contact me after purchasing the Indicator So that I can add you for training and support . If you find any difficulty with installation then send me Direct message here So that I can connect with you via Anydesk or Teamview for the product installation. " Smart Order Block Indicator " to find m
GoldRush Trend Arrow Signal
Kirk Lee Holloway
5 (2)
GoldRush 趨勢箭頭信號 GoldRush 趨勢箭頭信號 指標為 XAU/USD 中的高速、短期短線交易者提供精確、實時的趨勢分析。 專為1分鐘時間框架設計,此工具顯示方向箭頭以明確顯示入場點,使短線交易者能在波動市場中自信操作。 該指標包含主要和次要警示箭頭。主要信號為白色和黑色方向箭頭,用於指示趨勢方向的轉變;次要信號為藍色和紅色箭頭,用於確認主要箭頭指示的方向並提示潛在交易入場點。 注意:當趨勢方向發生變化後僅出現一個主要警報箭頭時,請注意可能會出現多個次要藍/紅箭頭。次要信號將在滿足信號標準的任何蠟燭圖後出現,因此在長期趨勢移動中,螢幕上將顯示大量次要箭頭(如附帶的截圖所示)。您可在設置中開啟或關閉任一箭頭類型。 以下是我使用此指標進行交易的方式: - 對於買入入場,我會耐心等待白箭頭在蠟燭收盤時出現,並在下一根可用蠟燭收盤時出現藍箭頭時進行買入交易。 - 對於賣出入場,我會耐心等待黑箭頭在蠟燭收盤時出現,並在下一根可用蠟燭收盤時出現紅箭頭時進行賣出交易。 - 獲利了結/止損設置由使用者自行負責,但我個人使用最低R:R為1:2,並發現這在倫敦/紐約開盤等
Day Trader Master
Oleg Rodin
5 (15)
Day Trader Master 是一个完整的日间交易者交易系统。该系统由两个指标组成。一个指标是买入和卖出的箭头信号。这是你得到的箭头指示器。我将免费为您提供第二个指标。第二个指标是专门设计用于与这些箭头结合使用的趋势指标。 指标不重复也不迟到! 使用这个系统非常简单。您只需按照当前趋势方向的箭头信号,显示为双色线。蓝色是买入趋势。红色是一种销售趋势。蓝色箭头是买入信号。红色箭头是卖出信号。您需要箭头的颜色和信号的方向来匹配趋势线的颜色。 箭头指标主要是为 M5 和 M15 时间间隔的日内交易而创建的。但从技术上讲,该系统可以用于其他时间间隔。 指示器配备带有推送消息功能的弹出警报。 购买后一定要写信给我!我将为您提供与系统交易的个人建议,以及我的趋势指标。此外,还有丰厚的奖励等着您!
Market Makers
Mohamed Hassan
5 (4)
After purchase, contact me privately to receive 1 month of free testing with EA Forex Proton! This advanced MT4 trading robot automatically executes signals from any MT4 indicator, including Market Makers. The latest version also includes AI integration, allowing each trade signal to be analyzed using Artificial Intelligence. Live Signal with EA Forex Proton: Click here Market Makers is a powerful price action trading system designed to identify high-probability Buy and Sell opportunities based
Apollo SR Master
Oleg Rodin
5 (2)
Apollo SR Master 是一款支撑/阻力指标,其特殊功能使利用支撑/阻力区域进行交易更加便捷可靠。该指标通过检测局部价格顶部和底部,实时计算支撑/阻力区域,没有任何时间延迟。为了确认新形成的支撑/阻力区域,该指标会显示特殊信号,表明该支撑/阻力区域可以作为实际的卖出或买入信号。在这种情况下,支撑/阻力区域的强度会增强,因此从该区域进行交易的成功率也会更高。这正是该指标的核心理念。 SR区域也使止损和止盈的操作更加便捷。根据信号方向,可以将SR区域上方或下方的空间用作止损位。此外,相对的SR区域也可以用作潜在的止盈区域。 我还免费向所有 Apollo SR Master 指标的用户提供我的“Apollo 价格行为系统”指标。这两个指标结合使用将帮助您找到更好的入场点。 购买后请联系我,即可免费获得我的交易技巧以及我的“阿波罗价格行为系统”指标作为赠品!
PZ Trend Trading
PZ TRADING SLU
4.8 (5)
许多盈利交易者不仅知道如何识别市场趋势,而且也能把握趋势建立后的交易机会。 Pz 趋势交易 指标设计用来在趋势行情中尽可能的赚取利润。 已建立的趋势提供了一揽子交易机会,但大多数趋势交易指标完全忽视了它们,让交易者在趋势行情时完全不知道该如何做!一般趋势指标只通知有关的趋势变化,但根本不足以得到卓越的回报. Pz 趋势交易 指标比一般趋势指标显示多达 20 倍的交易 , 因为它注重所谓的市场时机。它不仅显示当前的市场趋势,也有回调,内柱线的突破和调整。它令您在趋势回调之后介入,安全的柱线内突破金字塔加仓,以及发现潜在的反转,和已知的调整。 趋势改变 一个趋势改变在市场方向变化时发生。趋势变化在图表上用带数字的彩色圆圈显示。蓝色 (1) 信号为上涨开始, 而红色 (1) 信号为下跌开始。趋势变化并非评估当前价格动作的结果, 它意味着交易设置是不定时地。如果您正确使用本指标, 在趋势变化时, 您将将已经入场 (参看下面的调整)。 回调 但凡趋势在运动中,行情上下抖动,盈利者收割利润,且其它参与者入场。趋势回调代表好的买入机会,通常是由主力获利离场导致。如果行情在回调后回归上行, 指标将
GOLD Impulse with Alert
Bernhard Schweigert
4.67 (12)
这个指标是我们2个产品 Advanced Currency IMPULSE with ALERT  +   Currency Strength Exotics 的一个超级组合。 它适用于所有时间框架,并以图形方式显示8种主要货币和一种符号的强势或弱势冲动! 该指标专门用于显示任何符号的货币强度加速,如黄金、异国货币对、商品、指数或期货。这是它的第一个指标,任何符号都可以被添加到第9行,以显示黄金、白银、石油、DAX、US30、MXN、TRY、CNH等的真实货币强度加速(冲动或速度)。 建立在新的基础算法上,它使识别和确认潜在的交易更加容易。这是因为它以图形方式显示了一种货币的强势或弱势是否正在加速,并测量了这种加速的速度--把它想象成你汽车中的速度表。当你加速时,事情显然会发生得更快,这在外汇市场上也是一样的,即如果你配对的货币正在向相反的方向加速,你就会发现一个潜在的有利可图的交易。 动态市场斐波那契28水平被用作警报触发器,将适应市场活动。如果冲动击中黄色触发线,你将收到警报。然后你就知道作为一个交易员应该做什么。货币对和方向已经给出。只需点击警报按钮,就可以切换到该货
Market Structure Patterns MT4
Samuel Manoel De Souza
5 (18)
Market Structure Patterns   is an indicator based on   smart money concepts   that displays   SMC/ICT   elements that can take your trading decisions to the next level. Take advantage of the   alerts ,   push notifications   and   email messages   to keep informed from when an element is formed on the chart, the price crosses a level and/or enters in a box/zone. Developers can access the values of the elements of the indicator using the   global variables  what allows the automation of trading d
Advanced Supply Demand
Bernhard Schweigert
4.91 (300)
现在优惠 40%! 任何新手或专业交易者的最佳解决方案! 该指标是一款独特、高质量、且价格合理的交易工具,因为我们已经整合了许多专有功能和新公式。 依据此更新,您将能够显示双重时间帧区域。 您不仅可以显示一个较高的时间帧,还可以同时显示图表时间帧,加上更高的时间帧:显示嵌套时区。 供需双方所有交易者都会喜欢它。 :) 重要信息披露 高级供需的最大潜力,请访问 https://www.mql5.com/zh/blogs/post/720245   想象您的交易如何得以改善,是因为您能够精准定位入场或目标位吗? 构建于新的底层算法,它可以更轻松地识别出买卖双方之间的潜在失衡。 这是因为它以图形方式展示供需最强劲区域,及其过去的表现(显示旧区域)。 这些功能旨在帮助您更轻松地发现最佳入场区域和价位。 现在您可以针对您的交易品种和时间帧来优化和编辑区域强度! 高级供需指标适用于所有产品和时间帧。 它是一个新的公式,非常新的功能是两个区域强度函数可由用户输入进行调整! 这在交易中是一大优势。 当您学习如何使用专有功能,例如带有价格游离最小 X 因子的区域强度时,您能够判断该区域强劲与否。 供需
CRT Candle Range Theory HTF MT4.   Ultimate CRT Indicator: Advanced ICT Concepts and Malaysian SnR Trading System Discounted   Price   $50  !!     Secure your lifetime access   now   before it switches to   subscription-only ! Master the Market Maker's Footprints with the Most Advanced Candle Range Theory Indicator Unlock the true power of   Smart Money Concepts (SMC)   and trade precisely like the institutions with the   Ultimate CRT Indicator . Built exclusively for serious traders, this indic
PZ Turning Points MT4
PZ TRADING SLU
1 (1)
该指标检查不同时期分形的价格结构,以确定市场中可能的反转点,从而为已经具有基本或技术估值模型的仓位交易者提供时机。与它的弟弟 Reversal Fractals不同 ,该指标不会因为所选时期而错过反转,并且会以之字形方式找到反转分形,而忽略那些没有足够动量来引发持续价格波动的反转。 [ 安装指南 | 更新指南 | 故障排除 | 常见问题 | 所有产品 ] 转折点可以开始长期趋势 指示器不重涂 它实现了各种警报 可自定义的颜色和尺寸 该指示符是无功或滞后信号,因为分形是奇数个条形的地层,是中间地带中最高或最低的条形,并且指示符在分形中的所有条形都闭合时绘制。但是,具有预先设定的方向偏差的交易者会发现该指标非常有用,可以提早进入切入点。 该指标既不是下探信号指标,也不是完整的交易系统。请不要这样评价或审查它。 输入参数 最小分形数:分形上的最小条形数。必须为奇数,例如3、5、7、9、11、13,... 最大分形:分形上的最大条形数量。必须为奇数,例如3、5、7、9、11、13 ... 最大历史柱数:指标加载时评估的过去柱数。 颜色:自定义箭头和线条的颜色和大小。 警报:启用或禁用各
PZ Support Resistance
PZ TRADING SLU
3.33 (3)
厌倦了绘制支撑线和阻力线? 支撑阻力 是一个多时间指标,可以自动检测并绘制图表中的支撑线和阻力线,并具有非常有趣的变化:随着时间的推移测试价格水平及其重要性的提高,线变得越来越粗。 [ 安装指南 | 更新指南 | 故障排除 | 常见问题 | 所有产品 ] 一夜之间增强您的技术分析 无需浏览图表即可检测重要的价格水平 一目了然地识别所有价格水平的相对优势 每次交易最多可节省半小时的绘图线 指标显示所有价格水平的期限 指示器不重涂 过去和现在的价格水平因接近程度而崩溃,并根据当前的市场行为进行了调整。在动作发生的地方绘制了线条,而不一定在峰值处绘制了线条。 价格水平随着时间的推移而被拒绝,变得越来越暗 定期清除不重要的价格水平以避免噪音 可自定义的时间范围选择和崩溃因子 它实现了电子邮件/声音/推送警报的突破 输入参数 指标设置:指标将从当前时间段读取价格,但您可以选择另一个。例如,您可以在H4图表中显示D1支撑线和阻力线。您还可以使用 价格水平密度 参数选择在图表上显示多少价格水平。 颜色设置:根据重要性输入所需的支撑线和阻力线颜色。 标签设置:(可选)可以在指示器中显示用于
Dynamic Scalper System
Vitalyi Belyh
5 (1)
“ Dynamic Scalper System ”指标专为在趋势波内进行剥头皮交易而设计。 已在主要货币对和黄金上进行测试,并可与其他交易工具兼容。 提供顺势短线建仓信号,并提供额外的价格变动支持。 指标原理: 大箭头决定趋势方向。 在趋势波内,我们采用一种生成小箭头形式的剥头皮交易信号的算法。 红色箭头代表看涨方向,蓝色箭头代表看跌方向。 敏感的价格变动线会沿着趋势方向绘制,并与小箭头信号协同作用。 信号运作方式如下:当线在适当时刻出现时,将形成入场信号;在出现线时,持仓;线完成后,平仓。 建议的操作时间范围为M1 - H4。 箭头在当前K线上方形成,如果下一根K线已开仓,则不会重新绘制上一根K线上方的箭头。 输入参数 Trend Wave Period - 趋势方向(大箭头)的周期,改变趋势波的时间间隔。值 1 表示趋势方向的最长持续时间,参数值越大,持续时间越短。 Scalper Arrows Period - 信号箭头(小箭头)的计算周期,改变入场信号的生成频率。值 3 表示最频繁的生成频率,参数值越大,箭头频率越低,准确度越高。 这些参数可以根据不同的时间范
They say history repeats itself. What if you could prove it in real-time? The Propfolio Ghost Pattern is an advanced algorithmic pattern-matching engine. It empowers you to select any current price action structure on your chart and instantly scan thousands of historical candles to find the exact moment in the past where the market did the exact same thing. Once it finds the highest probability match, it projects the historical outcome into the future as "Ghost Candles"—giving you a highly calcu
Atomic Analyst
Issam Kassas
5 (5)
首先值得强调的是,该交易指标是非重绘、非延迟的指标,这使其成为手动和机器人交易的理想选择。 用户手册:设置、输入和策略。 Atomic Analyst是一种PA价格行动指标,利用价格的力量和动量来寻找市场上更好的机会。配备了高级过滤器,可帮助去除噪音和假信号,并提高交易潜力。使用多层复杂的指标,Atomic Analyst扫描图表,并将复杂的数学计算转化为任何初学者都能理解并用来做出一致交易决策的简单信号和颜色。 “Atomic Analyst”是专为新手和经验丰富的交易者量身定制的综合交易解决方案。它将高级指标和一流功能融合为一体的交易策略,使其成为所有类型交易者的多功能选择。 日内交易和剥头皮策略:专为快速准确的日内交易和短期交易而设计。 日内和摆动交易策略:可用作追求价格大幅波动的日内和摆动交易者的可靠工具。 多货币和市场:凭借其可靠的精度,在不同的工具和市场上运作。 多个时间框架:可在多个时间框架上使用,性能良好。 稳定性:所有指标均不重绘、不重绘和不滞后,确保可靠的信号。 信号清晰度:提供箭头信号,用于清晰的入场和出场点。 实时警报:通过交易入场、SL和TP警报通知交易者
目前有26%的折扣!! 这个指标是我们两个主要指标( Advanced Currency Strength 28   &  Advanced Currency IMPULSE with ALERT )的一个超级组合。它显示了28个外汇对的TICK-UNITS货币强度值和警报信号。可以使用11种不同的Tick-Units。它们是1、2、3、4、5、6、10、12、15、20和30秒。子窗口中的Tick-Unit栏将被显示并向左移动,当在一秒钟的定时器中至少有一个Tick。 只用一个图表,你就可以剥28个外汇货币对的头皮!想象一下,你的剥头皮将如何提高。想象一下,你的剥头皮将如何改善,因为你能够准确地确定剥头皮机会的触发点? 这是市场上第一个在比1分钟更短的时间内工作的货币强度指标! 它是为那些希望快速进出并从市场中切出小点数的快速剥头皮者准备的。 用户手册:点击这里 https://www.mql5.com/en/blogs/post/727178 特点。 为28个货币对提供嘀嗒单位的卖出/买入警报,有一个按钮可以快速打开目标图表。 在3种敏感模式中选择一种(慢-中-快
KURAMA GOLD SIGNAL PRO(MT4版)— 7层过滤器、自动TP/SL、品质评分搭载 XAUUSD完整交易系统 不重绘。不重画。不延迟。每个信号永久固定。所见即所得。 福利:购买买断版许可证可免费获得 AI Zone Radar(价值$59)+ 完整PDF手册。购买后请给我发消息。 AI Zone Radar: https://www.mql5.com/en/market/product/175834 交易员的信赖:已被活跃的黄金交易员社区使用。因精度和易用性获得赞誉。 你的问题 — 以及解决方案 你知道黄金每天波动$30-50。你知道这里有钱可赚。但是: - 入场过早,价格反向$10后才朝你的方向走 - 每次MA触碰都入场,结果一半都失败 - 没有TP/SL系统,所以持仓太久或离场太早 - 在死寂时段交易,然后想为什么什么都不顺 KURAMA GOLD SIGNAL PRO解决了这一切。不是用一个过滤器,而是七个。 工作原理 — 3步 1. 图表上出现箭头信号 2. 在面板上查看TP价格、SL价格、品质评分、风险回报比 3. 下单并等待 无
购买后请联系我,获取基于此指标的奖励EA。 Self Optimizing Double MA Strategy 是一款专业级别的交易工具,旨在消除参数猜测。它由内置的自动优化引擎驱动,通过在后台模拟数千种参数组合,不断适应不断变化的市场条件,从而保持统计上的优势。 该指标不依赖于静态、过时的设置,而是动态更新其内部逻辑,为当前的时间周期和交易品种寻找最赚钱的配置。 核心功能 内置自动优化:系统会根据您选择的更新频率,定期重新计算快速 MA、慢速 MA 和 RSI 的周期,确保您的设置始终与当前的市场节奏保持一致。 MA 发散过滤器:一项核心的趋势强度指标,仅在移动平均线积极发散时才确认信号的有效性。这可以防止在均线收敛或平缓的盘整市场中产生虚假的入场信号。 时序评分引擎:内部模拟器在图表上绘制任何实时信号之前,会根据您的具体目标(例如最大化利润因子或最小化回撤)对历史信号进行评估。 动态 ATR 区域:根据实时市场波动率,自动计算并在图表上直观地投射出止盈和止损区域。 实时绩效仪表板:直接在您的图表上跟踪并显示实时的系统指标,包括历史胜率、平均回撤以及产生的总点数。 完美支持 EA
Gold Scalper Super
Aleksandr Makarov
5 (2)
Gold Scalper Super is an easy-to-use trading system. The indicator can be used as a standalone scalping system on the M1 time frame, as well as part of your existing trading system. Bonus: when purchasing an indicator, Trend Arrow Super is provided free of charge, write to us after purchase. The indicator 100% does not repaint!!! If a signal appears, it does not disappear! Unlike indicators with redrawing, which lead to the loss of a deposit, because they can show a signal and then remove it.
Advanced Currency Strength28 Indicator
Bernhard Schweigert
4.91 (657)
目前40%的折扣 任何新手或专家交易者的最佳解决方案! 这个指标是一个独特的、高质量的、可负担得起的交易工具,因为我们纳入了一些专有的功能和一个新的公式。只需一个图表,你就可以读出28个外汇对的货币强度!想象一下,你的交易将如何得到改善,因为你的交易是在你的手中进行的。想象一下,你的交易将如何改善,因为你能够准确地确定新趋势或剥头皮机会的触发点? 用户手册:点击这里  https://www.mql5.com/en/blogs/post/697384 这是第一本,原版的! 不要买一个毫无价值的崇拜者的克隆品。 特别的 子窗口中的箭头显示强劲的货币势头GAP将指导你的交易! 当基础货币或报价货币处于超卖/超买区域(外盘斐波那契水平)时,在个人图表的主窗口中出现警告信号。 当货币力量从外围区间回落时,回撤/反转警报。 十字星模式的特别警报 可选择多个时间框架,以快速查看趋势! 货币强度线在所有的时间框架中都非常平稳,当使用较高的时间框架来识别总体趋势,然后使用较短的时间框架来确定精确的入口时,效果非常好。你可以根据自己的意愿选择任何时间框架。每个时间框架都由其自身进行了优化。
Cyclic Impulse
Vitalyi Belyh
构建图表并识别周期性价格变动的技术指标。 可以在任何图表上工作。 几种类型的通知。 图表本身还有额外的箭头。 无需重新绘制历史记录,只需关闭蜡烛即可。 建议使用 M5 及以上的 TF。 易于使用和配置参数。 当使用 2 个具有不同参数的指标时,您可以单独使用它们,而无需其他指标。 有 2 个输入参数 周期性和信号持续时间 这两个参数处理图表结构的处理。 Cyclicity 调节反转周期的变化频率,平滑周期。 Signal duration 为最小数字,检测价格变动中的脉冲,最大长期趋势变动。    ---------------------------------------------------------------------------------------
作者的更多信息
Half Trend TP SL
Jalitha K Johny
Half Trend TPSL Buy Sell Indicator calculates the open and close of the price bars over the selected period of time and applies its own  calculation method to find an average line of the price movement.  ATR based Take Profit and Stop Loss ATR is a measure of volatility over a specified period of time. The most common length is 14, which is also a common length for oscillators, such as the relative strength index (RSI) and stochastics. A higher ATR indicates a more volatile market, while a lowe
Advanced Camarilla Calculator is one of the most commonly used trading calculators. This calculator can be used to generate levels. Scenario 1 Open price is between H3 and L3 For Long  - Wait for the price to go below L3 and then when it moves back above L3, buy. Stop loss will be when price moves below L4. Target1 - H1, Target2 - H2, Target3 - H3  For Short  -  Wait for the price to go above H3 and then when the price moves back below H3, sell. Stop loss will be when price moves above H4. Targe
Trend Analyser
Jalitha K Johny
Multi Trend Analyzer MT4 indicator provides signals from the following technical trading indicators: RSI, STOCH, STOCHRSI, MACD, ADX, Williams % R, ATR, Oscillator, ROC and Bull/Bear Power. It supports all time frames, from the 1 minute up to the monthly charts. You can change all indicator inputs. Indicator provide total trend summary. We can easily analysis and study market movement .
MACD MULTI TIME FRAME WITH MULTI SYMBOLS  INDICATOR  MACD MTF Indicator visualize all MT4 time frame  and trend based on  Moving Average Convergence Divergence (MACD) strategy . Indicator have settings for MACD customizing and variable "Symbols "EURUSD,USDCHG,...", which is used to define symbols. , Signals are displayed  Buy  , Strong buy  ,  Sell,  Strong Sell,   ### - No Trend Strong  Description The Moving Average Convergence/Divergence indicator is a momentum oscillator primarily used to tr
Super Trend Filter Indicator
Jalitha K Johny
4.5 (4)
Super Trend Filter Indicator Super trend Arrow Consider as a Master Candle , If super trend in Buy signal , then signal candle calculate as master candle  and master candle close above the open candle then calculate filter Buy Arrow.  If super trend in Sell signal , then signal candle calculate master candle  and master candle close below the open candle calculate filter Sell Arrow. 3 Target with Trailing Stop Loss 
Fibonacci calculator is used with Elliot Waves, it can generate remarkable results. A trader could use these levels or ratios to find high probability trades with very small stop loss. You may also use these ratios to find Elliott Waves extensions and to book profit near those levels. For Elliot Wave experts, Fibonacci calculator is a highly useful tool that can assist them in calculating Fibonacci extension and retracement levels for the market price. The indicator proves itself as a useful one
This MACD Magic indicator coded due to inspired in a another similar indicator ,Here Macd Magic calculate Double trend confirmation. With ATR Ratio Based TP point , ATR value input are available in input settings . MACD Magic indicator provides Accurate signals on all Major currency pair and stocks. This indicator Very easy to analysis trend and set target point 
Wolfe Wave Scanner
Jalitha K Johny
4.5 (2)
Wolfe Waves scanner - It scans all the Symbols and identify the movement of price and it gives confidence in trade. It automatically plots  fifth wave breaks out of the channel. According to the theory behind the pattern, a line drawn from the point at the beginning of the first wave and passing through the beginning of the fourth wave predicts a target price for the end of the fifth wave. If a trader properly identifies a Wolfe Wave as it forms, the beginning of the fifth wave represents an op
Atr Mtf Trend
Jalitha K Johny
The Average True Range (ATR) is a tool to measure volatility. ATR MTF (Multi Time Frame) indicator provides all timeframe trends helps to identify in which kind of volatility environment the market .This indicator can be used with any Trading Systems for additional confirmation of trading entries or exits. It is a very helpful tool to calculate Targets and Stops according the current market conditions.
Half Trend TPSL Buy Sell Indicator calculates the open and close of the price bars over the selected period of time and applies its own  calculation method to find an average line of the price movement.  ATR based Take Profit and Stop Loss ATR is a measure of volatility over a specified period of time. The most common length is 14, which is also a common length for oscillators, such as the relative strength index (RSI) and stochastics. A higher ATR indicates a more volatile market, while a lowe
An RSI (Relative Strength Index) MT4 (MetaTrader 4) scanner is a tool used in forex trading to identify overbought or oversold conditions across multiple currency pairs and timeframes. The RSI is a momentum oscillator that measures the speed and change of price movements, typically used to identify potential reversal points in the market. Key Features and Functions of an RSI MT4 Scanner: Multiple Timeframe Analysis : The scanner can analyze various timeframes (e.g., 1 minute, 5 minutes, 15 minut
Product Description: MT4 Trade Copier with Advanced Features MT4  Trade Copier is designed to streamline and enhance your trading experience by allowing seamless replication of trades across multiple accounts. It offers advanced features to cater to different trading needs and preferences. Features: Master/Slave Selection: Easily choose between master and slave modes to manage trades effectively. Multiplier for Slave Accounts: Set a multiplier to adjust the size of trades copied to slave a
BB Scanner MT4  is a powerful, next-generation market scanner that detects Bollinger Bands breakouts across multiple symbols and timeframes. It provides a modern, interactive dashboard that displays signals, entry price, target levels, stop loss, and real-time status — all in one place. Key Features Multi-Symbol & Multi-Timeframe Scanning (auto or custom list) Precise BB Breakout Detection (Buy/Sell with ATR-based targets) Automatic Target 1, Target 2, Stop Loss calculation ️ Modern
The Super Trend is one of the best trend-following indicator for MT5 platforms. It's working fine for real-time trend alerts and accurate signals and it help to identify the best market entry and exit positions.  This indicator is the tool you can  refers to a trend following overlays. It contains two major parameters: the period and the multiplier. Besides, traders should consider default values that include 10 for every true range aтd 3 for the multiplier. 2 Types TP SL you set in input Point
A HalfTrend scanner for MT5 (MetaTrader 5) is a technical analysis tool designed to help traders identify trend reversals and trade opportunities in the market. The HalfTrend indicator itself is based on price movements and a specific algorithm that identifies changes in market direction. Here’s a detailed description of an MT5 HalfTrend scanner: Overview The MT5 HalfTrend scanner is an advanced tool that scans multiple currency pairs or financial instruments for potential trend reversal signals
Super Trend Filter Indicator SuperTrend Filter V5.2 MT5 Indicator, as provided in the code, is a custom technical analysis tool designed for  MetaTrader 5 (MT5) to identify market trends, provide trading signals, and display key price levels with a visually appealing interface. Super trend Arrow Consider as a Master Candle, If super trend in Buy signal, then signal candle calculates as master candle  and master candle close above the open candle then calculate filter Buy Arrow.  If super tre
MACD Multi Time Frame Scanner MACD Scanner MT5 is a powerful and easy-to-use dashboard tool that scans the MACD indicator across multiple symbols and multiple timeframes in real-time. It gives you a complete market overview at a glance, helping you spot bullish and bearish MACD crossovers instantly — without switching between charts. 1. Multi-Symbol / Multi-Timeframe Scanning Allow user to set a watchlist (symbols to scan). Scan across multiple timeframes (M1 → MN). Show signals (Bullish / Beari
筛选:
tabban21
166
tabban21 2022.05.02 22:33 
 

Great value for money> So many signal indicators scanning the market for this affordable price ! Another good feature is you double click on the currency pair and it opens the chart for you, which is a small bonus. There are no push alerts to phone but hopefully could be in next iteration. I am pleased with the product. As with all these scanners there are delays in the signals depending on the time zone you are in so need to tweak slightly to get the best out of it but still very handy. Very customisable to time frame and indicator values

回复评论