Macd MTF Indicator

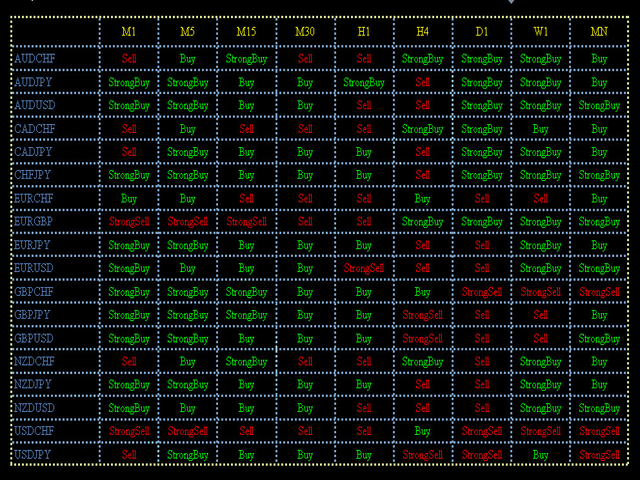
MACD MULTI TIME FRAME WITH MULTI SYMBOLS  INDICATOR 

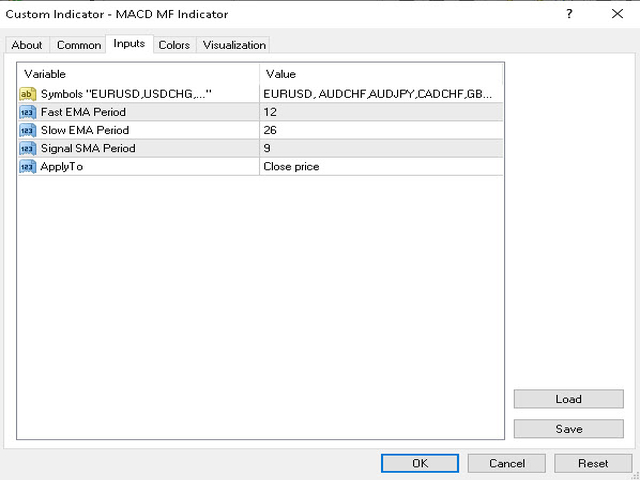
MACD MTF Indicator visualize all MT4 time frame  and trend based on  Moving Average Convergence Divergence (MACD) strategy . Indicator have settings for MACD customizing and variable "Symbols "EURUSD,USDCHG,...", which is used to define symbols. , Signals are displayed  Buy , Strong buy ,  Sell,  Strong Sell,   ### - No Trend Strong 

Description

The Moving Average Convergence/Divergence indicator is a momentum oscillator primarily used to trade trends. Although it is an oscillator, it is not typically used to identify over bought or oversold conditions. It appears on the chart as two lines which oscillate without boundaries. The crossover of the two lines give trading signals similar to a two moving average system.


推荐产品
Ichimoku Trade X is an EA based on Ichimoku Kinko Hyo. Ichimoku Kinko Hyo parameters such as Tenkansen1, Kijunsen1, SenkouSpanB1, BuyShift1, Tenkansen2, Kijunsen2, SenkouSpanB2, BuyShift2, Tenkansen3, Kijunsen3, SenkouSpanB3, SellShift1, Tenkansen4, Kijunsen4, SenkouSpanB4 and SellShift2 can be adjusted. Ichimoku Trade X applies BTN TECHNOLOGY's state-of-the-art intelligent technology to help you create optimal results for your trades. May your dreams come true through Ichimoku Trade X. Good lu
A trend indicator based on the Ichimoku Kinko Hyo and MACD. The ICloud Scalper Trend Indy is an improved variant of the Ichimoku Kinko Hyo and MACD, which shows the moment of trend following quite accurately. It is often used as a signal filter. Combination of two indicators makes a better use of these advantages: Ichimoku Kinko Hyo identifies the trend, while MACD determines the short-term movements and signals in the trend direction. Messages/Sounds (Notifications and sound settings) ON/OFF -
Advanced awesome indicator is a modified and advanced version of the standard awesome oscillator. With this indicator you can now make adjustments that you can not do on the awesome indicator. You can change and edit this indicator to suit your strategy. You can easily use it to recognize large and small trends. Features The period can be set to define larger and smaller trends with the fast and period slow feature. You can change the input mode with the price mode. You can use Simple, Exponent
MACD Trend EA
Lachezar Krastev
4.5 (2)
MACD Trend EA is based on the popular forex indicator MACD (Moving Average Convergence Divergence). It is fully automated trading expert advisor and completely FREE!  As the name suggests, this expert advisor uses a trend-following strategy and uses the MACD indicator to detect the beginning of uptrends and downtrends. MACD Trend EA Top Features - Trend Following Strategy - Money Management - Advanced Exit System + TP and SL  - Trailing Stop System - Broker protection System - Custom Magic Re
FREE
Breakout Monster Mini
Abdulfattah Yahya Mohammed Alhazmi
5 (3)
It is a very profitable EA, to trade trends breakout, and manage trades, takeprofit, stoploss, move to breakeven, and trailing stop. I work with this EA, and the reversal/pullback version since 2014.  This is a demo   version of the full   Breakout Monster EA . It works on Real and Demo accounts. Demo version restrictions: Money Management is disabled. Lot size is restricted to 0.01 lots only (Or the minimum allowed by broker). Numerical, SL and TP set to 100 pips. They cannot be modified in
FREE
Expert MACD 4K
Wisam Oudah Radhi Al Musawi
It is a flexible and powerful MetaTrader expert advisor that trades with the MACD indicator and implements many useful features. The MACD base indicator is used for MetaTrader. It offers several customizable MACD trading scenarios and flexible position management settings, as well as many useful features such as customizable trading sessions. Trading only on EUR / USD. H4 _________________________________________________________________________________________ EUR / USD.   H4   Easy to use and
StarTrend
Gabriele Tedeschi
StarTrend è un indicatore a freccia che identifica, con alta probabilità, l'inizio di un nuovo trend.  La sua versatilità, però, permette di utilizzarlo anche in strategia in cui cerchiamo operazioni a favore di trend. StarTrend può essere la base del proprio sistema di trading oppure può integrare, per dare conferme o suggerimenti di astensione, il tuo sistema già collaudato. StarTrend invia segnali di preallarme quando c'è un probabile rallentamento della forza del trend e poi disegna una stel
Market Structure Zig Zag
Lesedi Oliver Seilane
4.66 (29)
Free Market structure zig zag to assist in price action trading the screenshots describe how to use and how to spot patterns new version comes with alerts, email alert and  push notification alert can be used on all pairs  can be used on all timeframes  you can add additional confirmation indicators the indicator shows you your higher high and low highs as well as your lower lows and lower highs  the indication makes price action analysis easier to spot.
FREE
The EA created based on this strategy: This EMA crossover trading strategy is made with MACD. For MACD, you can avoid false signals from this EMA crossover. With this strategy, you can get more accurate signals. So this is more profitable . Strategy required FAST EMA SLOW EMA MACD with default setting How Signals come Buy Signal: When FAST EMA cross SLOW EMA from lower to upper, then you have to wait for MACD confirmation. After crossover, when you see MACD above 0.0 level, then you can take buy
Binary Option Signal
Yaroslav Varankin
Indicator for binary options arrow is easy to use and does not require configuration works on all currency pairs, cryptocurrencies buy signal blue up arrow sell signal red down arrow tips do not trade during news and 15-30 minutes before their release, as the market is too volatile and there is a lot of noise it is worth entering trades one or two candles from the current period (recommended for 1 candle) timeframe up to m 15 recommended money management fixed lot or fixed percentage of the depo
适用于 MT4 的 Crypto_Forex 指标 HTF ADX。 - 使用专业的 MT4 HTF ADX 指标升级您的交易方法。HTF 表示“更高时间框架”。 - ADX(红线)用于衡量趋势强度 - 如果 ADX 值高于 20 且呈上行趋势,则趋势强劲。 - 如果 +DMI(蓝线)高于 -DMI(绿线):价格正在上涨,ADX 衡量上涨趋势的强度。 - 如果 -DMI(绿线)高于 +DMI(蓝线):价格正在下跌,ADX 衡量下跌趋势的强度。 - 如果 ADX(红线)低于 20,则市场处于平盘状态。 - 此指标非常适合多时间框架趋势交易 - 您可以将更高时间框架的 ADX 附加到您当前的图表中。 Click here to see high quality Trading Robots and Indicators! 这是仅在 MQL5 网站上提供的原创产品。
其中一个数字序列称为“森林火灾序列”。它被公认为最美丽的新序列之一。它的主要特点是该序列避免了线性趋势,即使是最短的趋势。正是这一属性构成了该指标的基础。 在分析金融时间序列时,该指标试图拒绝所有可能的趋势选项。只有当他失败时,他才会认识到趋势的存在并给出适当的信号。这种方法可以让人们正确地确定新趋势开始的时刻。然而,误报也是可能的。为了减少它们的数量,该指标添加了一个额外的过滤器。当新柱打开时会生成信号。在任何情况下都不会发生重绘。 指标参数: Applied Price - 应用价格常数; Period Main - 指标的主要周期,其有效值在 5 - 60 之间; Period Additional - 附加周期,此参数的有效值为 5 - 40; Signal Filter - 附加信号滤波器,有效值 0 - 99; Alerts - 启用后,指示器会在出现新信号时提醒您; Send Mail - 允许指标向电子邮件发送消息; Push - 允许您发送 Push 消息。
Garuda Fire MT4
Maldini Yoga Pratama
EA Garuda Fire MT4 .This is the logical development of EA Dragon Fire ultimate, with the addition of better logic and confirmation than before.   EA Garuda Fire MT4   is a trend following system for swing trading based on PLT indicator filtered by I-gentor LSMA. no need to add any indicators because everything is included in this EA code, so the trading decisions are simple and immediate without confusion that can result from the use of many indicators Only   10 download  of the EA left  at $69
Monalisa MACD
Valter Pegoraro
" MONALISA (acronym of MON itor A nd LIS t A ll) MACD" is an indicator based on the MACD Oscillator on all timeframes of any Currency Cross Pair. The indicator shows all Timeframes (from M1 to MN1) and colors in GREEN or RED that Timeframe that results in BUY or SELL based on the MACD Oscillator. This indicator is useful because it allows you to have a complete view of all Timeframes at the same time. Features Easy flexible settings: Detection of the MACD signal for all timeframes No setting le
SuperTrend MT4
KEENBASE SOFTWARE SOLUTIONS
KT SuperTrend is a modified version of the classic SuperTrend indicator with new useful features. Whether its Equities, Futures, and Forex, the beginners' traders widely use the Supertrend indicator.  Buy Signal: When price close above the supertrend line. Sell Signal: When price close below the supertrend line. Features A multi-featured SuperTrend coded from scratch. Equipped with a multi-timeframe scanner. The last signal direction and entry price showed on the chart. All kinds of MetaTrader
Reverse Engineered RSI   Introduction Reverse Engineered RSI transforms the way traders use the RSI indicator. Instead of displaying RSI in a separate oscillator window, this tool projects the key RSI levels — 30, 50, and 70 — directly onto the price chart . This allows traders to see where overbought, oversold, and equilibrium zones align with actual price levels — without switching charts or guessing momentum conditions. You get precise RSI-derived support and resistance levels right on the c
Stochastic Signals is a simple dashboard type indicator that displays the values of the stochastic oscillator on various instruments and time frames chosen by the user. The stochastic is usually used in many trading strategies, especially in countertrend systems when the price reaches overbought/oversold conditions. In addition, this indicator can be configured by the trader to show signals when the stochastic oscillator is in an overbought/oversold condition, when it crosses these levels or whe
Contact us for any custom order,   CodeYourTrade.com . The MACD Histogram measures the distance between the MACD line and the MACD signal line. Two important terms are derived from the MACD histogram are: ·          Convergence : The MACD histogram is shrinking in height. This occurs because there is a change in direction or a slowdown in the trend. When that occurs, the MACD line is getting closer to the MACD signal line. ·          Divergence : The MACD histogram is increasing in height (eith
This indicator is based on the MACD on one or more timeframes and on any Currency Cross Pair. The indicator generates an alert message when it detects a buy or sell signal. It also draws a vertical bar on the price chart: green for buy or red for sell, yellow if flat. Alert messages and Vertical bars for BUY or SELL, are generated when the MACD is consistent for all chosen timeframes else a FLAT signal is generated. Features Easy flexible settings: Detection of the MACD signal for one or more t
Ichimoku Signal Scanner
Mihails Babuskins
4 (1)
Ichimoku Signals Dashboard To test the indicator please download demo version  here. Find Ichimoku signals as easy as you can. Ichimoku is one of the most powerful trends recognition indicators. And it has valid signals for the trades. This indicator scans several symbols and time-frames by the Ichimoku to find all the signals that you want and show in a dashboard. It's easy to use, just drag it onto the chart. It's better to add  Ichimoku indicator  to chart before adding this indicator. Ichimo
The HTF Stochastic displays Stochastic oscillator from a higher time frame. For example: You can see D1 Stochastic on a M30 chart. It has all parameters available like a normal Stochastic. The HTF Stochastic is visible for all time frames below the one you setup. So if you choose H4 period you can see Stochastic oscillator from that time frame on H1, M30, M15, M5 and M1 chart. For M30 setup, you can have M30 Stochastic on M15, M5 and M1 chart.
Euro Gift EurUsd M15
Marek Kupka
3 (5)
Euro Gift (EURUSD M15) I am celebrating my birthday, so i will publish some EAs for FREE. This EA has been developed for EURUSD M15.  Strategy is based on ICHIMOKU indicator and has very little parameters - so its VERY ROBUST. It uses Stop pending orders with   ATR   Stop Loss . At 9:00 pm we are closing trading every Friday to prevent from weekly gaps. !!!Adjust these times to your broker time. Preset values are for UTC+2 only!!! For every candle the pending orders are modified to adapt the mar
FREE
IchiTrend ind
Anchor Trading S.R.L.S.
This indicator is based on Ichimoku kynko Hyo but personalized with We-Trading rules. Ichimoku  Trend Arrows As you can see, the indicator shows two types of arrows (signals): Big arrows to follow the big trends Minor arrows to re-enter on trend adding more trades With Ichi-Trend indi, you can follow the trend of the market. You can use it on Forex and on all CFDs and with all the fimeframe you like. Parameters Main parameters help trader to setup Ichimoku value as: tenkan_sen - default value
Infinity Trend Pro
Yaroslav Varankin
1 (1)
This is a trend indicator without redrawing Developed instead of the binary options strategy (by the color of the Martingale candlestick) Also works well in forex trading When to open trades (binary options) A signal will appear in the place with a candle signaling the current candle It is recommended to open a deal for one candle of the current timeframe M1 and M5 When a blue dot appears, open a deal up When a red dot appears, open a trade down. How to open trades on Forex. When a signal is rec
Description A colored universal indicator MACD Line (MA convergence-divergence indicator, shown as a histogram). The rising and falling of the indicator histogram can be colored. The indicator can be calculated as the standard one on the basis of a price or as a derivative on the basis of the following twelve other indicators included in the standard package of the MetaTrader 4 terminal: AD - an indicator of accumulation and distribution of volume. OBV - On Balance Volume. Volume - tick volume i
Gecko
Profalgo Limited
4.4 (10)
NEW PROMO: Only a few copies copies available at 349$ Next price: 449$ Make sure to check out our " Ultimate EA combo package " in our   promo blog ! Gecko runs a simple, yet very effective, proven strategy.  It looks for important recent high and lows and will trade the breakouts.  The actual execution of this strategy however, is what makes this EA truly shine.  Entry calculations and exit algorithms are not only unique but also very advanced. LIVE RESULTS: https://www.mql5.com/en/signals/75
EZT_Ichimoku_MTF Multitimeframe Ichimoku indicator. Display up to 4 different Ichimoku on the chart. Every line of every ichimoku is customizable, you can turn off/on or choose different thickness or color. You can choose to see only the cloud in multiple ichimokus. Optional info panel to identify the different Ichimokus. Works the same way like the original Ichimoku indicator.
Intraday Levels shows intraday levels grid for intraday trading Shows a grid for the day levels, gives you a guide to know the trend and to measure intraday trades (stop-loss and take-profit). Parameters are: Levels Mode: Basic mode: Shows highest, lowest and middle levels. Advanced mode: Shows highest, lowest, middle and intermediate levels. Fibonacci mode: Shows session Fibonacci retracements levels. Momentum mode: Shows delayed Advanced levels to identify momentum. Smooth Period (Momentum m
Binary Chronos – MT4 二元期权指标 缓存信号 :图表箭头信号便于进场并支持自动交易。 ️ 到期时间 :默认为 1 根K线。 趋势交易 :识别趋势方向,寻找最佳进场点并发出信号。 当前K线进场 :信号用于当前K线立即入场。 ️ 马丁策略 :首单失败时,在 下一根K线上进行一次马丁补仓 ,不超过一次。 LevelEn :此参数越高,信号质量和准确性越高。 适用于任意周期 :支持所有时间框架。 不重绘 :信号稳定可靠。 提醒功能 :弹窗和声音提示。 Binary Chronos — 精准顺势进场,信号不重绘,风险可控!            **************************************************************************                              
一目均衡多货币扫描仪表板 MT4 是一款功能强大的交易工具,旨在使用一目均衡表(Ichimoku Kinko Hyo)监控多个货币对和时间框架。它以网格格式组织信号,符号按基础货币和时间框架分组,范围从 M1 到 MN1。交易者可以启用或禁用特定时间框架以适应他们的策略。 该工具根据以下策略显示信号: Kijun Cross Strategy: 价格与均线(Kijun-sen)交叉时生成信号。 Kumo Breakout Strategy: 基于价格突破云(Kumo)的信号。 Chikou Span Confirmation Strategy: 使用迟行线(Chikou Span)确认信号。 Tenkan-Kijun Cross Strategy: 基于转换线(Tenkan-sen)和均线(Kijun-sen)交叉的短期信号。 Kumo Twist Strategy: 识别云(Kumo)的扭转以预测反转。 MT5版本可在此处找到: Ichimoku Cloud Multicurrency Scanner MT5 详细文档请点击此处: 文档 主要功能: 一目均衡集成:仪表板包含可定制的一
该产品的买家也购买
Gann Made Easy
Oleg Rodin
4.83 (155)
Gann Made Easy 是一个专业且易于使用的外汇交易系统,它基于使用先生理论的最佳交易原则。 W.D.江恩。该指标提供准确的买入和卖出信号,包括止损和获利水平。您甚至可以使用推送通知在旅途中进行交易。 购买后请联系我,免费获取交易提示、奖金和 GANN MADE EASY EA 助手! 您可能已经多次听说过江恩交易方法。通常 Gann 的理论不仅对于新手交易者而且对于那些已经有一定交易经验的人来说都是非常复杂的东西。这是因为江恩的交易方法在理论上并不那么容易应用。我花了几年时间来完善这些知识,并将最好的原则应用到我的外汇指标中。 该指标非常易于应用。您所需要的只是将其附加到您的图表并遵循简单的交易建议。该指标不断进行市场分析工作并寻找交易机会。当它检测到一个好的入口点时,它会为您提供一个箭头信号。该指标还显示止损和获利水平。 换句话说,当您像先生一样进行交易时,该指标会为您提供最佳江恩建议。江恩亲自告诉你此时此刻该做什么。但最好的部分是您不需要了解任何有关江恩交易原则的知识,因为该指标会为您完成整个市场分析工作。
GOLD Impulse with Alert
Bernhard Schweigert
4.64 (11)
这个指标是我们2个产品 Advanced Currency IMPULSE with ALERT  +   Currency Strength Exotics 的一个超级组合。 它适用于所有时间框架,并以图形方式显示8种主要货币和一种符号的强势或弱势冲动! 该指标专门用于显示任何符号的货币强度加速,如黄金、异国货币对、商品、指数或期货。这是它的第一个指标,任何符号都可以被添加到第9行,以显示黄金、白银、石油、DAX、US30、MXN、TRY、CNH等的真实货币强度加速(冲动或速度)。 建立在新的基础算法上,它使识别和确认潜在的交易更加容易。这是因为它以图形方式显示了一种货币的强势或弱势是否正在加速,并测量了这种加速的速度--把它想象成你汽车中的速度表。当你加速时,事情显然会发生得更快,这在外汇市场上也是一样的,即如果你配对的货币正在向相反的方向加速,你就会发现一个潜在的有利可图的交易。 动态市场斐波那契28水平被用作警报触发器,将适应市场活动。如果冲动击中黄色触发线,你将收到警报。然后你就知道作为一个交易员应该做什么。货币对和方向已经给出。只需点击警报按钮,就可以切换到该货
Scalper Inside PRO
Alexey Minkov
4.74 (69)
An exclusive indicator that utilizes an innovative algorithm to swiftly and accurately determine the market trend. The indicator automatically calculates opening, closing, and profit levels, providing detailed trading statistics. With these features, you can choose the most appropriate trading instrument for the current market conditions. Additionally, you can easily integrate your own arrow indicators into Scalper Inside Pro to quickly evaluate their statistics and profitability. Scalper Inside
Game Changer Indicator
Vasiliy Strukov
4.09 (22)
Game Changer 是一款革命性的趋势指标,适用于任何金融工具,可将您的 Metatrader 平台升级为强大的趋势分析工具。它适用于任何时间框架,能够帮助您识别趋势、发出潜在反转信号、作为追踪止损机制,并提供实时警报,以便您及时响应市场反应。无论您是经验丰富的专业人士,还是寻求优势的初学者,这款工具都能让您充满信心、纪律严明地进行交易,并清晰地理解潜在的趋势动态。该指标支持重绘功能。 购买后请立即联系我,即可获得专属赠品。您可以免费获得我们的“强支撑”和“趋势扫描器”指标,请私信联系我。 请注意,我不会在 Telegram 上出售我的 EA 或特殊设置,它们仅通过 Mql5 提供,我的设置文件也仅发布在我的博客上。谨防诈骗,切勿从其他任何人处购买任何设置。 设置 启用趋势变化提醒 - 真/假 - 趋势变化时在图表上显示提醒 发送推送通知 - 真/假 - 启用向手机推送提醒通知 发送邮件通知 - 真/假 - 趋势变化时向邮箱发送邮件通知
RFI levels PRO
Roman Podpora
5 (1)
该指标能够准确显示反转点和价格回落区域。     行业领军人物 。您能洞察新趋势的形成,并以最高的精准度做出决策,掌控每一笔交易。 与……结合时,展现其最大潜力     趋势线专业版   指标  VERSION MT5 该指标显示的内容: 新趋势开始时的反转结构和反转水平及其激活。 显示屏   获利了结   和   止损   风险回报比最低的水平     RR 1:2       。 具有智能减值逻辑的止损。 显示指定指标中两种趋势类型的反转形态。 指标: 根据     趋势线     (全球趋势变化) 潮流专业版     (趋势快速变化) 简单有效   扫描器   实时趋势(新增)。 多时间框架工具筛选。 展示   利润   在 LOGIC AI 信号之后。 以下列出今日走势积极的金融工具。(RB键) 能够为终端启用通知(警报)功能,并向移动设备推送通知。 逻辑人工智能     — 利用人工智能寻找最佳切入点。 只有在启用 MTF(多时间框架分析)模式时,该功能才可用。 兼容性。 当与趋势线指标结合使用时,该指标能发挥其最大潜力。 这     RFI LEVELS PRO    
Miraculous 指标 – 100% 不重绘的外汇和二元期权工具,基于江恩九方图 这个视频介绍的 Miraculous 指标 是一款专为外汇和二元期权交易者开发的高精度、强大交易工具。该指标的独特之处在于它建立在传奇的 江恩九方图 和 江恩振动法则 之上,使其成为现代交易中可用的最精确预测工具之一。 Miraculous 指标 完全不重绘 ,这意味着它的信号在 K 线收盘后不会改变或消失——你看到的就是你得到的。这为交易者提供了可靠且一致的基础,让他们能够自信地进出场交易。 主要特点: 基于江恩九方图和江恩理论构建 100% 不重绘的信号系统 适用于所有时间周期(M1、M5、H1、H4、日线、周线) 适用于外汇和二元期权交易 清晰的买卖信号,准确率高 可用于剥头皮、日内交易或波段交易 兼容大多数 MT4 平台 这款工具旨在帮助初学者和专业交易者做出更好、更明智的决策。无论您是交易货币、指数还是二元期权,Miraculous 指标都将为您在市场中提供所需的优势。
M1 Sniper
Oleg Rodin
5 (19)
M1 SNIPER 是一款易于使用的交易指标系统。它是一个专为 M1 时间框架设计的箭头指标。该指标可以作为独立的系统在 M1 时间框架下进行剥头皮交易,也可以作为您现有交易系统的一部分使用。虽然该交易系统专为 M1 时间框架交易而设计,但它也可以用于其他时间框架。我最初设计此方法是为了交易 XAUUSD 和 BTCUSD。但我发现这种方法在其他市场交易中也同样有用。 指标信号既可以顺势交易,也可以逆势交易。我教授一种特殊的交易技巧,帮助您利用指标信号进行双向交易。该方法基于使用特殊的动态支撑位和阻力位区域。 购买后,您可以立即下载 M1 SNIPER 箭头指标。此外,我还为所有 M1 SNIPER 工具用户免费提供下方屏幕截图所示的 Apollo Dynamic SR 指标!这两个指标的组合可以帮助您更轻松、更准确地利用 M1 时间框架进行交易。 购买后请联系我,免费获取交易提示和奖励指标! 祝您交易成功!
Currency Strength Wizard
Oleg Rodin
4.84 (57)
货币强度向导是一个非常强大的指标,为您提供成功交易的一体化解决方案。该指标使用多个时间范围内所有货币的数据来计算这个或那个外汇对的力量。此数据以易于使用的货币指数和货币电力线的形式表示,您可以使用它们来查看这种或那种货币的力量。 您所需要的只是将指标附加到您要交易的图表上,该指标将向您显示您交易的货币的真实强度。该指标还向您显示买卖量压力的极值,您可以在顺势交易时利用这些压力。该指标还显示了基于斐波那契的可能目标。该指标可用于各种交易时间范围。该指标支持各种货币对的交易。 该指标为您提供所有类型的警报,包括推送通知。 购买后请联系我。我将与您分享我的交易技巧,并免费为您提供丰厚的红利指标! 祝您交易愉快,获利丰厚!
Currency Strength Exotics
Bernhard Schweigert
4.88 (33)
目前8折优惠! 对任何新手或专家交易者来说都是最好的解决方案! 这个指标是专门用来显示任何符号的货币强度,如异国货币对、商品、指数或期货。它是同类产品中的第一个,任何符号都可以添加到第9行,以显示黄金、白银、石油、DAX、US30、MXN、TRY、CNH等的真实货币强度。这是一个独特的、高质量的、负担得起的交易工具,因为我们已经纳入了一些专有的功能和一个新的公式。想象一下,你的交易将如何改善,因为你能够准确地确定新趋势或剥头皮机会的触发点? 用户手册:点击这里   https://www.mql5.com/en/blogs/post/708876 它适用于所有时间框架。你将很快能够看到TREND! 根据新的基础算法设计,它使识别和确认潜在交易变得更加容易。这是因为它以图形方式显示了8种主要货币和一种符号的强弱。 该指标显示了8种主要货币(澳元加元瑞士法郎欧元英镑日元新西兰美元)的强弱线,再加上一个符号! 该指标显示了符号的真实价值。例如:对于XAUUSD(黄金):价格以美元报价。如果黄金在上涨,你怎么能知道是黄金的强势还是美元的弱势?只有当黄金走强时,我们才会进行交易。该指
訂閱指標注意事項 此信號只支援電腦版MT4 不支援MT5、手機、平板 指標只顯示當日進場箭頭 非直播指標顯示歷史箭頭 (直播為展示用) 指標為交易輔助性質 非EA自動交易 無跟單功能 指標只標示進場位置 無出場(止盈)指示 進場止損點位設定30-50 PIPS 或是前高前低做為防守 止損不需拉太遠 紅色箭頭為多方進場訊號 綠色箭頭為空方進場訊號 撐阻力強度用箭頭大小表示 此指標適用於波段策略 不適合當沖策略盤整 多空反轉時不適用 指標載入後 右下角都會預設顯示盤整 載入指標一小時後 才會顯示多空 加入Youtube頻道會員 可參加每個月一次實體抽獎活動(台灣以外地區,獎品折現金用Paypal匯出) 每月抽獎時間為非農數據公布當週的週末盤勢分析(2100) 得獎者必須抽獎時在線上,逾期不候
Trend Lines PRO
Roman Podpora
5 (1)
TREND LINES PRO 帮助您了解市场真正的方向转变点。该指标显示真实的趋势反转点以及主要参与者重新入场的时机。 您可以看到 BOS线、 趋势变化和更高时间框架的关键水平——无需复杂的设置或不必要的干扰。信号不会重绘,并在K线收盘后仍然保留在图表上。 VERSION MT 5    -   与……搭配使用时,可发挥其最大潜力   RFI LEVELS PRO 指示器 该指标显示的内容: 实际变化 趋势(BOS 线) 一旦信号出现,它就始终有效!这与会重绘的指标有着重要的区别,后者可能会发出信号后又改变信号,从而导致资金损失。现在,您可以更精准、更准确地进入市场。此外,还有一个功能,会在箭头出现后为K线着色,直到达到目标价位(止盈)或出现反转信号为止。 重复条目   以及主要玩家的充值 为了提高寻找入场点时的视觉清晰度,我们创建了一个模块,该模块首先显示买入/卖出区域,并在该区域内寻找最佳入场点。此外,我们还加入了智能逻辑来管理止损位,该逻辑会随着时间的推移逐步降低止损位的大小,从而降低入场交易时的初始风险(移动止损位)。 信号强度水平(BOS) 该指标采用三个显著性等级来衡量
Are you looking for a simple and reliable indicator that can help you spot market swing points easily? Do you want clear buy and sell signals that work on any timeframe and any trading instrument? Buy Sell Signal Pro is designed to do exactly that. It helps traders identify important market turning points and understand the current market structure in a clear and easy way. This indicator detects Higher Highs (HH), Higher Lows (HL), Lower Highs (LH), and Lower Lows (LL) so you can quickly see wh
目前八折优惠! 对任何新手或专家交易者来说都是最好的解决方案! 这个仪表板软件适用于28种货币对。它基于我们的两个主要指标(高级货币强度28和高级货币冲动)。它对整个外汇市场提供了一个伟大的概述。它显示高级货币强度值,货币运动速度和28个外汇对在所有(9)时间段的信号。想象一下,当你可以使用图表上的单一指标观察整个市场,以确定趋势和或剥头皮的机会时,你的交易将得到改善 我们已经在这个指标中建立了一些功能,使你更容易识别强势和弱势货币,同时识别和确认潜在的交易。该指标以图形方式显示货币的强势或弱势是增加还是减少,以及它在所有时间段的表现。 增加的新功能是动态市场斐波那契水平,它适应当前的市场条件变化,这是一个已经在我们的高级货币强度28和高级货币冲动指标中使用的成熟的加分项。 在交易时,总是将弱势货币和强势货币配对,这个新指标将帮助你做到这一点。 用户手册:点击这里  https://www.mql5.com/en/blogs/post/708783 特点  显示每个时间段的ACS28和GAP-speed(冲动)的货币强度值。 列:颜色代码以7种颜色显示货币强度:强势
Volatility Trend System - a trading system that gives signals for entries. The volatility system gives linear and point signals in the direction of the trend, as well as signals to exit it, without redrawing and delays. The trend indicator monitors the direction of the medium-term trend, shows the direction and its change. The signal indicator is based on changes in volatility and shows market entries. The indicator is equipped with several types of alerts. Can be applied to various trading ins
Dynamic Forex28 Navigator
Bernhard Schweigert
4.43 (7)
Dynamic Forex28 Navigator - 下一代外汇交易工具。 当前 49% 折扣。 Dynamic Forex28 Navigator 是我们长期流行的指标的演变,将三种功能合二为一: 高级货币强度 28 指标 (695 条评论)+ 高级货币 IMPULSE 带警报 (520 条评论)+ CS28 组合信号(奖励)。 有关指标的详细信息 https://www.mql5.com/en/blogs/post/758844 下一代强度指标提供什么? 您喜欢的原始指标的一切,现在通过新功能和更高的精度进行了增强。 主要特点: 专有货币强度公式。  所有时间范围内的平滑和准确的强度线。 非常适合识别趋势和精确进入。 动态市场斐波那契水平(市场斐波那契)。  此指标独有的独特功能。 斐波那契应用于货币强度,而不是价格图表。 适应实时市场活动以获得准确的反转区域。 实时市场动量。  第 9 行显示市场是活跃还是被动。 对于定时交易至关重要。 全面的警报和显示。  每种货币最强的买入和卖出动量。 ​​28 对的双重动量买入和卖出。 超买/超卖警告外部范围和止损。 反转
Gold Scalper Super
Aleksandr Makarov
5 (2)
Gold Scalper Super is an easy-to-use trading system. The indicator can be used as a standalone scalping system on the M1 time frame, as well as part of your existing trading system. Bonus: when purchasing an indicator, Trend Arrow Super is provided free of charge, write to us after purchase. The indicator 100% does not repaint!!! If a signal appears, it does not disappear! Unlike indicators with redrawing, which lead to the loss of a deposit, because they can show a signal and then remove it.
Meravith
Ivan Stefanov
5 (3)
做市商工具。 Meravith 将: 分析所有时间周期并显示当前正在运行的趋势。 标注流动性区域(成交量均衡区),即多头与空头成交量相等的位置。 在您的图表上直接显示来自不同时间周期的所有流动性水平。 生成并展示基于文本的市场分析供您参考。 根据当前趋势计算目标位、支撑位和止损位。 计算交易的风险回报比。 根据您的账户余额计算仓位大小,并估算潜在利润。 在市场出现重大变化时,Meravith 还会发出警告。 指标的主要线条: 多头/空头成交量衰竭线 —— 作为目标位使用。 趋势线 —— 指示市场趋势方向。根据市场是多头还是空头而改变颜色,并作为趋势支撑。其颜色主要反映市场情绪。 成交量均衡线(Eq)—— Eq(Volume Equilibrium)是系统的核心。它表示买卖双方成交量的平衡点,即市场流动性所在位置。向上突破 Eq 表示多头倾向,向下突破 Eq 表示空头倾向。突破后,应等待回调——当价格回到相反趋势的偏离线或衰竭线附近时。 使用方法:只需将其添加到图表中。 Meravith 可以分析一切——趋势和回调。 趋势线与某条成交量衰竭线之间的距离越大,说明该方向的成交量越高。 趋
FX Volume
Daniel Stein
4.63 (38)
FX Volume:从经纪商视角洞察真实市场情绪 简要概述 想要提升您的交易策略? FX Volume 可提供零售交易者和经纪商的持仓实时数据——远早于诸如 COT 之类的延迟报告。不论您希望获得持续稳定的收益,还是想在市场中多一分制胜的砝码, FX Volume 都能帮您识别重大失衡、确认突破以及完善风险管理。立即开启体验,让真实的成交量数据为您的交易决策带来革新! 1. 为什么 FX Volume 对交易者格外有用 极具准确度的早期预警 • 快速捕捉有多少交易者正在买入或卖出某个货币对——比大多数人提前一步。 • FX Volume 是 唯一 能够整合多家零售经纪商真实成交量数据并以简洁方式呈现的工具。 强力风险管理 • 及时识别多头或空头仓位的巨大不平衡,这往往预示着潜在的趋势反转,帮助您更自信地设置止损和目标位。 • 独家而真实的数据让每一次交易决策更具可靠性。 优化进场与出场点 • 发现“过度集中”的交易(大多数交易者都在同一方向),并通过真实成交量来确认突破。 • 避免依赖常见指标可能带来的误导信号,而是利用真实的实时成交量。 适配各种交易策略 • 将 FX
Apollo SR Master
Oleg Rodin
5 (1)
Apollo SR Master 是一款支撑/阻力指标,其特殊功能使利用支撑/阻力区域进行交易更加便捷可靠。该指标通过检测局部价格顶部和底部,实时计算支撑/阻力区域,没有任何时间延迟。为了确认新形成的支撑/阻力区域,该指标会显示特殊信号,表明该支撑/阻力区域可以作为实际的卖出或买入信号。在这种情况下,支撑/阻力区域的强度会增强,因此从该区域进行交易的成功率也会更高。这正是该指标的核心理念。 SR区域也使止损和止盈的操作更加便捷。根据信号方向,可以将SR区域上方或下方的空间用作止损位。此外,相对的SR区域也可以用作潜在的止盈区域。 我还免费向所有 Apollo SR Master 指标的用户提供我的“Apollo 价格行为系统”指标。这两个指标结合使用将帮助您找到更好的入场点。 购买后请联系我,即可免费获得我的交易技巧以及我的“阿波罗价格行为系统”指标作为赠品!
IQ Gold Gann Levels
INTRAQUOTES
5 (4)
Presenting one-of-a-kind Gann Indicator for XAUUSD IQ Gold Gann Levels is a non-repainting, precision tool designed exclusively for XAUUSD/Gold intraday trading. It uses W.D. Gann’s square root method to plot real-time support and resistance levels, helping traders spot high-probability entries with confidence and clarity. William Delbert Gann (W.D. Gann) was an exceptional market analyst whose trading technique was based on a complex blend of mathematics, geometry, astrology, and ancient calcul
PRO Renko System
Oleg Rodin
5 (30)
PRO Renko Arrow Based System for trading renko charts.  准确的信号交易任何外汇工具. 另外,我将免费提供系统的附加模块! PRO Renko系统是RENKO图表上高度准确的交易系统。该系统是通用的。 该交易系统可应用于各种交易工具。 该系统有效地中和了所谓的市场噪音,打开了获得准确反转信号的通道。 该指标易于使用,只有一个参数负责产生信号。 您可以很容易地使算法适应您感兴趣的交易工具和renko酒吧的大小。 我很乐意通过提供任何咨询支持来帮助所有客户有效地使用该指标。 祝您交易成功!购买后,立即写信给我! 我将与您分享我的建议和我的renko发电机。 另外,我将免费提供系统的附加模块!
Atomic Analyst
Issam Kassas
5 (3)
首先值得强调的是,该交易指标是非重绘、非延迟的指标,这使其成为手动和机器人交易的理想选择。 用户手册:设置、输入和策略。 Atomic Analyst是一种PA价格行动指标,利用价格的力量和动量来寻找市场上更好的机会。配备了高级过滤器,可帮助去除噪音和假信号,并提高交易潜力。使用多层复杂的指标,Atomic Analyst扫描图表,并将复杂的数学计算转化为任何初学者都能理解并用来做出一致交易决策的简单信号和颜色。 “Atomic Analyst”是专为新手和经验丰富的交易者量身定制的综合交易解决方案。它将高级指标和一流功能融合为一体的交易策略,使其成为所有类型交易者的多功能选择。 日内交易和剥头皮策略:专为快速准确的日内交易和短期交易而设计。 日内和摆动交易策略:可用作追求价格大幅波动的日内和摆动交易者的可靠工具。 多货币和市场:凭借其可靠的精度,在不同的工具和市场上运作。 多个时间框架:可在多个时间框架上使用,性能良好。 稳定性:所有指标均不重绘、不重绘和不滞后,确保可靠的信号。 信号清晰度:提供箭头信号,用于清晰的入场和出场点。 实时警报:通过交易入场、SL和TP警报通知交易者
El indicador "MR BEAST ALERTAS DE LIQUIDEZ" es una herramienta avanzada diseñada para proporcionar señales y alertas sobre la liquidez del mercado basándose en una serie de indicadores técnicos y análisis de tendencias. Ideal para traders que buscan oportunidades de trading en función de la dinámica de precios y los niveles de volatilidad, este indicador ofrece una visualización clara y detallada en la ventana del gráfico de MetaTrader. Características Principales: Canal ATR Adaptativo: Calcula
Pips Stalker
Abdulkarim Karazon
5 (2)
Pips Stalker是一种多头空头箭头型指标,该指标帮助各级别交易者做出更好的市场交易决策,该指标从不重新绘制,并以RSI作为主要信号逻辑,一旦给出箭头,它就不会重新绘制或反绘,箭头也不会延迟。 PIPS STALKER ARROW的功能 : 统计面板 这是一个独特的信息仪表盘,显示整体胜率百分比和有用统计数据,如连续最大胜负交易数,以及其他有用信息。 TP和SL,内置资金管理 该指标在每个箭头上都标注了TP和SL对象,因此交易者内置了资金和风险管理,SL基于ATR,TP基于当前ATR SL价值的风险与回报比。 无需重新涂色,高度可调 该指标提供了多种提升信号质量的选项,使其在任何交易对上都能正常工作,只需少量周期调整,面板会显示当前设置和期间是否有利可图。 推荐时间框架:M1。 重新调整启动资本:100美元。 推荐账户类型:原始价差。
Advanced Currency Strength28 Indicator
Bernhard Schweigert
4.91 (657)
目前40%的折扣 任何新手或专家交易者的最佳解决方案! 这个指标是一个独特的、高质量的、可负担得起的交易工具,因为我们纳入了一些专有的功能和一个新的公式。只需一个图表,你就可以读出28个外汇对的货币强度!想象一下,你的交易将如何得到改善,因为你的交易是在你的手中进行的。想象一下,你的交易将如何改善,因为你能够准确地确定新趋势或剥头皮机会的触发点? 用户手册:点击这里  https://www.mql5.com/en/blogs/post/697384 这是第一本,原版的! 不要买一个毫无价值的崇拜者的克隆品。 特别的 子窗口中的箭头显示强劲的货币势头GAP将指导你的交易! 当基础货币或报价货币处于超卖/超买区域(外盘斐波那契水平)时,在个人图表的主窗口中出现警告信号。 当货币力量从外围区间回落时,回撤/反转警报。 十字星模式的特别警报 可选择多个时间框架,以快速查看趋势! 货币强度线在所有的时间框架中都非常平稳,当使用较高的时间框架来识别总体趋势,然后使用较短的时间框架来确定精确的入口时,效果非常好。你可以根据自己的意愿选择任何时间框架。每个时间框架都由其自身进行了优化。
IQ FX Gann Levels
INTRAQUOTES
5 (2)
IQ FX Gann Levels a precision trading indicator based on W.D. Gann’s square root methods . It plots real-time, non-repainting support and resistance levels to help traders confidently spot intraday and scalping opportunities with high accuracy. William Delbert Gann (W.D. Gann) was an exceptional market analyst, whose trading technique was based on a complex blend of mathematics, geometry, astrology, and ancient mathematics which proved to be extremely accurate. Setup & Guide:  Download  MT5 Ver
FX Power MT4 NG
Daniel Stein
4.95 (21)
FX Power:分析货币强度,助您做出更明智的交易决策 概述 FX Power 是一款专业工具,帮助您全面了解主要货币和黄金在任何市场条件下的真实强度。通过识别强势货币用于买入,弱势货币用于卖出, FX Power 简化了交易决策,并帮助您发现高概率的交易机会。不论您是想跟随趋势还是通过极端的 Delta 值预测反转,这款工具都能完美适应您的交易风格。别再盲目交易——用 FX Power 让您的交易更加智慧。 1. 为什么 FX Power 对交易者极具价值 实时货币和黄金强度分析 • FX Power 实时计算并显示主要货币和黄金的相对强度,助您全面了解市场动态。 • 监控领先或落后资产,轻松识别值得交易的货币对。 全面的多时间框架视图 • 跟踪短期、中期和长期时间框架的货币和黄金强度,以便将您的交易策略与市场趋势保持一致。 • 无论是快进快出的短线交易还是更长期的投资策略, FX Power 都能为您提供所需的信息。 Delta 动态分析用于趋势和反转 • 极端 Delta 值常常预示反转机会,而平缓的 Delta 变化则确认趋势延续。 • 使用 Delta 分析,轻
Advanced Supply Demand
Bernhard Schweigert
4.91 (298)
现在优惠 40%! 任何新手或专业交易者的最佳解决方案! 该指标是一款独特、高质量、且价格合理的交易工具,因为我们已经整合了许多专有功能和新公式。 依据此更新,您将能够显示双重时间帧区域。 您不仅可以显示一个较高的时间帧,还可以同时显示图表时间帧,加上更高的时间帧:显示嵌套时区。 供需双方所有交易者都会喜欢它。 :) 重要信息披露 高级供需的最大潜力,请访问 https://www.mql5.com/zh/blogs/post/720245   想象您的交易如何得以改善,是因为您能够精准定位入场或目标位吗? 构建于新的底层算法,它可以更轻松地识别出买卖双方之间的潜在失衡。 这是因为它以图形方式展示供需最强劲区域,及其过去的表现(显示旧区域)。 这些功能旨在帮助您更轻松地发现最佳入场区域和价位。 现在您可以针对您的交易品种和时间帧来优化和编辑区域强度! 高级供需指标适用于所有产品和时间帧。 它是一个新的公式,非常新的功能是两个区域强度函数可由用户输入进行调整! 这在交易中是一大优势。 当您学习如何使用专有功能,例如带有价格游离最小 X 因子的区域强度时,您能够判断该区域强劲与否。 供需
Harmonic Pattern Plus MT4
Young Ho Seo
4.44 (18)
Introduction Harmonic Patterns are best used to predict potential turning point. Traditionally, Harmonic Pattern was identified manually connecting peaks and troughs points in the chart. Manual harmonic pattern detection is painfully tedious and not suitable for everyone. You are often exposed under subjective pattern identification with manual pattern detection. To avoid these limitations, Harmonic Pattern Plus was designed to automate your harmonic pattern detection process. The functionality
Advanced Currency IMPULSE with ALERT
Bernhard Schweigert
4.9 (490)
目前40%的折扣!! 对任何新手或专家交易者来说都是最好的解决方案! 这个指标是一个独特的、高质量的、负担得起的交易工具,因为我们已经纳入了一些专有的功能和一个秘密的公式。只需一张图表,它就能给出所有28种货币对的警报。想象一下,你的交易将如何改善,因为你能够准确地确定新趋势或剥头皮机会的触发点 建立在新的基础算法上,它使识别和确认潜在交易变得更加容易。这是因为它以图形方式显示了一种货币的强势或弱势是否正在加速,并测量了这种加速的速度--把它想象成你汽车中的速度表。当你加速时,事情显然会发生得更快,这在外汇市场上也是一样的,即如果你配对的货币正在向相反的方向加速,你就会发现一个潜在的有利可图的交易。 货币动量的垂直线和箭头将指导你的交易! 动态的市场斐波那契23水平被用作警报触发器,将适应市场活动。如果冲动触及黄色触发线,您将在MetaTrader或您的电子邮件或推送警报中收到警报。然后你就知道作为一个交易员应该做什么。货币对和方向已经给出。只要点击警报按钮,就可以切换到该货币对或打开一个新的图表,以便进一步分析。警报级别可以通过用户输入来改变,可以选择3个敏感度级别。 尽
作者的更多信息
The Super Trend is one of the best trend-following indicator for MT5 platforms. It's working fine for real-time trend alerts and accurate signals and it help to identify the best market entry and exit positions.  This indicator is the tool you can  refers to a trend following overlays. It contains two major parameters: the period and the multiplier. Besides, traders should consider default values that include 10 for every true range aтd 3 for the multiplier. 2 Types TP SL you set in input Point
Half Trend TP SL
Jalitha K Johny
Half Trend TPSL Buy Sell Indicator calculates the open and close of the price bars over the selected period of time and applies its own  calculation method to find an average line of the price movement.  ATR based Take Profit and Stop Loss ATR is a measure of volatility over a specified period of time. The most common length is 14, which is also a common length for oscillators, such as the relative strength index (RSI) and stochastics. A higher ATR indicates a more volatile market, while a lowe
Advanced Camarilla Calculator is one of the most commonly used trading calculators. This calculator can be used to generate levels. Scenario 1 Open price is between H3 and L3 For Long  - Wait for the price to go below L3 and then when it moves back above L3, buy. Stop loss will be when price moves below L4. Target1 - H1, Target2 - H2, Target3 - H3  For Short  -  Wait for the price to go above H3 and then when the price moves back below H3, sell. Stop loss will be when price moves above H4. Targe
Trend Analyser
Jalitha K Johny
Multi Trend Analyzer MT4 indicator provides signals from the following technical trading indicators: RSI, STOCH, STOCHRSI, MACD, ADX, Williams % R, ATR, Oscillator, ROC and Bull/Bear Power. It supports all time frames, from the 1 minute up to the monthly charts. You can change all indicator inputs. Indicator provide total trend summary. We can easily analysis and study market movement .
Super Trend Filter Indicator
Jalitha K Johny
4.5 (4)
Super Trend Filter Indicator Super trend Arrow Consider as a Master Candle , If super trend in Buy signal , then signal candle calculate as master candle  and master candle close above the open candle then calculate filter Buy Arrow.  If super trend in Sell signal , then signal candle calculate master candle  and master candle close below the open candle calculate filter Sell Arrow. 3 Target with Trailing Stop Loss 
Multi Indicator Scanner
Jalitha K Johny
5 (1)
Multi Indicators Scanner Indicator Scan  ADX ,Moving Average ,ENVELOPE ,SAR , MACD ,RSI  and ATR . We can change all input parameters in chart window. scanner works Multiple Time Frame we can change Timeframe .  Symbol button based on Trend color , we can click button and open chart .  We can also save templates in input.   Default settings Time Frame   1Hour Templates Name  Default Auto Arrange Chart  true
Fibonacci calculator is used with Elliot Waves, it can generate remarkable results. A trader could use these levels or ratios to find high probability trades with very small stop loss. You may also use these ratios to find Elliott Waves extensions and to book profit near those levels. For Elliot Wave experts, Fibonacci calculator is a highly useful tool that can assist them in calculating Fibonacci extension and retracement levels for the market price. The indicator proves itself as a useful one
This MACD Magic indicator coded due to inspired in a another similar indicator ,Here Macd Magic calculate Double trend confirmation. With ATR Ratio Based TP point , ATR value input are available in input settings . MACD Magic indicator provides Accurate signals on all Major currency pair and stocks. This indicator Very easy to analysis trend and set target point 
Wolfe Wave Scanner
Jalitha K Johny
4.5 (2)
Wolfe Waves scanner - It scans all the Symbols and identify the movement of price and it gives confidence in trade. It automatically plots  fifth wave breaks out of the channel. According to the theory behind the pattern, a line drawn from the point at the beginning of the first wave and passing through the beginning of the fourth wave predicts a target price for the end of the fifth wave. If a trader properly identifies a Wolfe Wave as it forms, the beginning of the fifth wave represents an op
Atr Mtf Trend
Jalitha K Johny
The Average True Range (ATR) is a tool to measure volatility. ATR MTF (Multi Time Frame) indicator provides all timeframe trends helps to identify in which kind of volatility environment the market .This indicator can be used with any Trading Systems for additional confirmation of trading entries or exits. It is a very helpful tool to calculate Targets and Stops according the current market conditions.
Half Trend TPSL Buy Sell Indicator calculates the open and close of the price bars over the selected period of time and applies its own  calculation method to find an average line of the price movement.  ATR based Take Profit and Stop Loss ATR is a measure of volatility over a specified period of time. The most common length is 14, which is also a common length for oscillators, such as the relative strength index (RSI) and stochastics. A higher ATR indicates a more volatile market, while a lowe
An RSI (Relative Strength Index) MT4 (MetaTrader 4) scanner is a tool used in forex trading to identify overbought or oversold conditions across multiple currency pairs and timeframes. The RSI is a momentum oscillator that measures the speed and change of price movements, typically used to identify potential reversal points in the market. Key Features and Functions of an RSI MT4 Scanner: Multiple Timeframe Analysis : The scanner can analyze various timeframes (e.g., 1 minute, 5 minutes, 15 minut
Product Description: MT4 Trade Copier with Advanced Features MT4  Trade Copier is designed to streamline and enhance your trading experience by allowing seamless replication of trades across multiple accounts. It offers advanced features to cater to different trading needs and preferences. Features: Master/Slave Selection: Easily choose between master and slave modes to manage trades effectively. Multiplier for Slave Accounts: Set a multiplier to adjust the size of trades copied to slave a
BB Scanner MT4  is a powerful, next-generation market scanner that detects Bollinger Bands breakouts across multiple symbols and timeframes. It provides a modern, interactive dashboard that displays signals, entry price, target levels, stop loss, and real-time status — all in one place. Key Features Multi-Symbol & Multi-Timeframe Scanning (auto or custom list) Precise BB Breakout Detection (Buy/Sell with ATR-based targets) Automatic Target 1, Target 2, Stop Loss calculation ️ Modern
A HalfTrend scanner for MT5 (MetaTrader 5) is a technical analysis tool designed to help traders identify trend reversals and trade opportunities in the market. The HalfTrend indicator itself is based on price movements and a specific algorithm that identifies changes in market direction. Here’s a detailed description of an MT5 HalfTrend scanner: Overview The MT5 HalfTrend scanner is an advanced tool that scans multiple currency pairs or financial instruments for potential trend reversal signals
Super Trend Filter Indicator SuperTrend Filter V5.2 MT5 Indicator, as provided in the code, is a custom technical analysis tool designed for  MetaTrader 5 (MT5) to identify market trends, provide trading signals, and display key price levels with a visually appealing interface. Super trend Arrow Consider as a Master Candle, If super trend in Buy signal, then signal candle calculates as master candle  and master candle close above the open candle then calculate filter Buy Arrow.  If super tre
MACD Multi Time Frame Scanner MACD Scanner MT5 is a powerful and easy-to-use dashboard tool that scans the MACD indicator across multiple symbols and multiple timeframes in real-time. It gives you a complete market overview at a glance, helping you spot bullish and bearish MACD crossovers instantly — without switching between charts. 1. Multi-Symbol / Multi-Timeframe Scanning Allow user to set a watchlist (symbols to scan). Scan across multiple timeframes (M1 → MN). Show signals (Bullish / Beari
筛选:
无评论
回复评论