KT Renko Patterns MT5

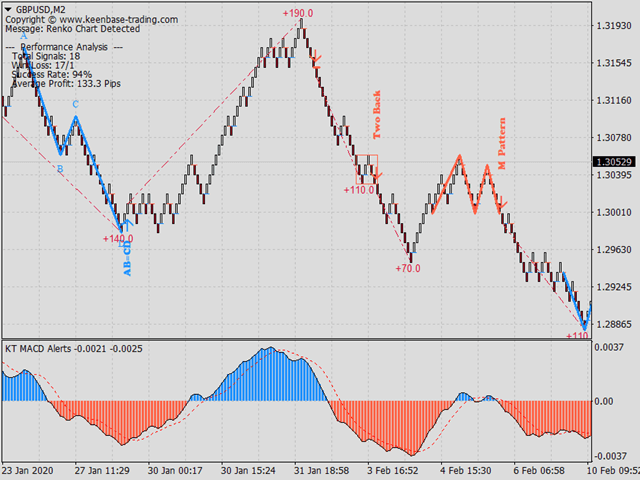
KT Renko Patterns 会逐砖扫描整个 Renko 图表,寻找那些在各种金融市场中被交易者频繁使用的著名图表形态。

与基于时间的图表相比,Renko 图由于其简洁清晰的特性,更容易识别图表形态,尤其适合基于形态的交易策略。

KT Renko Patterns 包含多种常见的 Renko 图形模式,其中许多都在 Prashant Shah 所著的《用 Renko 图表实现盈利交易》一书中有详细说明。

基于 KT Renko Patterns 指标开发的 100% 自动交易EA已发布,点击这里了解 - KT Renko Patterns EA


特点

  • 可交易多达八种清晰明确的 Renko 图形模式,无任何模糊。
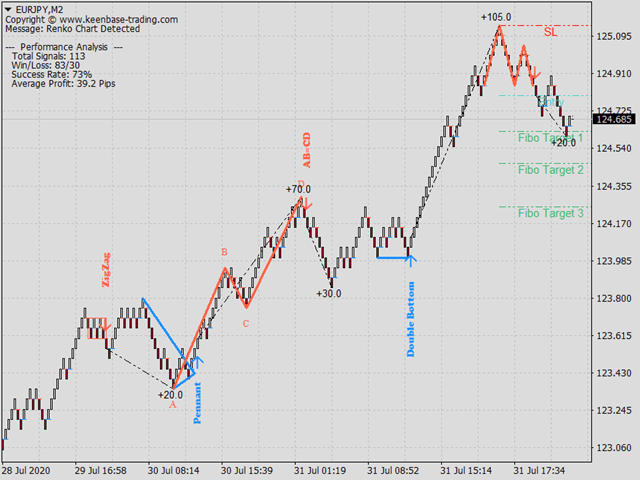
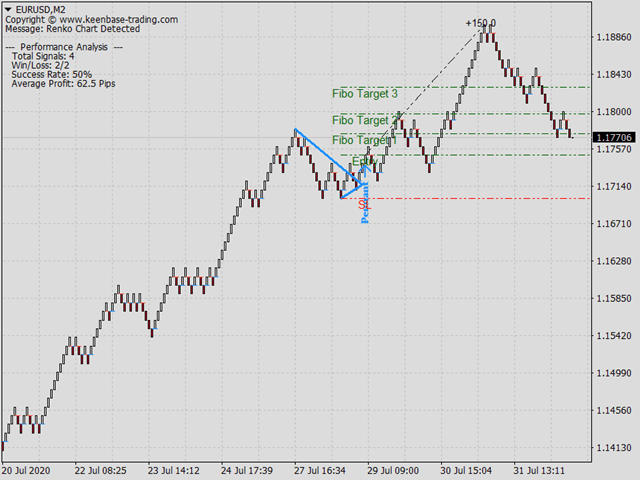
  • 每种模式都配有止损位和斐波那契目标位,确保交易策略客观明确。
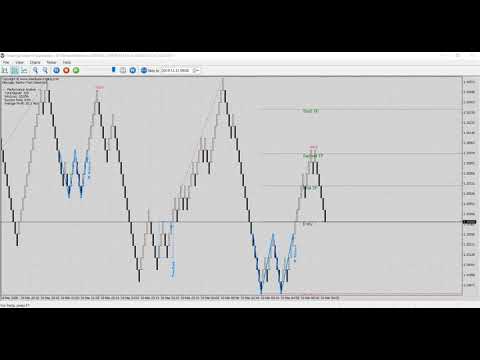
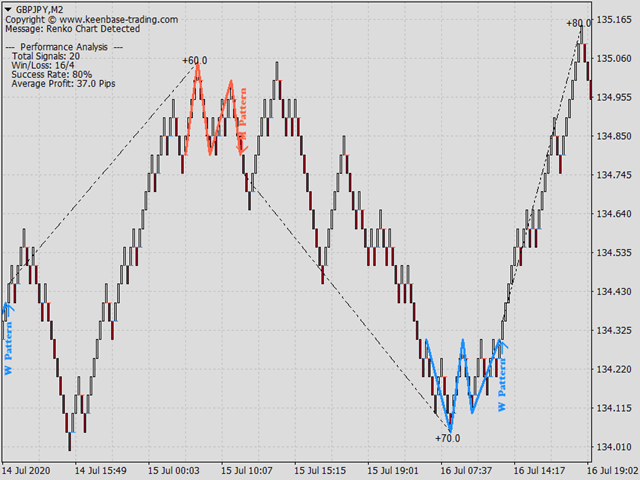
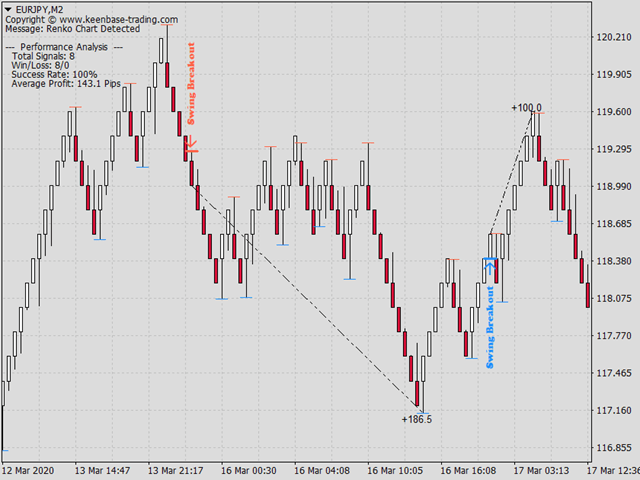
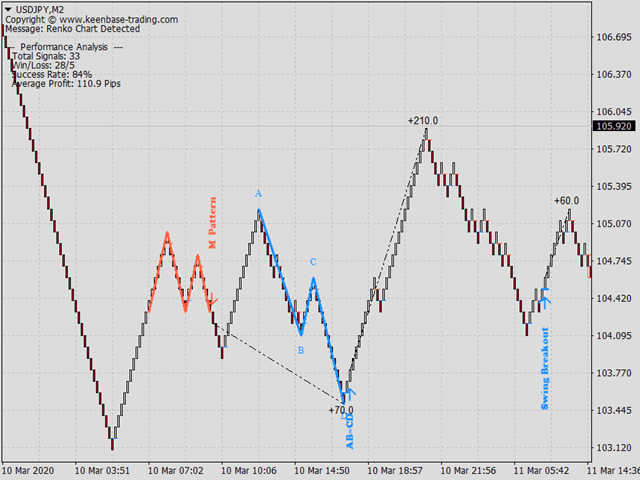
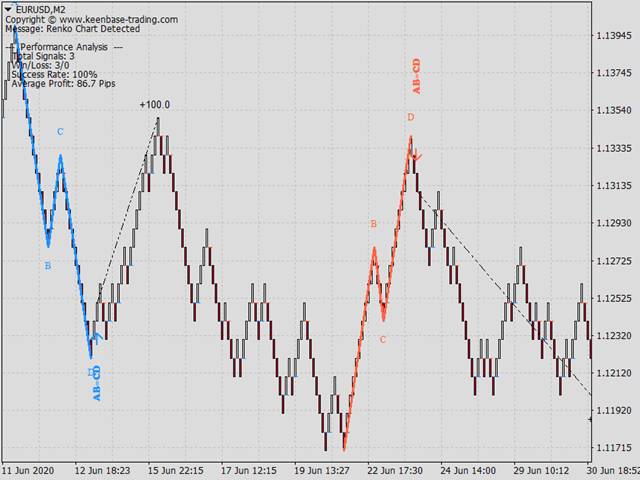
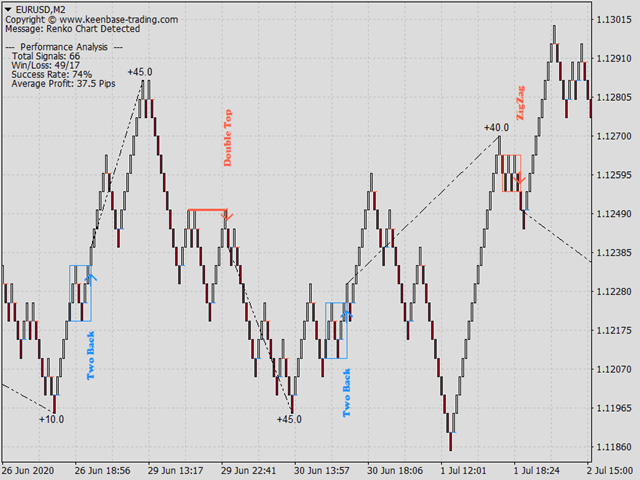
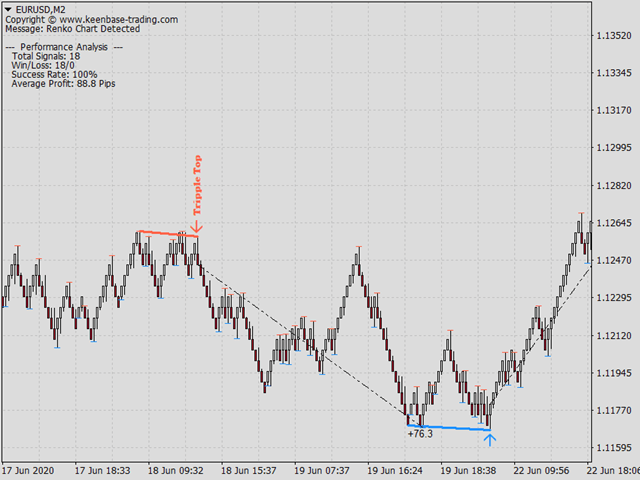
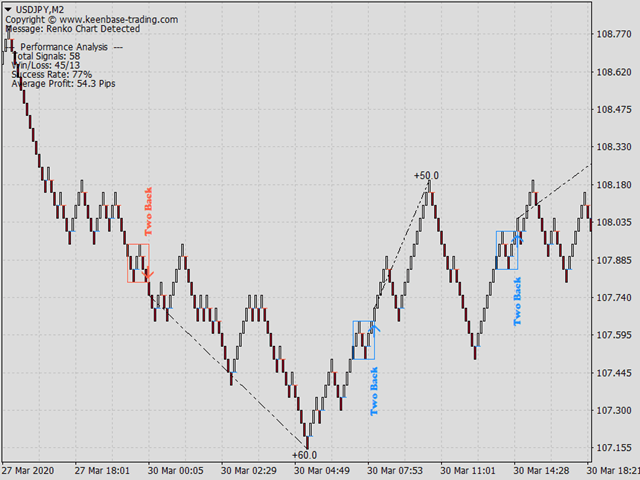
  • KT Renko Patterns 实时监测每种模式的准确率,并将关键统计信息显示在图表上。
  • 当 Renko 砖块发生反转时会自动标记并提醒,有助于在行情突变时提前计划退出。
  • 已识别的图形不会重绘或重新绘制,信号稳定可靠。


包含的图形模式

  • W-M 形态
  • 强势旗形
  • AB=CD 形态
  • 三顶/三底
  • 双顶/双底
  • Two Back Strike
  • ZigZag 砖形
  • 摆动突破

优化信号准确率 

KT Renko Patterns 显示多个图形形态,但并非所有形态都适用于每一个交易品种。可通过以下简单步骤来提高信号的准确率:

  1. 确保每种图形设置为 True。
  2. 选择一个“成功率标准”(推荐选择第二个 TP)。
  3. 逐一关闭图形,然后观察成功率的变化。
  4. 如果关闭某个图形后成功率提高,则保持关闭状态。
  5. 如果关闭后成功率下降,则重新启用该图形。
  6. 将“图形之间的最小砖数”设置在 20 到 100 之间。
提高图形之间的砖块间距通常可以提高成功率,但过高的值会显著减少信号数量,因此建议设置在 20 到 100 之间的平衡值。


输入参数

  • 图形之间的最小砖数:  每种图形之间的最小砖数,可提高信号准确性。
  • 标记砖块反转:  在图表上标记 Renko 砖块反转。
  • 砖块反转提醒:  若启用,则每次砖块反转时都会提醒。
  • 绘制图形名称:  在图表上显示信号的图形名称。
  • 性能分析:  指标会自动评估自身性能并显示关键统计信息。
  • 成功率标准:  用于评估信号成功率的基准。


常见问题

Q. 这个指标可以在标准时间图上使用吗?

A. KT Renko Patterns 是专为 Renko 图开发的,虽然也可以在标准时间图上运行,但并不推荐,这会违背其设计初衷。


Q. 可以优化信号的准确率吗?

A. 可以,优化方法已在上文详细说明。


Q. 我有一个适合 Renko 图的新形态建议,可以添加吗?

A. 欢迎联系我们,如果研究团队认为有价值,我们将在下一版本中添加。


Q. 可以将该指标用于EA中吗?

A. 当然可以,请联系我们以获取开发者导入代码。

推荐产品
SMC Venom 模型 BPR 指標是針對在智慧貨幣 (SMC) 概念內工作的交易者的專業工具。它會自動辨識價格圖表上的兩種關鍵模式: FVG (公平價值缺口)是三根蠟燭的組合,其中第一根和第三根蠟燭之間存在缺口。它在水平之間形成一個沒有成交量支撐的區域,這通常會導致價格調整。 BPR (平衡價格區間)是兩種 FVG 模式的組合,形成一個「橋樑」 - 當價格以低成交量活動移動時,突破並返回到水平的區域,從而在蠟燭之間產生間隙。 這些模式可協助交易者透過分析圖表上的交易量和價格動態(大型市場參與者和普通參與者之間的互動)來識別關鍵的支撐/阻力位、突破區域和切入點。 此指標以矩形和箭頭的形式可視化模式,也支援靈活的警報設定。 主要特點: 模式顯示模式:選擇顯示 BPR 模式(看漲和看跌)或 FVG 模式(看漲和看跌)。 可以隱藏所有圖表分析模式。 以條數過濾:BPR 結構中 FVG 之間的最小/最大距離。 訊號的附加視覺化: 箭頭有 9 種類型可供選擇(標準、細、分形等)或手動輸入 Wingdings 代碼,其表格可以選擇性地顯示在圖表上。 設定顏色、尺寸及其縮放時相對於價格的動態
可以说,这是您可以为MetaTrader平台找到的最完整的谐波价格形成自动识别指标。它检测19种不同的模式,像您一样认真对待斐波那契投影,显示潜在的反转区域(PRZ),并找到合适的止损和获利水平。 [ 安装指南 | 更新指南 | 故障排除 | 常见问题 | 所有产品 ] 它检测19种不同的谐波价格形态 它绘制了主要,衍生和互补的斐波那契投影(PRZ) 它评估过去的价格走势并显示每个过去的形态 该指标分析其自身的质量和性能 它显示合适的止损和获利水平 它使用突破来表明合适的交易 它在图表上绘制所有样式比率 它实现了电子邮件/声音/视觉警报 受斯科特·M·卡尼(Scott M. Carney)的书的启发,该指标旨在满足最纯粹和最熟练的交易者的需求。但是,它采取了一种使交易更容易的方式:在向交易发出信号之前,它会等待Donchian朝正确方向突破,从而使交易信号非常可靠。 斐波那契投影与向量无关 它实现了电子邮件/声音/推送警报 它绘制了ABCD投影 重要提示: 为了符合 Scott M. Carney先生 的商标申诉,某些图案名称已重命名为不言自明的替代方式, Scott M.
Triangle Pattern Gann v3.1 - Complete Feature Documentation Core Functionality OverviewTriangle Pattern Gann v3.1 is a sophisticated MetaTrader 5 indicator that combines W.D. Gann's geometric trading principles with advanced triangle pattern recognition to deliver actionable trading signals. Primary Features1. Triangle Pattern Detection SystemAscending Triangle Recognition Function: Automatically identifies bullish continuation patterns Detection Criteria: Flat horizontal resistance line
Volume Profile V6
Andrey Kolesnik
4.67 (3)
市场的成交量曲线指标+一个智能振荡器. 它适用于几乎所有工具-货币对,股票,期货,加密货币,实际交易量和报价。 您可以设置配置文件范围的自动定义,例如,一周或一个月等。,并通过移动边界(两条垂直线红色和蓝色)手动设置范围。 示为直方图。 此级别直方图的宽度有条件地意味着在其上进行的交易数量。 使用"模式水平线颜色"参数,您可以设置自动显示价格可能会击退的最重要交易量水平,而最大颜色参数则分别显示整个设定范围内最大交易量的水平。     智能振荡器显示超买和超卖区域,它分析来自多个指标的信息,并根据处理的数据,以适当的颜色为超买和超卖区域着色。     在Volume every day中,您可以使用Range period参数设置构建配置文件的时间范围,并使用Range count参数设置这些范围的配置文件数量。 例如,Range period=1day,Range count=10表示配置文件将基于一天的周期,即最后十天。 重要的是,切换图表的时间框架不会影响配置文件的构建,这也是该指标的一个额外优势。      该指标非常简单易用,同时尽可能提供信息。 有了这个指标,做市商将
SPECIAL LAUNCH OFFER: $30 (1-Month Rent) Limited time offer to build our community and gather feedback! AmbM GOLD Institutional Scalper A high-precision M5 algorithm for XAUUSD (Gold) , engineered to trade exclusively at Institutional Liquidity Levels ($5/$10 psychological marks). PERFORMANCE DATA (BUY ONLY) • Win Rate: 87.09%. • Safe Growth: +$4,113 profit on $10k (13.75% Max Drawdown). • Extreme Stress Test: Successfully generated +$22,997 in a 5-year stress test (2020-2026), proving
KT Pin Bar MT5
KEENBASE SOFTWARE SOLUTIONS
KT Pin Bar identifies the pin bar formation which is a type of price action pattern which depicts a sign of reversal or rejection of the trend. When combined with support and resistance, BRN and other significant levels, Pin Bar pattern proved to be a very strong sign of reversal. Basically, a pin bar is characterized by a small body relative to the bar length which is closed either in upper or lower 50% part of its length. They have very large wicks and small candle body. A pin bar candlestic
Harmonic Pattern Structure Harmonic Pattern Structure is a professional MetaTrader 5 indicator that automatically detects classic harmonic patterns using strict Fibonacci ratio validation and XABCD price structure. Designed for traders who value precision, clean visuals, and structured analysis, the indicator highlights potential reversal zones based on price geometry, supporting consistent and objective decision-making. SUPPORTED HARMONIC PATTERNS Gartley (222) Butterfly Bat Crab Shark Cy
Monster Harmonics Indicator is a harmonic pattern indicator. It recognizes Gartley, Bat, Crab, Butterfly, Cypher, White Swan, Black Swan, Shark and AB=CD patterns. Projected patterns that are not yet completed are recognized, too. Monster even shows the PRZ (Potential Reversal Zone). Users can add their own user defined patterns to Monster. Besides the current pattern, Monster also shows all patterns in the symbols history. Monster will provide alerts for developing patterns. Introduced by H.M.
Noize Absorption Index
Ekaterina Saltykova
Noize Absorption Index - is the manual trading system that measures the difference of pressure between bears forces and bulls forces. Green line - is a noize free index that showing curent situation. Zero value of index shows totally choppy/flat market.Values above zero level shows how powerfull bullish wave is and values below zero measures bearish forces.Up arrow appears on bearish market when it's ready to reverse, dn arrow appears on weak bullish market, as a result of reverse expectation.
ProEngulfing For MT5
Ashkan Hazegh Nikrou
ProEngulfing的免费版本是QualifiedEngulfing,每天仅限一个信号并具有较少的功能。 加入mql5社区的Koala Trading Solution频道,了解所有Koala产品的最新消息,加入链接如下: https ://www .mql5 .com /en /channels /koalatradingsolution 此产品的MT4版本可通过以下链接下载: https ://www .mql5 .com /en /market /product /52023 介绍ProEngulfing - 您的专业吞没形态指标,适用于MT4。 通过ProEngulfing,体验精准度的力量。此前沿指标专为识别和突出外汇市场中的高质量吞没形态而设计。ProEngulfing适用于MetaTrader 4,采用精确的形态识别方法,确保您仅接收最可靠的交易信号。 ProEngulfing如何运作: ProEngulfing使用复杂的算法,超越简单的形态识别,对吞没形态进行全面分析。该指标应用资格标准,评估烛体和影线的比例以确定整根蜡烛的大小。这种严谨的评估确保仅突出显示高概率
Nova AC Trader is a modern automation of the Accelerator Oscillator (AC) — a Bill Williams momentum tool designed to detect shifts in market acceleration before trends fully form. This EA transforms the indicator’s early-warning nature into a structured trading system that reacts only when momentum changes are clear and consistent. Instead of waiting for the trend to be obvious, Nova AC Trader identifies when market acceleration starts to turn — offering opportunities at the earliest stage of mo
RBreaker
Zhong Long Wu
RBreaker Gold Indicators 是黄金期货一种短线日内交易策略,它结合了趋势跟踪和日内反转两种交易方式,既能捕捉趋势行情的利润,又能在行情反转时及时止盈并顺势反手。 该策略曾连续15年被美国《Futures Truth》杂志评选为前十大最赚钱的交易策略之一,具有很长的生命周期,至今仍在国内外普遍使用与研究。 本指标结合了2026年期货黄金的走势,依据14日ATR指标,分别定义了突破系数A,观察系数B,反转系数R更合理的数值,非常不错的指标,已实现年稳定盈利,值得推荐~ 以上指标适合高波动品种,参数适合期货黄金,股指期货等,如果需要其他品种行情,需要单独设定 突破系数A,观察系数B,反转系数R,进行回测才能使用。 欢迎指标售后有问题可以加+V:504282029
DYJ BoS
Daying Cao
DYJ BoS指标自动识别和标记市场结构转变的基本要素,包括: 结构突破(BoS):当价格出现重大波动,突破之前的结构点时检测到。 它标记了可能的上升趋势线和下降趋势线(UP&DN,也是就不断创新高和创新低),一旦价格突破这些线,标记红色(BEAR)和绿色(BULL)箭头 BoS通常发生在价格决定性地穿过之前价格行动所建立的摆动低点或摆动高点时。当价格高于波动高点或低于波动低点时,它们只是打破了之前形成的市场结构,因此被称为“打破”结构。这通常表明市场情绪和趋势方向的变化,表明现有趋势的延续或新趋势的开始。 通常,为了提高关闭准确性,建议不设置止损和止盈,结束位置一般在相同方向的下一个突破点位置   关闭 ,或者是在反方向的突破点关闭 当您获得某个品种   足够 交易的经验时,你可以使用SL=7*TP的比率, 对于外汇符号,设置TP=500(5美元/最低交易量),SL=3500(35美元 /最低交易量 );单位点数POINTS。 对于 Volatility 75 Index 指数符号,设定TP=500000(5美元 /最低交易量 ),SL=3500000(35美元 /最低交易量 )
KT Double Top Bottom MT5
KEENBASE SOFTWARE SOLUTIONS
1 (1)
The double top bottom pattern is arguably one of the technical analysis's most popular chart patterns. These patterns are used to capitalize on recurring patterns and identify trend reversal patterns, thereby creating well-placed entry and exit levels. The KT Double Top Bottom is based on these patterns and fine-tunes the trade signal development process for traders. Features It's based on one of the most reliable trading patterns and brings some fine-tuning and automation to the process. Also
Visual Range Directional Force Indicator
AL MOOSAWI ABDULLAH JAFFER BAQER
Range Directional Force Indicator – Designed for You to Optimize! The Range Directional Force Indicator is a cutting-edge tool designed to empower traders by visualizing market dynamics and directional strength. Built to offer insights into market trends and reversals, this indicator is an invaluable asset for traders seeking precision in their strategies. However, it is important to note that this indicator is not optimized, leaving room for you to tailor it to your unique trading preferences.
Prometheus Analyst
Humphrey Mangera
PROMETHEUS TECHNICAN VERSION Free | By THE SONS A gift from The Sons — no strings, no trial, no expiry. Every trader deserves access to professional-grade market intelligence. That belief is why Prometheus Technical Version exists, and why it costs nothing. Consider it our handshake to the trading community. What You're Getting This is not a simplified tool dressed up as a gift. Prometheus Technican Version is a fully built, institutional-quality technical analysis indicator running a dual-model
FREE
PZ Mean Reversion MT5
PZ TRADING SLU
3 (2)
采用专业和量化方法进行均值回归交易的独特指标。它利用了价格以可预测和可衡量的方式转移并返回均值这一事实,这允许明确的进入和退出规则大大优于非量化交易策略。 [ Installation Guide | Update Guide | Troubleshooting | FAQ | All Products ] 清晰的交易信号 非常容易交易 可定制的颜色和尺寸 实现性能统计 优于大多数交易策略 显示合适的止损和止盈水平 它实现了电子邮件/声音/视觉警报 这个怎么运作 该指标从更高的时间范围测量完全可定制的移动平均线的标准偏差,并使用趋势跟踪方法精确地找到交易。交易是通过深入当前图表的价格行为发现的,并在价格返回到平均价格区间时关闭,根据您选择的更高时间范围计算。由于其编码方式,该指标将远离高波动性和强劲趋势市场,并且仅在可预测的情况下进行交易,在可接受的波动性与方向性比率范围内,回归均值是可行的。 指标剖析 绿线是更高时间范围内的移动平均线(也就是平均值) 虚线区域是移动平均线周围的典型价格区间 蓝线是看涨交易的突破价格 红线是看跌交易的突破价格 交易是针对均值进行的,并在典型的价格
Supply and Demand Zones Indicator for MT5 Professional institutional-grade Supply and Demand zone detection with intelligent alerts WHAT IS IT? Supply and Demand Zones is a powerful MT5 indicator that automatically identifies high-probability institutional supply and demand zones on any chart. this professional indicator brings advanced zone detection to MetaTrader 5 with enhanced features. Unlike traditional support and resistance levels, this indicator detects actual institutional footprint
Trend Reversal Scanner MT5
Reza Aghajanpour
5 (8)
**   All Symbols   x   All Timeframes   scan just by pressing scanner button ** Discount: The price is $50$, But now it is just $39, Limited time offer is active. *** Contact me  to send you instruction and add you in "Trend Reversal group" for sharing or seeing experiences with other users. Introduction: Trendlines are the most famous technical analysis in trading . Trendlines continually form on the charts of markets across all the different timeframes providing huge opportunities for traders
Price Magnet — Price Density and Attraction Levels Indicator Price Magnet is a professional analytical tool designed to identify key support and resistance levels based on statistical Price Density. The indicator analyzes a specified historical period and detects price levels where the market spent the most time. These zones act as “magnets,” attracting price action or forming a structural base for potential reversals. Unlike traditional Volume Profile tools, Price Magnet focuses on price-time d
PZ Support Resistance MT5
PZ TRADING SLU
3.71 (7)
厌倦了绘制支撑线和阻力线? 支撑阻力 是一个多时间指标,可以自动检测并绘制图表中的支撑线和阻力线,并具有非常有趣的变化:随着时间的推移测试价格水平及其重要性的提高,线变得越来越粗。 [ 安装指南 | 更新指南 | 故障排除 | 常见问题 | 所有产品 ] 一夜之间增强您的技术分析 无需浏览图表即可检测重要的价格水平 一目了然地识别所有价格水平的相对优势 每次交易最多可节省半小时的绘图线 指标显示所有价格水平的期限 指示器不重涂 过去和现在的价格水平因接近程度而崩溃,并根据当前的市场行为进行了调整。在动作发生的地方绘制了线条,而不一定在峰值处绘制了线条。 价格水平随着时间的推移而被拒绝,变得越来越暗 定期清除不重要的价格水平以避免噪音 可自定义的时间范围选择和崩溃因子 它实现了电子邮件/声音/推送警报的突破 输入参数 指标设置:指标将从当前时间段读取价格,但您可以选择另一个。例如,您可以在H4图表中显示D1支撑线和阻力线。您还可以使用 价格水平密度 参数选择在图表上显示多少价格水平。 颜色设置:根据重要性输入所需的支撑线和阻力线颜色。 标签设置:(可选)可以在指示器中显示用于
Caicai L&S Yield Histogram Important Notice: This indicator is an integral tool of the automated EA Caicai Long and Short Pair Trading . This indicator visually displays the percentage deviation (Yield %) of a pair's current spread relative to its own historical mean. It is an excellent tool for quickly visualizing the gross financial potential of a market distortion in Long & Short operations. Main Features: Percentage Visualization: Understand the size of the distortion in palpable percentage
Pro Gold System Indicator
PEDRO JOAQUIM GONCALVES GOMES
ADVANCED FUNCTIONALITIES: Trend Score (0-100) with visual bar Intelligent signals with adjustable strength (1-10) Risk management with automatic TP/SL Audible and visual alerts Price zones with smooth filling Multi-indicator analysis (RSI, ATR, BB, EMAs) DESIGN FEATURES Modern Visual: Smooth and well-spaced lines (EMA with 2-3px width) Vibrant and professional colors (Sky Blue, Orange, Gold) Modern arrows (code 233/234) for buy/sell signals Configurable dark/light theme Adjustable transparency f
Cumulative Delta NG
Anton Polkovnikov
Cumulative delta indicator As most traders believe, the price moves under the pressure of market buying or selling. When someone redeems an offer standing in the cup, the deal is a "buy". If someone pours into the bid standing in the cup - the deal goes with the direction of "sale". The delta is the difference between purchases and sales. A cumulative delta - the difference between the cumulative sum of purchases and sales for a certain period of time. It allows you to see who is currently contr
Max Min Delta Indicator - Market Volume Imbalance Analysis Gain Deeper Insights into Market Volume Imbalance with Delta Analysis What is the Max Min Delta Indicator? The Max Min Delta Indicator is a powerful market volume analysis tool that visually represents maximum and minimum delta values using a histogram. It helps traders identify market strength, weakness, absorption, and aggressive buying/selling activity with precision. Key Features Histogram Visualization: Displays Max Delta (Green) an
Equinox Gold
Dmitriq Evgenoeviz Ko
Equinox Gold is a high-tech trading expert advisor (EA) specifically designed for the gold market ( XAUUSD ). The system is based on a unique Market Equilibrium algorithm that identifies areas of imbalance between supply and demand during extreme volatility. Unlike most robots that use dangerous sit-and-wait methods, Equinox Gold relies on mathematical momentum confirmation and strict risk control for every trade. MAIN ADVANTAGES VRP Filter (Volatility Range Filter): The robot automatically ada
WAPV Weis Wave Chart Forex
Eduardo Da Costa Custodio Santos
The Weis Wave Chart Forex for MT5 is a Price and Volume indicator. The Price and Volume reading was widely disseminated through Richard Demille Wyckoff based on the three laws created by him: Supply and Demand, Cause and Effect and Effort vs. Result. In 1900 R.Wyckoff already used the wave chart in his analyses. Many years later, around 1990, David Weis Automated R. Wyckoff's wave chart and today we bring you the evolution of David Weis' wave chart. It shows the amount of Volume and the amount o
Fibaction
Abdelkhalek Orabi
Indicator Name: Fibaction – price action candle Detector Description: Fibo Signal Boxes is a powerful Smart Money Concept (SMC)-inspired indicator that auto-detects price action candles. bullish hammers and shooting stars, then draws precise Fibonacci entry zones and multiple take-profit levels directly on the chart. as for the SL personally i use 40 pips rules  Key Features: Detects bullish hammer and shooting star reversal candles. Automatically draws Fibonacci entry and TP boxes. as
Blahtech Market Profile MT5
Blahtech Limited
5 (10)
Was: $249  Now: $99   Market Profile defines a number of day types that can help the trader to determine market behaviour. A key feature is the Value Area, representing the range of price action where 70% of trading took place. Understanding the Value Area can give traders valuable insight into market direction and establish the higher odds trade. It is an excellent addition to any system you may be using. Inspired by Jim Dalton’s book “Mind Over Markets”, this indicator is designed to suit the
该产品的买家也购买
Azimuth Pro
Ottaviano De Cicco
5 (6)
上市促销 Azimuth Pro 前100位买家特惠价 299 美元。最终价格为 499 美元。 散户与机构入场的区别不在于指标,而在于位置。 大多数交易者在任意价格水平入场,追逐动量或对滞后信号做出反应。机构投资者等待价格到达供需真正转换的结构性水平。 Azimuth Pro 自动映射这些水平:波段锚定VWAP、多时间框架结构线,以及仅在高概率位置出现的ABC形态。 Azimuth Pro 专为需要结构分析和智能自动化的专业交易者打造。 Azimuth 以外科手术般的精度映射市场结构,而Azimuth Pro增加了智能层:自动检测您的交易风格、智能配置的移动平均线,以及经过20年数据回测优化的参数。结果是专业级分析自动适应您的交易品种和时间框架。 这是我们Merkava Labs每天为自己和客户使用的指标。 PRO版本的独特之处 智能配置 Pro版本理解您的交易环境。将它放在EURUSD M15上,它知道您在做日内交易。放在BTCUSD H4上,它会调整为波段交易。无需手动调整。 自适应移动平均线 标准EMA有效。但ATR自适应StepMA(响应波动率)和动
Divergence Bomber
Ihor Otkydach
4.9 (86)
购买该指标的每位用户将额外免费获得以下内容: 原创工具“Bomber Utility”,该工具会自动跟踪每一笔交易,设置止损和止盈点,并根据策略规则自动平仓; 适用于不同交易品种的指标设置文件(Set 文件); 三种不同风险模式下的 Bomber Utility 设置文件:“最低风险”、“平衡风险” 和 “观望策略”; 一套详细的 视频操作手册,帮助您快速完成安装、配置并开始使用本交易系统。 注意: 要获取以上所有赠品,请通过 MQL5 的私人消息系统联系卖家。 我为您介绍原创的自定义指标 “Divergence Bomber”(背离轰炸机),它是一套基于 MACD 背离交易策略 的“全功能”交易系统。 该技术指标的主要任务是识别 价格与 MACD 指标之间的背离,并发出交易信号(包括推送通知),指示未来价格可能的运动方向。平均而言,这些信号的准确率超过 98%。有关该指标如何工作的详细说明,请观看本页面上的视频演示。 该系统使用 止损订单 和 动态回撤平仓机制 来管理交易。 Divergence Bomber 指标的主要特点: 支持交易的品种: AUDCAD、AUDCHF、AUDSG
OmniSync Projection
Antonio-alin Teculescu
5 (1)
Chronos Fractal Engine is an innovative price projection indicator for MetaTrader 5, designed to transform your technical analysis by intelligently identifying and projecting historical price patterns. Built upon an advanced correlation algorithm and the fractal principles of the market, this powerful tool visualizes potential future price movements, giving you a unique edge in your trading decisions. What is Chronos Fractal Engine? At its core, the Chronos Fractal Engine employs a sophisticat
Btmm state engine pro
Garry James Goodchild
5 (3)
BTMM State Engine Pro is a MetaTrader 5 indicator for traders who use the Beat The Market Maker approach: Asian session context, kill zone timing, level progression, peak formation detection, and a multi-pair scanner from a single chart. It combines cycle state logic with a built-in scanner dashboard so you do not need the same tool on many charts at once. What it does Draws the Asian session range; session times can follow broker server offset or be set in inputs. Tracks level progression (L
RelicusRoad Pro MT5
Relicus LLC
5 (24)
RelicusRoad Pro: 量化市场操作系统 终身访问限时 70% 折扣 - 加入 2,000+ 交易员社区 为什么大多数交易者即使拥有“完美”指标也会失败? 因为他们在真空中交易 单一概念 。没有背景的信号是赌博。要持续获胜,您需要 共振 (CONFLUENCE) 。 RelicusRoad Pro 不是一个简单的箭头指标。它是一个完整的 量化市场生态系统 。它描绘价格运行的“公允价值之路”,区分市场噪音和真实的结构性突破。 停止猜测。开始用机构级“路”逻辑进行交易。 核心引擎:“Road” (路) 算法 系统的核心是 Road Algo ,一个实时适应市场条件的动态波动率通道。它投射出 安全线 (平衡) 和价格可能反转的 扩展水平 。 Simple Road: 典型市场的标准结构映射。 Smooth Road: 针对震荡盘整的降噪计算。 Breakout Road: 专为识别波动率扩张和爆发性走势而调整。 1. 算法动量与确认 我们的“剥头皮箭头”不只是简单的交叉。它们利用 高阶多项式逻辑 过滤噪音,确保信号与主周期一致。我们检测动量、价格行为和 Road 结构汇聚的精确入场
ARICoins
Temirlan Kdyrkhan
ARICoin is a powerful trading companion designed to generate high-probability entry signals with dynamic TP/SL/DP levels based on volatility. Built-in performance tracking shows win/loss stats, PP1/PP2 hits, and success rates all updated live. Key Features: Buy/Sell signals with adaptive volatility bands Real-time TP/SL/DP levels based on ATR Built-in MA Filter with optional ATR/StdDev volatility Performance stats panel (Success, Profit/Loss, PP1/PP2) Alerts via popup, sound, push, or email Cust
Bill Williams Advanced
Siarhei Vashchylka
5 (11)
Bill Williams Advanced is designed for automatic chart analysis using Bill Williams' "Profitunity" system. The indicator analyzes four timeframes at once. Manual (Be sure to read before purchasing) Advantages 1. Analyzes the chart using Bill Williams' "Profitunity" system. Signals are displayed in a table in the corner of the screen and on the price chart. 2. Finds all known AO and AC signals, as well as zone signals. Equipped with a trend filter based on the Alligator. 3. Finds "Divergence Bar
CGE Trading Suite
Carl Gustav Johan Ekstrom
5 (1)
CGE Trading Suite delivers the analytical edge typically reserved for professional trading desks. The platform integrates a full suite of analytical tools into one seamless workflow: dynamic grid mapping, liquidity behavior analysis, ECM, trend lines, MIDAS, trade cycles, and directional channel projections. Together, these provide a unified view of market structure and momentum. Directional clarity is further enhanced by the capital flow index, which measures currency basket strength to identif
ARIPoint
Temirlan Kdyrkhan
ARIPoint is a powerful trading companion designed to generate high-probability entry signals with dynamic TP/SL/DP levels based on volatility. Built-in performance tracking shows win/loss stats, PP1/PP2 hits, and success rates all updated live. Key Features: Buy/Sell signals with adaptive volatility bands Real-time TP/SL/DP levels based on ATR Built-in MA Filter with optional ATR/StdDev volatility Performance stats panel (Success, Profit/Loss, PP1/PP2) Alerts via popup, sound, push, or email Cu
Ultimate SMC Indicator
Hicham Mahmoud Almoustafa
1 (1)
Ultimate SMC PRO – Smart Money Concepts Indicator (Order Blocks, FVG, Liquidity, BOS) for MetaTrader 5  Ultimate SMC PRO is a professional trading indicator designed to visualize Smart Money Concepts directly on the chart. The indicator combines several institutional trading tools in one system to help traders identify potential high-probability trading zones. ULTIMATE SMC INDICATOR — COMPLETE TRADING GUIDE +   SMC Bridge The indicator analyzes market structure, liquidity behavior an
Grabber System MT5
Ihor Otkydach
4.83 (23)
向您介绍一款优秀的技术指标——Grabber,它是一套即开即用的“全包式”交易策略。 在一个代码中集成了强大的市场技术分析工具、交易信号(箭头)、提醒功能和推送通知。 每位购买该指标的用户还可免费获得以下内容: Grabber辅助工具:用于自动管理已开仓位 视频操作指南:逐步教学如何安装、设置和使用该指标进行交易 原创Set文件:可快速自动配置,帮助实现最佳交易效果 忘掉其他策略吧!只有Grabber能够真正激励你在交易中攀登新高峰! Grabber策略的主要特点: 交易周期:从M5到H4 适用资产:任意,但我推荐我亲自测试过的品种(GBPUSD、GBPCAD、GBPCHF、AUDCAD、AUDUSD、AUDSGD、AUDCHF、NZDUSD、NZDCAD、EURCAD、EURUSD、EURAUD、EURGBP、EURCHF、USDCAD、USDSGD) 交易时间:全天候 24/7 交易效果:我分享自己的真实交易结果,并在此教学如何操作: https://www.mql5.com/ru/market/product/134563?source=Site+Market+MT5+Indic
介绍     Quantum Breakout PRO   ,突破性的 MQL5 指标,正在改变您交易突破区域的方式!由拥有超过13年交易经验的资深交易员团队开发,     量子突破 PRO     旨在通过其创新和动态的突破区域策略将您的交易之旅推向新的高度。 量子突破指标将为您提供带有 5 个利润目标区域的突破区域的信号箭头,以及基于突破框的止损建议。 它既适合新手交易者,也适合专业交易者。 量子 EA 通道:       点击这里 重要的!购买后请私信我领取安装手册。 建议: 时间范围:M15 货币对:GBPJPY、EURJPY、USDJPY、NZDUSD、XAUUSD 账户类型:ECN、Raw 或 Razor,点差极低 经纪商时间:GMT +3 经纪商:IC Markets、Pepperstone with Raw 和 Razor 的点差最低 规格: 不重漆! 最多 5 个建议利润目标区域 建议止损水平 可定制的盒子。您可以设置自己的 Box Time Start 和 Box Time End。 接触 如果您有任何疑问或需要帮助,请通过私人消息与我联系。
Quantum TrendPulse
Bogdan Ion Puscasu
5 (22)
介绍 Quantum TrendPulse   ,这是一款终极交易工具,它将 SuperTrend   、   RSI 和 Stochastic 的强大功能整合到一个综合指标中,以最大限度地发挥您的交易潜力。该指标专为追求精准和效率的交易者而设计,可帮助您自信地识别市场趋势、动量变化以及最佳进入和退出点。 主要特点: 超级趋势整合: 轻松跟随当前的市场趋势并乘上盈利浪潮。 RSI 精度: 检测超买和超卖水平,非常适合把握市场逆转时机,可用作 SuperTrend 的过滤器 随机精度: 利用随机振荡在波动的市场中寻找隐藏的机会, 用作超级趋势的过滤器 多时间范围分析: 从 M5 到 H1 或 H4,在不同时间范围内关注市场动态。 可定制的警报: 当您的自定义交易条件得到满足时收到通知,这样您就不会错过任何交易。 无论您是新手还是经验丰富的交易员,   Quantum TrendPulse 都能为您提供所需的优势,帮助您增强策略并自信地进行交易。借助这一强大的指标,将洞察力转化为利润 — 掌控您的交易! ***购买 Quantum TrendPulse,即可免费获得 Quantum Tr
AriX
Temirlan Kdyrkhan
1 (4)
AriX Indicator for MT5 A powerful trend-following and signal-evaluation tool AriX is a custom MT5 indicator that combines Moving Averages and ATR-based risk/reward logic to generate clear buy/sell signals. It visualizes dynamic SL/TP levels, evaluates past trade outcomes, and displays win/loss statistics in a clean on-chart panel. Key features include: Buy/Sell signals based on MA crossovers ATR-based SL/TP1/TP2/TP3 levels with visual lines and labels Signal outcome tracking with real-time stat
Meravith MT5
Ivan Stefanov
5 (1)
做市商工具。 Meravith 将: 分析所有时间周期并显示当前正在运行的趋势。 标注流动性区域(成交量均衡区),即多头与空头成交量相等的位置。 在您的图表上直接显示来自不同时间周期的所有流动性水平。 生成并展示基于文本的市场分析供您参考。 根据当前趋势计算目标位、支撑位和止损位。 计算交易的风险回报比。 根据您的账户余额计算仓位大小,并估算潜在利润。 在市场出现重大变化时,Meravith 还会发出警告。 指标的主要线条: 多头/空头成交量衰竭线 —— 作为目标位使用。 趋势线 —— 指示市场趋势方向。根据市场是多头还是空头而改变颜色,并作为趋势支撑。其颜色主要反映市场情绪。 成交量均衡线(Eq)—— Eq(Volume Equilibrium)是系统的核心。它表示买卖双方成交量的平衡点,即市场流动性所在位置。向上突破 Eq 表示多头倾向,向下突破 Eq 表示空头倾向。突破后,应等待回调——当价格回到相反趋势的偏离线或衰竭线附近时。 使用方法:只需将其添加到图表中。 Meravith 可以分析一切——趋势和回调。 趋势线与某条成交量衰竭线之间的距离越大,说明该方向的成交量越高。 趋势
首先,值得强调的是,这个交易工具是非重绘、非重画和非滞后的指标,非常适合专业交易。 在线课程,用户手册和演示。 智能价格行动概念指标是一个非常强大的工具,既适用于新手,也适用于经验丰富的交易者。它将超过20个有用的指标合并到一个指标中,结合了高级交易思想,如内圈交易员分析和智能资金概念交易策略。该指标侧重于智能资金概念,提供有关大型机构交易方式的见解,帮助预测它们的动向。 它在流动性分析方面尤其擅长,有助于理解机构的交易方式。它擅长预测市场趋势,并仔细分析价格波动。通过将您的交易与机构策略对齐,您可以更准确地预测市场走向。该指标多才多艺,擅长分析市场结构,识别重要的订单区块,并识别各种模式。 它擅长识别BOS和CHoCH等模式,理解动量的转变,并突出显示供需强劲的关键区域。它还擅长发现强大的不平衡,并分析价格创造更高高点或更低低点的模式。如果您使用斐波那契回撤工具,该指标可以满足您的需求。它还可以识别相等的高点和低点,分析不同的时间框架,并通过仪表板显示数据。 对于使用更高级策略的交易者,该指标提供了工具,如公平价值差指标和优惠和折扣区域的识别。它特别关注高时间框架订单区块,并
ZIVA Signal Intelligence
Hassan Abdullah Hassan Al Balushi
ZIVA Signal Intelligence An Adaptive, Modular Market Intelligence System ZIVA Signal Intelligence is not positioned as a conventional trading indicator. It is a fully integrated, proprietary market intelligence system engineered to deliver structured, high-precision interpretation of price behavior within a controlled analytical environment. Developed through an independent architectural approach, ZIVA does not rely on, derive from, or replicate existing indicators. It represents a standalone
Ace Trend
Mikhail Sergeev
5 (3)
我们为您呈现一个革命性的指标,它改变了趋势交易世界的游戏规则。 该指标旨在重新思考性能并将您的交易体验提升到前所未有的高度。 我们的指标拥有先进功能的独特组合,使其有别于竞争对手。 "真实定价因素"的先进技术即使在最困难和最不稳定的市场条件下也能确保无与伦比的稳定性。 告别不稳定的模式,破碎的指标,欢迎有意识的,受控的交易。 该指标不仅仅是一个美丽的画面! 指标应该将赔率转移到交易者身边,从而赚取利润。 熟悉基于指标信号的交易结果(全自动模式): https://www.mql5.com/zh/signals/2339244 AceTrend在根据RBTI版本的趋势指标排名中排名第一。 AceTrend-最大的盈利能力和交易控制. 我们的指标根据当前市场报价而不是历史来突出盈利能力。 加入革命-释放您的交易经验的潜力! 指标不会在已形成的柱上重绘。 如果柱形已形成,指标读数保持不变。 该指标适用于从M1到MN的任何时间框架。 标准是H1时间框架。 您的反馈非常重要! 您有任何问题,建议,或只是想分享您的意见? 写评论或发送消息-我总是保持联系! 指标参数: PreSets - 如果选择
“ Dynamic Scalper System MT5 ”指标专为在趋势波内进行剥头皮交易而设计。 已在主要货币对和黄金上进行测试,并可与其他交易工具兼容。 提供顺势短线建仓信号,并提供额外的价格变动支持。 指标原理: 大箭头决定趋势方向。 在趋势波内,我们采用一种生成小箭头形式的剥头皮交易信号的算法。 红色箭头代表看涨方向,蓝色箭头代表看跌方向。 敏感的价格变动线会沿着趋势方向绘制,并与小箭头信号协同作用。 信号运作方式如下:当线在适当时刻出现时,将形成入场信号;在出现线时,持仓;线完成后,平仓。 建议的操作时间范围为M1 - H4。 箭头在当前K线上方形成,如果下一根K线已开仓,则不会重新绘制上一根K线上方的箭头。 输入参数 Trend Wave Period - 趋势方向(大箭头)的周期,改变趋势波的时间间隔。值 1 表示趋势方向的最长持续时间,参数值越大,持续时间越短。 Scalper Arrows Period - 信号箭头(小箭头)的计算周期,改变入场信号的生成频率。值 3 表示最频繁的生成频率,参数值越大,箭头频率越低,准确度越高。 这些参数可以根据不同
Entry Points Pro for MT5
Yury Orlov
4.48 (138)
这款指标用于 MT5,可提供准确的入场交易信号,且无重绘。 它可应用在任何金融资产:外汇、加密货币、贵金属、股票、指数。 它将提供极其精准的评估,并告诉您何时开仓和平仓的最佳时机。 观看 视频 (6:22),其中包含一个仅处理单一信号的示例,该信号即可值回指标购价! 大多数交易者在 Entry Points Pro 指标的帮助下,在第一个交易周内即改善了他们的交易结果。 订阅我们的 Telegram 群 ! Entry Points Pro 指标的益处。 入场信号无重绘 如果信号出现,并得到确认,则它不会再消失;不像是重绘指标,它会导致重大的财产损失,因为它们可以在显示信号后再将其删除。 无差错开仓 指标算法可令您找到入场交易(买入或卖出资产)的理想时机,从而提高每位交易者的成功率。 Entry Points Pro 可操作任何资产 它允许您在 MT5 平台上交易任何经纪商的加密货币、股票、贵金属、指数、大宗商品和货币。 提供任何方向的信号 Entry Points Pro 指标提供针对任意价格走势的入场交易信号 - 上涨、下跌或横盘(横向)。 最大盈利潜力 离场信号
Introduction to X3 Chart Pattern Scanner X3 Cherart Pattern Scanner is the non-repainting and non-lagging indicator detecting X3 chart patterns including Harmonic pattern, Elliott Wave pattern, X3 patterns, and Japanese Candlestick patterns. Historical patterns match with signal patterns. Hence, you can readily develop the solid trading strategy in your chart. More importantly, this superb pattern scanner can detect the optimal pattern of its kind. In addition, you can switch on and off individu
本指标是实践实战交易完善的波浪自动分析的指标 !  案例... 注: 波浪分级用西方叫法不习惯,因受到缠论(缠中说禅)命名方式习惯的影响,我是将基础波浪命名为 笔 ,将二级波段命名为 段 ,同时具有趋势方向的段命名为 主趋段 (以后笔记中都是这种命名方式,先告知大家),但是算法上和缠论关系不大切勿混淆.反映的是本人分析盘面总结的 千变万化纷繁复杂的运行规律 . 对波段进行了标准化定义,不再是不同人不同的浪  ,   对人为干扰的画法进行了排除,在严格分析进场起到了关键的作用 . 使用这个指标,等于将交易界面提升美感,抛弃最原始的K线交易带你进入新的交易层次.如果不是为了交易,在宣传上也将使客户观感提升层次. 指标内容: 1.   基础波浪 (笔) : 首先我们找出了价格波动过程中的基础波动拐点,当然他的有序性低,为下一步的计算提供基础. 2.   二级波段( 段 ) :在基础波浪的基础上,通过算法分析得到层级更明显的二级波段,二级波段为波浪提供了分析基础 3.   波浪( 浪 ): 有着更清晰的趋势,更清晰直观的方向.分析一个波浪是否延续,需要看二级波段的形态,分析二级的构成,
Gem SIGNAL
Shengzu Zhong
GEM Signal Pro GEM Signal Pro 是一款適用於 MetaTrader 5 的趨勢跟隨指標,專為希望在圖表上獲得更清晰訊號、更有結構的交易設定,以及更實用風險管理的交易者而設計。 它不僅僅顯示一個簡單的箭頭,GEM Signal Pro 還能以更清晰、更易讀的方式呈現完整的交易思路。當條件確認完成後,指標可在圖表上顯示進場價、止損價與止盈目標,幫助交易者更有效率地評估交易設定。 運作方式 該指標首先根據其內部邏輯識別有效的初始訊號。 當確認條件滿足後,GEM Signal Pro 會在圖表上顯示完整的交易設定。這讓交易者可以更清楚地看到交易結構,並減少手動分析與計算的工作量。 圖表上的交易價位 對於已確認的訊號,GEM Signal Pro 可顯示: 進場價 止損價 止盈 1 止盈 2 止盈 3 風險報酬比 這讓交易設定更容易理解,也有助於讓圖表分析更有條理。 內建風險管理 風險管理是此指標設計的重要部分。 止損位基於近期市場結構,結合附近的擺動高低點與可選的 ATR 緩衝距離。這能讓交易價位更貼近當前市場條件,而不只是依賴固定距離。 圖表資訊面板 GEM Si
帮助判断这个位置适不适合买。 帮助判断这个位置适不适合卖。 当四个指标同步到底时,重点观察反弹机会。 当四个指标同步处于顶部时,重点观察下跌机会。 该系统依托中国先进算法技术与高阶数学建模体系构建而成。 本人主要使用 XAUUSD M5 周期,实际效果也是这个周期最好。 由于本指标的算法与数学公式较为复杂,测试时可能会出现运行较慢的情况。测试阶段主要观察指标是否重绘、是否滞后即可,正式版使用会更加稳定。 该指标系统绝对不重绘,绝对不使用未来函数,购买前可自行测试观察。 该指标配有完全个性化的警报系统,您可以通过以下链接进行观看。 请在正式使用前,充分阅读完整使用说明。 如有任何问题,请及时与我联系,我会尽快回复。祝您一切顺利。 https://www.mql5.com/zh/users/godofwarguo1
OrderFlow Absorption – 專業級MT5買賣差與吸收訊號指標 釋放真正訂單流分析的力量,OrderFlow Absorption 是MetaTrader 5上最強大的買賣差(Delta)直方圖與吸收訊號指標。專為想看清每一個價格波動背後真相的交易者設計,這個工具揭示了隱藏的買賣壓力與推動市場的吸收事件。 功能特色 買賣差直方圖視覺化:   以清晰的色彩直方圖即時顯示買方與賣方壓力。 吸收訊號偵測:   先進邏輯自動辨識多空吸收事件,及早預警潛在反轉。 圖表標記:   吸收訊號直接標示於主圖表,方便視覺辨識。 彈出式警報:   新吸收訊號出現時即時通知。 自訂門檻:   過濾弱訊號,專注高勝率機會。 資源管理:   高效運算,適用於大型圖表也能流暢運行。 全品種兼容:   適用於任何商品與週期,包括外匯、指數、商品等。 簡易整合:   參數簡單,快速上手與調整。 OrderFlow Absorption 的邏輯說明 OrderFlow Absorption 採用專利演算法,能在沒有完整Tick數據的情況下,估算每根K棒的買賣壓力(Delta)。它分析成交量、價格行為、K
Gold Xausd Hunter
Metin Erkamoglu
MATADOR GOLD — XAUUSD M5 ( TimeFrame M5 ) Scalp Signals for MT5 Strategy Tester Visualization Video https://youtu.be/_cWbbyg2RSs Not every move deserves a signal. MATADOR GOLD was built for traders who prefer selective, structured, high-quality decision support over noisy, hyperactive signal tools. Designed specifically for Gold (XAUUSD / GOLD) on M5 , MATADOR helps you read short-term momentum with more discipline by combining trend logic, market-condition filters, momentum timing, spread pro
Owl Smart Levels MT5
Sergey Ermolov
4.03 (32)
在顺势交易中,主要的难点不在于找到一个水平位,而在于理解哪里才是一个真正有效的入场点。 价格经常对水平位产生反应,但无法延续 движение — 这会导致错误入场或错过行情。 Owl Smart Levels 不仅仅显示水平位 ,还会基于市场结构和回调构建区域。这使你可以以不同的方式评估入场点,并避免一部分虚假信号。 Owl Smart Levels 系统包含什么? Owl Smart Levels 不只是标记水平位,而是一个 完整的交易模型 ,其中每个元素相互配合。 系统包含: Owl Smart Levels(指标) 显示趋势方向、回调区域,以及预定义的入场、止损和止盈水平 系统指南 解释如何在实战中使用信号:哪些情况需要考虑,哪些需要忽略,以及如何管理交易 交易决策清单 帮助你快速评估信号,避免基于“感觉”入场 Owl Helper 辅助EA 简化交易执行和管理 (一键下单) 说明、示例和策略 帮助你快速上手,并在实践中理解系统逻辑 最终,你获得的不是一个单独的工具,而是一个完整的交易框架 —— 从分析到执行。 购买后你可以通过私信联系 — 所有附加材料和说明将单独
ARIScalping
Temirlan Kdyrkhan
ARIScalp is a powerful trading companion designed to generate high-probability entry signals with dynamic TP/SL/DP levels based on volatility. Built-in performance tracking shows win/loss stats, PP1/PP2 hits, and success rates all updated live. Key Features: Buy/Sell signals with adaptive volatility bands Real-time TP/SL/DP levels based on ATR Built-in MA Filter with optional ATR/StdDev volatility Performance stats panel (Success, Profit/Loss, PP1/PP2) Alerts via popup, sound, push, or email Cus
Meta Cipher B
SILICON HALLWAY PTY LTD
Meta Cipher B:MT5全能震荡指标套件 Meta Cipher B 将广受欢迎的 Market Cipher B 概念引入 MetaTrader 5,并针对速度与精度进行了优化。该指标自底层重构,旨在提供 专业级信号 ,运行流畅、无延迟。虽然单独使用已非常强大,但 Meta Cipher B 还可与 Meta Cipher A 自然搭配,为交易者提供更完整的市场视角与更深入的信号确认。 功能介绍 一体化震荡指标系统,可可视化 波动动能、VWAP、资金流、RSI 与随机震荡指标 。当多项条件满足时,会自动显示清晰的买入和卖出信号。可用于短周期的精准进场,也可用于长周期的趋势结构分析。 精准信号校准 通过 曲线匹配技术 精心校准,以尽可能复现原始版本在典型市场条件下的行为。所有子信号均经过平滑与同步处理,使波形与信号点高度一致,符合专业交易者的预期。 您可以自行验证 ,通过比较与 Market Cipher B 的截图来观察相似度。任何细微差异,可能来自 MetaTrader 与 TradingView 使用的不同数据提供商,而非计算方法的不同。 主要特点 综合工具包 :
TPA True Price Action indicator reveals the true price action of the market makers through 100% non-repainting signals strictly at the close of a candle! TPA shows entries and re-entries, every time the bulls are definitely stronger than the bears and vice versa. Not to confuse with red/green candles. The shift of power gets confirmed at the earliest stage and is ONE exit strategy of several. There are available now two free parts of the TPA User Guide for our customers. The first "The Basics"
作者的更多信息
ACB Breakout Arrows MT5
KEENBASE SOFTWARE SOLUTIONS
3.5 (2)
ACB Breakout Arrows 指标通过检测特殊的突破形态,提供市场中的关键入场信号。该指标持续扫描图表中的价格动量,在价格出现重大变动前,提前提供精确的入场信号。 点击此处获取多品种多周期扫描器 - ACB Breakout Arrows MT5 扫描器 主要特点 指标自动提供止损和止盈价格。 内置多周期扫描仪仪表盘,可追踪所有时间周期的突破信号。 适用于日内交易者、波段交易者和剥头皮交易者。 优化算法提升信号精度。 特别设置的快速盈利线用于无亏损移动或短线目标。 支持胜率、盈亏比、平均利润等绩效分析指标。 无重绘,信号可靠。 交易确认 - 可使用 ACB Trade Filter 指标 来过滤低概率的交易信号。 强烈买入: 向上箭头 + 绿色柱状图 + 多头趋势。 强烈卖出: 向下箭头 + 红色柱状图 + 空头趋势。 当柱状图为灰色且趋势为震荡时,应避免交易。 (可选) -  使用  KT 支撑阻力水平指标  避免在重要支撑/阻力位附近入场。这类交易可能迅速变成亏损。 “一个成功交易者的目标是做出最好的交易。金钱只是附属。” —— 亚历山大·埃尔德 输入参数 历史
KT Psar Arrows
KEENBASE SOFTWARE SOLUTIONS
KT Psar Arrows使用标准的抛物线转向指标(Parabolic SAR)在图表上绘制箭头。当蜡烛的最高点触及SAR时绘制看涨箭头;当蜡烛的最低点触及SAR时绘制看跌箭头。信号在实时生成,无需等待K线收盘。  特点 对于想要基于抛物线SAR指标开发交易策略的交易者来说,这是一个非常有用的工具。  可以用于寻找市场中的转折点。 支持自定义PSAR参数输入。 提供所有MT4的提醒功能。 注意事项:抛物线SAR是一个滞后且严格机械化的指标。每一笔潜在交易都应该通过明确定义的规则进行筛选。     输入参数 PSAR步长:输入步长值。 PSAR最大值:输入最大值。 显示PSAR点:显示/隐藏PSAR点。即使不显示PSAR点,箭头功能也能正常工作。 其余输入项均为直观设置,无需特别说明。
Use of support and resistance in systematic trading is very subjective. Every trader has their own idea and way to plotting the support and resistance levels on the chart. KT Support and Resistance indicator take out this ambiguity out of the situation and automatically draws support and resistance levels following an algorithmic approach using a unique multi-timeframe analysis. When launched on the chart, It immediately scan the most significant extreme points across all the available timefra
ACB Trade Filter MT5
KEENBASE SOFTWARE SOLUTIONS
ACB Trade Filter indicator provides a way to filtering out the low probability trading entries in a trading strategy. The indicator uses a sophisticated filtration algorithm based on the market sentiment and trend. The MT4 version of the same indicator is available here ACB Trade Filter MT4 Applications Works great with our indicator ACB Breakout Arrows MT5 Filter out low probability signals from any indicator. Avoid over-trading and minimize the losses. Trade in the direction of market sentime
KT Round Numbers MT5
KEENBASE SOFTWARE SOLUTIONS
KT Round Numbers plots the round number levels which are also commonly known as psychological levels in the Forex world. In the context of Forex trading, round number levels are those levels in which there are two or more zeroes at the end. They are named as 00 levels on the chart. Some traders also consider the halfway points as a valid round number level. They are named as 50 levels on the chart. Use of round number levels in trading Round number levels work as strong support and resistance
KT Momentum Arrows MT5
KEENBASE SOFTWARE SOLUTIONS
5 (2)
KT Momentum Arrows 指标基于瞬时突破计算,它结合了价格波动方向中的带宽偏离和新兴波动率。这是一种对动量变化反应灵敏的技术指标,适合在趋势开始阶段发出交易信号。 当价格收于上轨之上时,生成买入信号;当价格收于下轨之下时,生成卖出信号。 该指标使用一个“幅度系数”作为输入参数,同时影响带宽偏离和波动率计算。建议根据不同品种和时间周期仔细选择和优化该系数值以获得最佳效果。 主要特点 信号不重绘! 非常适合动量交易者的进场工具。 性能分析功能:胜率、盈亏比、平均收益等数据可视化展示。 适用于日内交易者、波段交易者和剥头皮交易者。 输入参数 历史K线数量:  用于指标计算的K线数量。 幅度系数:  用于调节带宽偏离和波动率的单一系数。 性能分析:  显示或隐藏性能分析,包括利润趋势线。  提醒设置:  支持弹窗、邮件、推送和声音提醒。 其余参数无需额外解释,简单明了。
KT Asian Breakout
KEENBASE SOFTWARE SOLUTIONS
4 (1)
KT Asian Breakout carefully analyzes the range-bound market during the Asian session and then fires a long or short trade after doing some preassessment based on its inbuilt technical analysis module. The executed orders are closed within a day before the completion of the next day session. The inbuilt technical analysis module checks for the session range and compares it with the last 20 days price movement. If it finds any erratic price movement within the session, the orders are not executed
KT RSI Divergence Robot MT4
KEENBASE SOFTWARE SOLUTIONS
KT RSI Divergence robot 是一款 100% 全自动的专家顾问(EA),专门交易价格与相对强弱指数 (RSI) 振荡器之间形成的常规与隐藏背离。EA 的背离信号来自我们免费提供的 RSI Divergence 指标。 并非每一次背离都会带来成功的价格反转,因此本 EA 将原始背离信号与其内置的技术分析模块结合,以捕捉部分精选背离出现后产生的价格低效区间。 使用建议 Pairs:   EURUSD、EURCAD、EURCHF、EURJPY、GBPJPY、USDCHF、USDJPY、XAUUSD Time-Frame:   1-Hour Account Type:   Any Leverage:    1:100 R isk:   每笔交易 1% 特点 自动交易 RSI 背离信号,并加入众多人工交易难以实现的改进功能。 基于波动率的止损与止盈,帮助账户实现更稳定、成比例的增长。 内置多重入场过滤器,例如趋势过滤器、Vortex 过滤器、波动率过滤器、MMI 以及周内日期过滤器。 固定分数资金管理,实现权益曲线的指数型增长。 允许同方向的多笔仓位同时存在,充分利用
KT CCI Divergence MT5
KEENBASE SOFTWARE SOLUTIONS
KT CCI Divergence shows the regular and hidden divergence created between the price and CCI oscillator. Divergence is one of the vital signals that depicts the upcoming price reversal in the market. Manually spotting the divergence between price and CCI can be a hectic and ambiguous task. Limitations of KT CCI Divergence   Using the CCI divergence as a standalone entry signal can be risky. Every divergence can't be interpreted as a strong reversal signal. For better results, try to combine it w
ACB Breakout Arrows
KEENBASE SOFTWARE SOLUTIONS
4.15 (34)
ACB Breakout Arrows 指标通过识别一种特殊的突破形态,为交易者提供关键的入场信号。该指标持续扫描图表中某一方向上趋于稳定的动能,并在主要行情启动之前给出准确的进场信号。  点击此处获取多品种、多周期扫描仪 - ACB Breakout Arrows MT4 专用扫描仪 主要功能 指标自动提供止损和止盈位置。 配备 MTF 多周期扫描仪面板,可跟踪所有时间周期的突破信号。 适用于日内交易者、波段交易者和剥头皮交易者。 采用优化算法,提高信号准确性。 提供特殊目标线,用于设置快速平仓点或无损平移位(Quick Profit Line)。 包括胜率、成功率、平均收益等表现分析指标。 不重绘,信号一旦出现即保持不变。 交易确认 -  建议结合使用 ACB Trade Filter 指标 以过滤低质量信号。 强买入: 上箭头 + 绿色柱状图 + 多头趋势。 强卖出: 下箭头 + 红色柱状图 + 空头趋势。 避免交易 :当柱状图为灰色且趋势为震荡时。 (可选) -  建议使用 KT  支撑与阻力位指标  来避免在关键支撑/阻力区域附近开仓。此类交易可能迅速转为亏损,造成不必
ACB Trade Filter MT4
KEENBASE SOFTWARE SOLUTIONS
5 (1)
The ACB Trade Filter indicator provides a solution for filtering out the low probability trading setups in a trading strategy. The indicator uses a sophisticated filtration algorithm based on the market sentiment and trend. Applications Works great with our indicator " ACB Breakout Arrows ". Filter out low probability signals from any indicator. Avoid overtrading and minimize the losses. Trade in the direction of market sentiment and trend. Avoid the choppiness in the market. How to use Only L
KT Momentum Arrows
KEENBASE SOFTWARE SOLUTIONS
KT Momentum Arrows 指标基于瞬时突破计算,它结合了价格波动方向中的带宽偏离和新兴波动率。这是一种对动量变化反应灵敏的技术指标,适合在趋势开始阶段发出交易信号。 当价格收于上轨之上时,生成买入信号;当价格收于下轨之下时,生成卖出信号。 该指标使用一个“幅度系数”作为输入参数,同时影响带宽偏离和波动率计算。建议根据不同品种和时间周期仔细选择和优化该系数值以获得最佳效果。 主要特点 信号不重绘! 非常适合动量交易者的进场工具。 性能分析功能:胜率、盈亏比、平均收益等数据可视化展示。 适用于日内交易者、波段交易者和剥头皮交易者。 输入参数 历史K线数量:  用于指标计算的K线数量。 幅度系数:  用于调节带宽偏离和波动率的单一系数。 性能分析:  显示或隐藏性能分析,包括利润趋势线。  提醒设置:  支持弹窗、邮件、推送和声音提醒。 其余参数无需额外解释,简单明了。
KT COG Advanced MT4
KEENBASE SOFTWARE SOLUTIONS
1 (1)
KT COG is an advanced implementation of the center of gravity indicator presented by John F. Ehlers in the May 2002 edition of Technical Analysis of Stocks & Commodities magazine. It's a leading indicator which can be used to identify the potential reversal points with the minimum lag. The COG oscillator catches the price swings quite effectively. MT5 version of the same indicator is available here KT COG Advanced MT5 Calculation of COG The COG indicator is consist of the two lines. The main l
KT Pin Bar
KEENBASE SOFTWARE SOLUTIONS
KT Pin Bar identifies the pin bar formation which is a type of price action pattern which depicts a sign of reversal or rejection of the trend. When combined with support and resistance, BRN and other significant levels, Pin Bar pattern proved to be a very strong sign of reversal. Basically, a pin bar is characterized by a small body relative to the bar length which is closed either in upper or lower 50% part of its length. They have very large wicks and small candle body. A pin bar candlestic
KT Trend Magic
KEENBASE SOFTWARE SOLUTIONS
KT Trend Magic shows the trend depiction on chart using the combination of market momentum and volatility. A smoothing coefficient is used to smooth out the noise from the signal.It can be used to find out the new entries or confirm the trades produced by other EA/Indicators. Usage Drag n drop MTF scanner which scans for the new signals across multiple time-frames. Find new entries in the trend direction. Improve the accuracy of other indicators when used in conjunction. Can be used as a dynami
KT Auto Fibo
KEENBASE SOFTWARE SOLUTIONS
KT Auto Fibo根据当前的趋势方向自动绘制斐波那契回撤水平。最高点和最低点是根据图表上可用的最大值和最小值自动选择的。您可以通过缩放和滚动图表来相应地调整斐波那契水平。 模式 自动:  根据图表区域自动绘制斐波那契水平。 手动: 仅绘制一次斐波那契水平,之后您可以手动调整锚点。 使用方法: 帮助您合理预测未来的获利目标。 结合支撑/阻力位或趋势线使用时,具有较强的反转可能性。 在趋势市场中提供低风险的入场机会。 输入参数 自动:  无需人为干预即可绘制斐波那契回撤水平。 手动:  仅绘制一次斐波那契回撤水平,之后可以手动拉伸锚点。 显示未回撤区域: 在图表上显示或隐藏尚未被价格回撤触及的区域。 其余输入项为直观设置,无需额外解释。
KT Ichimoku Trader
KEENBASE SOFTWARE SOLUTIONS
1 (1)
KT Ichimoku Trader is a fully automated expert advisor that offers five popular trading strategies based on the Ichimoku indicator. Each strategy has it's own entry and exit method without any interference to other strategies. The Ichimoku system can be applied to all major currency pairs and metals. However, we found that it performs reasonably well mainly on two pairs.   MT5 Version is available here  https://www.mql5.com/en/market/product/35043 Features Trade up to 5 famous trading strategi
KT Volatility Oscillator
KEENBASE SOFTWARE SOLUTIONS
KT波动率振荡器通过数学公式分析过去和当前的市场数据,以振荡器的形式显示结果。振荡器中波浪的增长和减弱分别对应于资产的高波动性和低波动性。  简单来说,波动率就是衡量资产在一定时间内价格波动幅度的指标。没有波动性,市场上的价格变化将非常有限,交易者也将难以从价格波动中获利。 外汇市场中波动率的应用 在外汇市场中利用波动率,可以帮助你更有效地进行交易,同时让你的预期更加符合实际情况。  高波动性 基于趋势的交易系统在高波动市场中表现出色,因为价格波动幅度大,趋势持续时间长,直到出现趋势反转。 如果突破发生在高波动期间,突破系统可以从市场中获得更多的点数收益。 低波动性 均值回归系统在低波动性环境下表现良好,因为市场有回归均值的特性。 基于通道的系统在市场盘整期,即低波动阶段,能够更加有效地发挥作用。 非方向性指标 KT波动率振荡器是一种非方向性指标,不与市场的牛市或熊市趋势直接相关。波动性的上升可能出现在牛市或熊市两种情形下。  输入参数 波动率周期:   一个整数值,用于设定计算的周期。 文本信息:   在图表上显示或隐藏信息文本。 ----- 警报设置 ----- 声音警报
KT COG Robot
KEENBASE SOFTWARE SOLUTIONS
KT COG Robot is a fully automated Expert Advisor based on the KT COG Indicator . The COG indicator was originally presented by John F. Ehlers in the May 2002 edition of Technical Analysis of Stocks & Commodities magazine. The EA fires a long trade when COG line cross above the signal line and a short trade is fired when the COG line cross below the signal line.  Adaptive Filtration Our adaptive filtration algorithm combines the original COG formula with the major trend direction and market acce
ACB Breakout Arrows EA
KEENBASE SOFTWARE SOLUTIONS
这是一款基于我们自定义指标 “ACB Breakout Arrows” 的全自动化智能交易系统。入场基于一种常见的双向突破模式,可通过外部参数“Signal Sensitivity”来调节入场信号的强度。 交易确认机制 ACB Breakout Arrows EA 可通过另一个自定义指标 ACB Trade Filter 来过滤不理想的入场信号,提高交易准确性。 强烈买入: 向上箭头 + 绿色柱状图 + 多头趋势。 强烈卖出: 向下箭头 + 红色柱状图 + 空头趋势。 当柱状图为灰色并且趋势为震荡时,EA 将避免交易。 EA 会在后台加载所有相关指标和依赖项,指标不会显示在图表上。 主要功能亮点 长期以来的呼声终于实现,现在您可以通过我们 ACB Breakout Arrows 指标 实现完全自动化交易。 ACB Trade Filter 也已集成在 EA 中,用于模拟完整的交易系统。 无需额外下载,所有指标和依赖都内嵌在 EA 中。 可直接从指标中提取止损和止盈目标。 通过内置过滤器(如交易时段、MMI、Vortex、波动率、市场状态等)进一步提升性能。 提供三阶段的部分平仓
KT London Breakout
KEENBASE SOFTWARE SOLUTIONS
First thirty minutes are essential for a trading session. The early reaction of traders and market players sets a path for the rest of the day. KT London Breakout EA takes advantage of this phenomenon, and after analyzing the first thirty minutes of London session, it places two bidirectional pending orders. One of pending order is eventually canceled after realizing the market direction with certainty. It has been strictly tested and developed for EUR/JPY using 30-Min Time Frame. You can expe
KT Support and Resistance Levels
KEENBASE SOFTWARE SOLUTIONS
Use of support and resistance in systematic trading is very subjective. Every trader has their own idea and way to plotting the support and resistance levels on the chart. KT Support and Resistance indicator take out this ambiguity out of the situation and automatically draws support and resistance levels following an algorithmic approach using a unique multi-timeframe analysis. When launched on the chart, It immediately scan the most significant extreme points across all the available timefra
如果您进行外汇交易,了解货币强弱和货币对相关性等详细信息,可以让您的交易更上一层楼。通过相关性分析,您可以将风险减半,而强弱分析将帮助您最大化利润。 本指标通过结合货币强弱分析和货币对相关性,提供了一种混合的方法,帮助选择最合适的货币对进行交易。 如何使用货币强弱分析 假设您的交易策略在AUD/JPY上提供了买入机会,但通过KT货币强弱分析发现JPY比AUD更强。那么,这笔交易很可能以亏损告终。有了这个指标,您可以轻松避免此类亏损。 如何使用货币对相关性 假设您的交易策略同时在NZD/USD和GBP/JPY上提供了卖出机会。通过KT货币对相关性功能,您发现这两个货币对的相关性达到77%。  由于这些货币对高度相关,同时交易它们只会加倍您的风险。如果在NZD/USD上出现亏损,GBP/JPY上的交易也很有可能出现亏损。 功能特点 快速识别最强和最弱货币,用以验证交易策略生成的交易机会。 通过避免交易高度相关的货币对,将风险降低一半甚至三分之一。 当某个货币成为最强或最弱时,接收警报通知。 通过货币金字塔分析强弱报告,将货币按强到弱进行排序。 详细了解货币强弱分析 货币强弱分析通
MACD Divergence Seeker
KEENBASE SOFTWARE SOLUTIONS
KT MACD Divergence Seeker trades the regular and hidden divergence signals generated by our free indicator named KT MACD Divergence indicator. Trading the standalone divergences can be a risky affair that's why the KT MACD Divergence Seeker combines the standard divergence signals with an advanced analysis module to exploit the price inefficiencies on some FX pairs. What is the Divergence exactly? As a general conception if the price is making higher highs, then macd should also be making hig
KT Asian Breakout Indicator
KEENBASE SOFTWARE SOLUTIONS
KT Asian Breakout 指标分析亚洲交易时段的关键部分,以生成双向买卖信号,并基于价格突破的方向进行交易。当价格突破该交易时段的最高点时,会出现买入信号;当价格突破最低点时,会出现卖出信号。 注意事项 如果交易时段的范围过大,建议避免新交易,因为大部分价格走势已在该时段内完成。 如果突破K线过大,价格通常会在继续沿信号方向运行之前发生短暂回调。 功能特点 买入/卖出信号包含止损和盈利目标。 KT Asian Breakout 指标持续监测其表现,并使用第一、第二或第三盈利目标作为成功标准。 显示三个关键性能指标,包括盈亏信号、成功率和每个信号的平均点数。 如果突破K线过大,图表上会显示警告信息。 推荐设置 时间周期: 15分钟。 交易货币对: 所有 JPY 货币对。 输入参数 绘制交易时段框 :  true/false 绘制止损和盈利目标 :  true/false 性能分析 : true/false 显示文本分析(左上角) :  true/false 成功率标准 :  第一目标 | 第二目标 | 第三目标 颜色和样式设置 :  可自定义 警报设置 :  可自定义
MACD Divergence MT4
KEENBASE SOFTWARE SOLUTIONS
KT MACD 背离指标显示价格与振荡器之间的常规背离和隐藏背离。如果你的交易策略是基于趋势反转,可以使用 MACD 的常规背离来捕捉潜在的转折点。而如果你的策略是基于趋势延续,MACD 的隐藏背离将是一个不错的选择。 KT MACD 背离的局限性 将 MACD 背离作为单独的入场信号可能存在一定风险。并非所有的背离都能解释为反转信号。为了获得更好的效果,建议将其与价格行为分析和其他交易方法结合使用。 功能特点 标记价格与振荡器之间的常规和隐藏背离。 为提高准确率并减少图表杂乱,会自动忽略不对称的背离。 支持趋势反转和趋势延续两种交易策略。 完全支持嵌入到智能交易系统中使用。 可用于入场信号和出场信号。 支持所有 MetaTrader 警报功能。 什么是背离? 一般来说,如果价格创出更高高点,那么振荡器也应创出更高高点;如果价格创出更低低点,那么振荡器也应同步走低。当这种正常的行为没有出现时,就表示价格和振荡器之间出现了背离。背离主要分为两种类型: 常规背离 常规看涨背离:当价格创出更低低点,但振荡器却创出更高低点。 常规看跌背离:当价格创出更高高点,但振荡器却创出更低高点。
KT Bollinger Bands Trader MT4
KEENBASE SOFTWARE SOLUTIONS
KT Bollinger Bands Trader 是一款 100% 自动化的智能交易顾问(EA),基于布林带在低波动时期的均值回归交易策略构建。价格经常在布林带的上轨或下轨附近产生反应,但并非每次都会发生反转。然而,在低波动期间,价格反转的可能性更高。 入场规则 当价格正确下穿布林带下轨时,开启买入交易。 当价格正确上破布林带上轨时,开启卖出交易。 出场规则 在低波动阶段结束时自动平仓。 也可在达到止损或止盈时平仓。 本 EA 在经典布林带策略基础上进行了诸多改进,允许用户通过内置的趋势过滤器、波动率过滤器、Vortex、MMI 和星期过滤器等工具,对策略进行细致调节。 输入参数 ----- 策略设置 ----- 布林带周期、带移位、带偏差 开始时间(Start Hour) 结束时间(End Hour) GMT 时区偏移(GMT offset) ----- 交易设置 ----- 手数类型:固定手数 | 自动手数 每单风险百分比(Risk Per Trade) ----- 出场设置 ----- 止损方式:无止损 | 基于波动率 | 固定点数 止盈方式:无止盈 | 基于波动率 |
KT CCI Divergence MT4
KEENBASE SOFTWARE SOLUTIONS
KT CCI Divergence shows the regular and hidden divergence created between the price and CCI oscillator. Divergence is one of the vital signals that depicts the upcoming price reversal in the market. Manually spotting the divergence between price and CCI can be a hectic and ambiguous task. Limitations of KT CCI Divergence   Using the CCI divergence as a standalone entry signal can be risky. Every divergence can't be interpreted as a strong reversal signal. For better results, try to combine it w
KT Heiken Ashi Smoothed MT4
KEENBASE SOFTWARE SOLUTIONS
KT Heiken Ashi Smoothed 是标准 Heiken Ashi 的平滑版本,同时在趋势反转处绘制买卖箭头,方便即时捕捉信号。凭借这种直观而即时的可视化,交易者能在快节奏的市场中快速做出判断。 当状态由空头转为多头时绘制买入箭头。 当状态由多头转为空头时绘制卖出箭头。 支持手机推送、邮件、声音与弹窗等多通道提醒,确保第一时间获知变动。 Heiken Ashi Smoothed 究竟是什么? 它通过双移动平均对标准 Heiken Ashi 进行二次平滑,过滤虚假信号与噪声。尽管会带来些许滞后,但能清晰揭示摆动点与新兴趋势,让原本肉眼难以分辨的价格动态变得一目了然。利用这些信息,交易者可相应地优化进出场、调整仓位、完善风控,以在外汇、商品乃至指数市场中把握先机。 应用场景 该指标适用于外汇、商品和股票等多种市场。以下五种核心用法可以帮助寻找交易机会和确认行情: 纯蓝色蜡烛且无下影线:显示强劲上升趋势。 纯红色蜡烛且无上影线:显示强劲下降趋势。 趋势拐点常伴随实体极小、上下影线较长的蜡烛,可视为转势信号。
KT MA Crossover MT4
KEENBASE SOFTWARE SOLUTIONS
KT MA Crossover 指标根据所选的移动平均线交叉绘制买入和卖出箭头。此外,它还会生成相应的提醒通知,并为每个连续信号显示 MFE(最大有利偏移)值,帮助交易者更好地了解潜在利润区域。 移动平均交叉策略是全球交易者广泛采用的一种经典技术分析方法。通常包含一条快速和一条慢速的移动平均线,根据交叉的方向来确定买入或卖出的交易信号。 买入信号 - 快速均线向上穿越慢速均线。 卖出信号 - 快速均线向下穿越慢速均线。 功能特点 每项均线参数都可完全自定义设置。 每个连续信号都会显示对应的 MFE 值。 代码轻量,占用系统资源极少。 包含所有 MetaTrader 系统提示和警报。 缺点  移动平均线是一种滞后性指标,主要依赖历史数据。在盘整行情中,均线交叉信号可能显得较为随机,容易产生假信号。因此,交易者在实际应用中需要根据自身判断灵活处理这些信号。 输入参数 历史K线数量:  用于计算信号的历史K线数量。 ----- 选择用于计算快慢移动平均的周期和方法 ----- 显示均线:  在图表上显示或隐藏移动平均线(不影响交叉信号)。 绘制利润线: 显示或隐藏 MFE 曲线。 
筛选:
无评论
回复评论