KT Power Pennant MT4
- 指标
-
KEENBASE SOFTWARE SOLUTIONS
 Keenbase Trading 致力于开发专业的 MetaTrader 4 和 MetaTrader 5 指标及智能交易系统(Expert Advisors),帮助全球交易者做出更加科学、更加理性的交易决策。
我们的产品将实用的交易逻辑与直观易用的设计相结合,重点关注稳定性、易用性以及完善的风险管理。每一款工具都经过严格测试,并针对真实市场环境进行优化,力求为交易者提供可靠且一致的使用体验。
无论您是手动交易者还是算法交易者,我们的目标都是提供能够简化市场分析、优化交易执行并提升交易信心的专业解决方案。 - 版本: 1.0
- 激活: 10
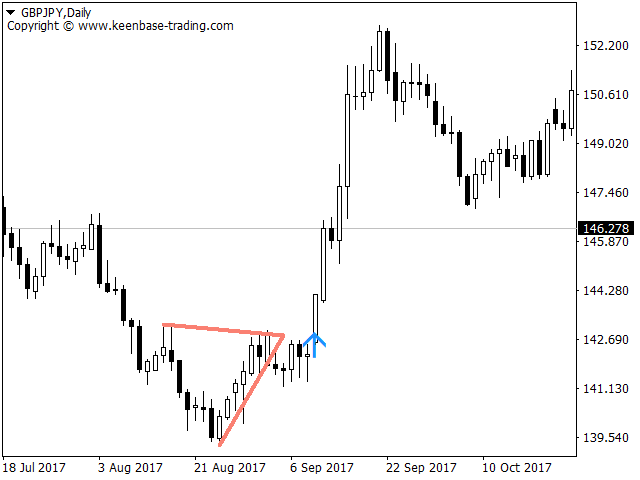
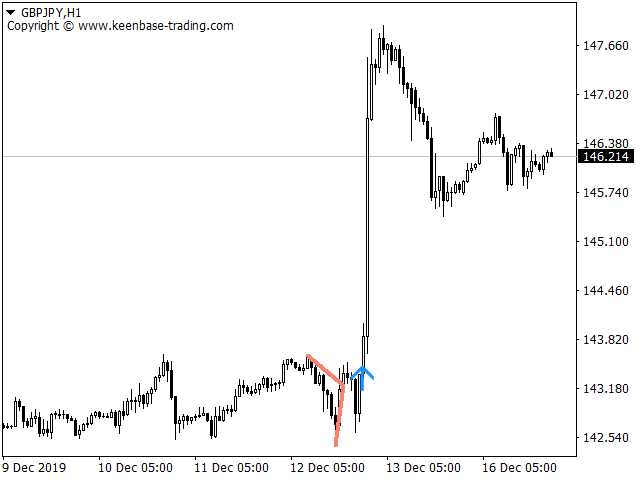
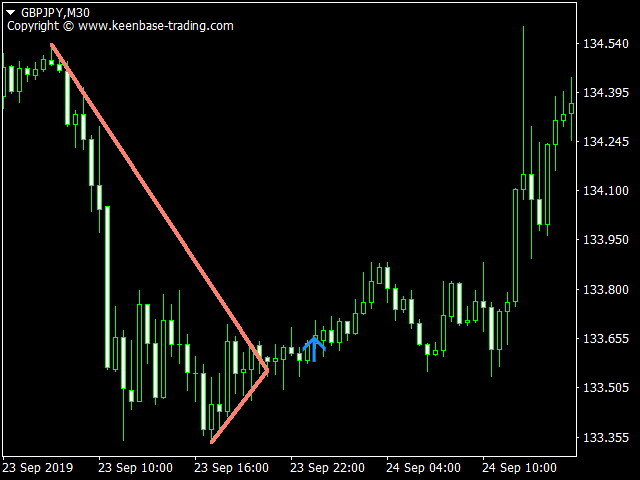
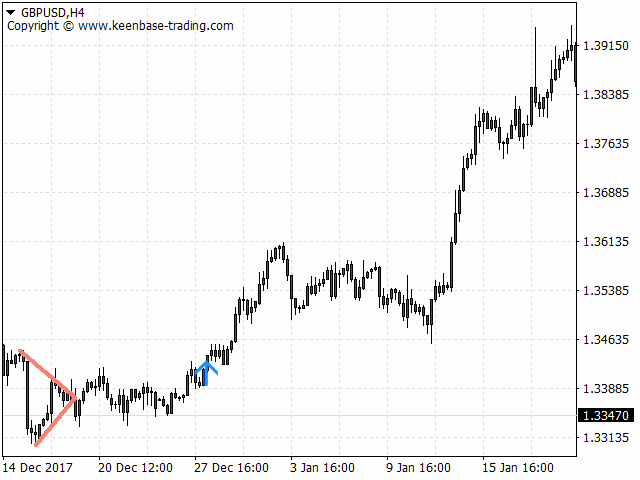
KT Power Pennant 会在图表上自动识别并标记著名的旗形形态。旗形是一种趋势延续形态,通常由单边的大幅价格波动开始,随后进入由收敛趋势线构成的盘整阶段。
当旗形形态完成后,系统会在突破发生时提供买入或卖出信号,具体取决于是向上突破还是向下突破。
功能特点
- 旗形形态在盘整期后出现突破时,提供低风险的入场机会。
- 结合其他技术分析工具使用时,KT Power Pennant 提供的信号具有更强的实用价值。
- 低成交量的盘整期后,伴随成交量放大的突破,常预示价格将延续原有趋势方向。
- 已集成所有 Metatrader 报警提醒功能。
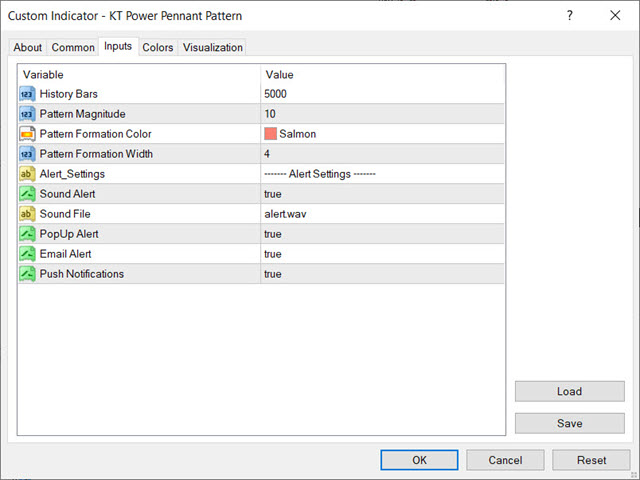
输入参数
- 历史K线数量: 用于识别历史旗形形态的K线数量。
- 形态幅度:用于设置旗形形态大小的整数值。
- 形态线颜色:用于绘制形态趋势线的颜色。
- 形态线宽度:用于设置趋势线的粗细。
- 其余参数为直观设定项,无需额外说明。