Option as Tax

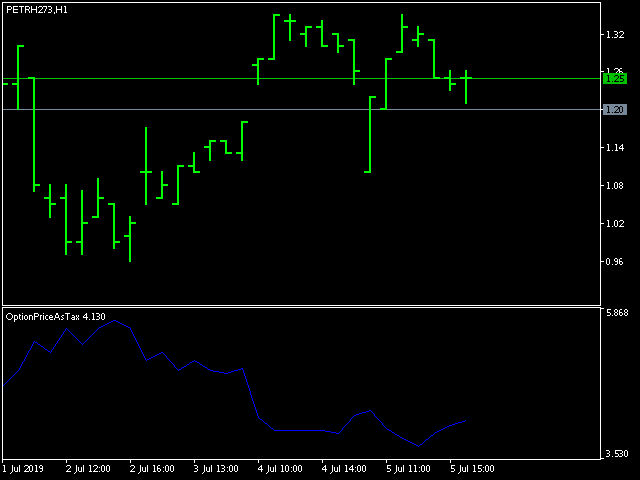
This indicator represent option and basis values as a tax, using this formula:

Tax = ( ( strike / ( basis - option ) ) - 1 ) * 100

It's not time based (don't use time to expire information) 

You can set a fixed strike value, and a fixed basis symbol if needed. Some exchanges/brokers don't provide this information at marketdata and that's the only method to use this information when not provided.


推荐产品
Ultra ZigZag
Fabio Luis Pretti
4.5 (2)
Simple indicator used in technical strategies to analyze tops, bottoms and reversal or continuation points. Developer information:  Line values and colors: Buffer 0 : ZigZag line value; Buffer 1 : ZigZag color value; Buffer 2 : Median line value; Buffer 3 : Median color value;   Buffer to get the values of each top and bottom. Buffer 4 : Top value; Buffer 5 :  Bottoms   value; Buffer that returns the type of the last direction. Buffer 9: 0 = Not updated, 1 = High, -1 = Low; This indic
FREE
Bollinger Bands Pure Sound Alert No Plots generates audio alerts when the price crosses either the upper or lower Bollinger Band. The indicator triggers distinct sound notifications when price moves above the upper band or below the lower band, helping traders identify potential overbought or oversold conditions. This no-plotting version operates without drawing any visual elements on your chart. Key customizable parameters include band period, deviation settings, and adjustable alert intervals
FREE
MTF Lines PRO
Renato Fiche Junior
5 (1)
This indicator was developed to support multiple timeframe analysis. In the indicator settings, the user can set the color, width, and style of the horizontal lines for each timeframe. This way, when the horizontal lines are inserted into the chart, they will be plotted with the timeframe settings. MTF Lines also allows visibility control of another objets like rectangles, trend lines and texts. This is a product developed by Renato Fiche Junior and available to all MetaTrader 4 and 5 users!
FREE
TG Ponto de Cobertura
Celestino Ferreira Gomes
覆蓋點/損益平衡點 (TG Ponto de Coverage/Breakeven) 此指標會檢視您當日相對於圖表上資產的交易結果,並在與未平倉部位的覆蓋點(損益平衡點)對應的價格處加上一條線,同時考慮入場價格和手數。新的入場操作後,覆蓋點將根據開倉操作的平均價格和手數重新計算。 如果當日結果為零,則會在目前交易的價格處顯示一條線。 如果當日結果為正(獲利),則會在價格中顯示一條線,指示操作的覆蓋點。 如果當日結果為負(虧損),則會在價格中顯示一條線,指示操作的恢復點。 已針對淨額結算帳戶進行測試 請對此指標進行評分並新增評論。 ...........................................
FREE
Pivot Point Fibo RSJ
JETINVEST
4.37 (19)
枢轴点斐波那契 RSJ 是一个指标,它使用斐波那契汇率追踪当天的支撑线和阻力线。 这个壮观的指标使用斐波那契汇率通过枢轴点创建多达 7 个支撑位和阻力位。 价格如何尊重该支撑和阻力的每个水平真是太棒了,在那里可以感知操作的可能进入/退出点。 特征 多达 7 个支撑位和 7 个阻力位 单独设置级别的颜色 输入 枢轴类型 Pivot Fibo RSJ1 = Fibo ratio 1 计算 Pivot Fibo RSJ2 = Fibo ratio 2 计算 Pivot Fibo RSJ3 = Fibo ratio 3 计算 Pivot Fibo Classic = 经典枢轴计算 最低枢轴级别 旋转 3 个级别 旋转 4 个级别 旋转 5 个级别 枢轴 6 个级别 旋转 7 个级别 如果您仍有疑问,请通过直接消息与我联系: https://www.mql5.com/zh/users/robsjunqueira/
FREE
Time Scale for MT5
Taras Slobodyanik
4.75 (28)
The indicator draws the time scale on the chart. You can specify the time offset, adjust the size and font to display on the chart ( it is displaying your local time on your chart instead of MT time ). You can also select the desired format for displaying the date and time. You may be interested in my other product , which contains a more advanced version of the Time Scale . You can also find my other products here Parameters Hours (time shift) — time shift (hours); Minutes (time shift) — time
FREE
High Low Open Close
Alexandre Borela
4.98 (42)
如果你象这个项目一样,就有5个饥饿审查。 这项指标采用了既定价格的公开、高、低价和关闭价格 可以对特定时间区加以调整。 许多机构和专业人士都认为这些是重要的。 贸易商可以为你了解他们可能更进一步的地点, 积极。 现有期间为: 前一日。 前一星期。 曾任Month。 曾任。 前一年。 或: 目前日。 目前周。 目前 Month。 目前配额。 今年。
FREE
提升您的价格行动交易,使用 Higher Highs and Lows MT5 指标,这是一个强大的工具,利用分形分析来精确定位关键摆动点,并识别定义趋势的模式,如 Higher Highs (HH)、Lower Highs (LH)、Lower Lows (LL) 和 Higher Lows (HL),以清晰洞察市场方向。源于 1900 年代初的道氏理论基础价格行动原则,并在现代交易中由专家如 Al Brooks 在其 "Trading Price Action" 系列中推广,这个指标已成为交易者识别趋势延续和反转的必备工具。它特别受欢迎于外汇、股票和加密交易者,因为它能够确认上升趋势 (HH/HL) 或下降趋势 (LL/LH),帮助过滤噪音、在回撤期间定时入场,并避免假突破——在波动会话中提高准确性,减少情绪决策,并在从剥头皮到持仓交易的策略中改善整体盈利能力。 Higher Highs and Lows MT5 在图表上直接叠加可自定义的箭头和文本标签,HH 用红色 (向下箭头符号 234),LH 用珊瑚色,LL 用绿色 (向上箭头 233),HL 用石灰绿色,允许在不杂乱的情
FREE
The   OHLC indicator   shows the current and historical values of High, Low, Open, Close and Mid for a specific time period. It can plot the current values or the values from the previous session. The indicator's range can be calculated from a daily, weekly, monthly, or user-specified session. Levels High  of the current or previous session. Low  of the current or previous session. Open  of current or previous session. Close  of the current or previous session. Midpoint  of the current or prev
FREE
The indicator detects and displays М. Gartley's Butterfly pattern. The pattern is plotted by the extreme values of the ZigZag indicator (included in the resources, no need to install). After detecting the pattern, the indicator notifies of that by the pop-up window, a mobile notification and an email. The pattern and wave parameters are displayed on the screenshots. The default parameters are used for demonstration purposes only in order to increase the amount of detected patterns. Parameters z
MultiTimeAnchor MA
Ramon Xavier Da Conceicao
MultiTimeAnchor MA 是您分析市场的全新得力助手!这个免费的指标展示了 三种不同的移动平均线 ,每种移动平均线都根据独特的时间周期进行了调整。这意味着您可以一次性查看市场在 短期、中期和长期 的表现,完全不需要切换图表。 您可以选择几种不同类型的移动平均线,如简单移动平均线、指数加权移动平均线、平滑移动平均线和加权移动平均线。您还可以选择使用 开盘价、最高价、最低价或收盘价 来计算平均值。这种灵活性使您能够获得更详细、准确的市场视图,帮助您识别市场趋势以及潜在的进出点。非常适合那些想要提高交易决策效率的人! --------------------------------------------------
FREE
MACD Colored ZeroLag
Farzin Sadeghi Bonjar
4.7 (10)
It is the MQL5 version of zero lag MACD that was available for MT4 here: https://www.mql5.com/en/code/9993 Also there was a colored version of it here but it had some problems: https://www.mql5.com/en/code/8703 I fixed the MT4 version which has 95 lines of code. It took me 5 days to write the MT5 version.(reading the logs and testing multiple times and finding out the difference of MT5 and MT4!) My first MQL5 version of this indicator had 400 lines of code but I optimized my own code again and n
FREE
TendencyLine
Samuel De Souza Ferreira
TendencyLine Indicator - Market Trend Analysis (An exclusive indicator by PPF - Past Project Future) General Description TendencyLine is a technical indicator developed by PPF - Past Project Future to help traders identify the prevailing market trend. It overlays a trend line based on a user-selected moving average on the price chart and displays a colored histogram that signals the trend direction. Main Features Trend Identification: The indicator differentiates between bullish and bear
FREE
EZ Advanced Dynamic RSI
Danijel Plesa
5 (2)
Advanced Dynamic RSI — Birthday Special (temporarily FREE) Why is it free right now? It’s our birthday — we’re giving back to the community. During this limited-time Birthday Special the indicator is fully functional (no feature locks) so you can experience dynamically adaptive RSI levels in your own workflow. After the promotion, the regular price will resume. Note: You can find our other professional Tools & High-End EAs (strategy EAs for trend and mean-reversion, plus analysis utilities) d
FREE
Curver Arrows
Francis Dube
3.75 (4)
本指标是一款众所周知的 MetaTrader 4 指标,现直接免费在互联网上提供。它完全不会重绘。 它实现了一类突破策略。箭头指示行情的方向。在 M15 或更高时间帧里使用此指标。
FREE
SeteMedias
Sonia Tait
Este indicador apresenta 7 médias configuráveis, que podem facilmente ser utilizadas em robôs ou em operações manuais. Facilita a identificação de tendências e reversões. Seus buffers estão ordenados e são facilmente identificáveis para utilizar em robôs. Liberado para uso em operações manuais ou automatizadas. Em breve vamos postar um robô que utiliza estas médias como parâmetro de negociação.
FREE
XCalper CandleTimer
Aecio de Feo Flora Neto
4.64 (14)
This auxiliary indicator displays time left before closing on the current timeframe with continuous update . It also shows the last trade price and variation from a previous day close in percentage and points. This indicator is pretty handy for daytraders and scalpers who want to precisely monitor closing and opening of candles. Indicator parameters Show in shifted end - Default: False. Display time and values on screen. If True, Displays only time to close aside last candle. Distance from the
FREE
Supertrend With CCI
Menaka Sachin Thorat
Supertrend with CCI Indicator for MQL5 – Short Description The Supertrend with CCI Indicator is a powerful trend-following tool that combines Supertrend for trend direction and CCI for momentum confirmation. This combination helps reduce false signals and improves trade accuracy. Supertrend identifies uptrends and downtrends based on volatility. CCI Filter ensures signals align with market momentum. Customizable Settings for ATR, CCI period, and alert options. Alerts & Notifications via
FREE
This indicator will mirror the assets in use in another metatrader, being able to choose the timeframe and a template. This is the Metatrader 5 Client, it needs the Metatrader 4 or 5 Server versions: Metatrader 4 Mirror Chart Server:   https://www.mql5.com/en/market/product/88644 Metatrader 5 Mirror Chart Server: https://www.mql5.com/en/market/product/88652 Details of how it works in the video.
FREE
Simple Dispertion Zones
Bruno Kamino Yamamoto
Simple Dispersion Zones is a powerful yet easy-to-use indicator that identifies key trading zones by analyzing price dispersion over the last N candles. It automatically detects areas of price consolidation and highlights them on the chart using a transparent red triangle, providing a clear visual representation of recent market structure. This tool is perfect for: Drawing trend channels Identifying sideways market zones Supporting breakout and mean-reversion strategies With its clean and non-in
Volumized Order Blocks
Rizwan Akram
5 (1)
VOLUMIZED ORDER BLOCKS [Riz] - MT5 Indicator             Smart Money Order Block Detection with Volume Analysis Volumized Order Blocks is an advanced Smart Money Concepts (SMC) indicator that automatically detects institutional order blocks with integrated volume analysis. It identifies high-probability supply and demand zones where banks and institutions
FREE
Important Lines
Terence Gronowski
4.87 (23)
This indicator displays Pivot-Lines, preday high and low, preday close and the minimum and maximum of the previous hour. You just have to put this single indicator to the chart to have all these important lines, no need to setup many single indicators. Why certain lines are important Preday high and low : These are watched by traders who trade in a daily chart. Very often, if price climbs over or falls under a preday low/high there is an acceleration in buying/selling. It is a breakout out of a
FREE
MACD indicators
Xiao Dong Feng
MACD indicators https://mql5.com This MACD indicator looks slightly different from the MACD indicator found in many other charting software. When the value of the signal line parameter is greater than the value of the MACD parameter, the indicator will give a buy prompt, and when the signal line parameter is less than the value of the MACD parameter, the indicator will give a sell prompt.
FREE
Show Pips for MT5
Roman Podpora
4.67 (24)
对于那些总是想了解帐户当前情况的人来说,此信息指示器将很有用。 -   更多有用的指标 该指标显示诸如利润点数、百分比和货币等数据,以及当前货币对的点差以及柱在当前时间范围内收盘的时间。 有多种选项可用于将信息线放置在图表上: 价格右侧(运行在价格后面); 作为评论(在图表的左上角); 在屏幕的选定角落。 还可以选择信息分隔符: | / \ # 该指标易于使用且信息丰富。可以在设置中禁用不必要的信息项目。 设置 外观类型     - 信息行的显示类型。有以下三种选择: 跟随价格     - 遵循价格; 作为评论     - 作为评论; 在屏幕的选定角落     - 在屏幕的选定角落。 附件图角     - 如果您选择屏幕选定角的显示类型,则此项目允许您选择四个捕捉角之一; 显示利润?       - 该参数负责以存款货币显示利润; 以百分比显示利润?       - 该参数负责以百分比形式显示利润; 显示传播?       - 该参数负责显示当前点差; 显示酒吧关闭时间?       - 该参数负责显示柱关闭之前的时间; 文字颜色     - 文字颜色; 盈利颜色     - 存在
FREE
Expansoes M
Marcus Vinicius Da Silva Miranda
The M Extensions are variations of the Golden Ratio (Fibonacci Sequence). It is the World's first technique developed for Candle Projections. Advantages: Easy to plot. Candle anchoring; High and accurate precision as support and resistance; Excellent Risk x Return ratio; Works in any timeframe; Works in any asset / market.   The M Extensions are classified into: M0: Zero point (starting candle) RC: Initial candle control region M1: Extension region 1 M2: Extension region 2 M3: Extension regi
FREE
Exact Neuron Genuine Algo Genius Engaged
Toha Arekaatera Akutina Gage
5 (3)
!! THE FIRST FREE NEURAL NETWORK EA WITH EXCELLENT AND REALISTIC RESULTS.!! Another beautiful work of art, guys you don't know the powerful creations that are created by my developer Nardus Van Staden. Check him out guys and gals, he is the real deal, an amazing person and a professional when it comes to coding and business, if you want work done!, hit him up! you can get in contact with him HERE . THE FOLLOWING PRODUCT IS A FREE VERSION OF A PAID VERSION THAT IS TO COME, PROFITS ARE GOING TO B
FREE
Price Momentum
Flavio Javier Jarabeck
4.92 (12)
Value Chart indicator presents the Price evolution in a new form. This indicator, Price Momentum , was developed taking all the calculations presented in the book " Dynamic Trading Indicators " by Mark W. Helweg and David Stendahl (2002). The technique involves de-trended Prices from a user-defined Period of analysis and the addition of a Volatility index correction. The result is an Oscillator with 3 zones: Fair Price Value, Overbought/Oversold and Extremely Overbought/Oversold zones. Adding th
FREE
MA Color Candles
Vladimir Kuzmin
MA Color Candles Indicator MA Color Candles is an indicator for visually displaying market trends by coloring chart candles. It does not add objects or distort price data, instead coloring real candles based on the state of two moving averages. This enables quick trend assessment and use as a filter in trading strategies. How It Works Bullish trend: Fast MA above slow MA, slow MA rising (green candles). Bearish trend: Fast MA below slow MA, slow MA falling (red candles). Neutral state: Candles
FREE
Trend Slayer Indicator
Felipe Carvalho De Queiroz
Trend Indicator Pro Use any currency and any time period you want For greater profitability use a risk return of at least 1:3 or 1:4 Entry Signal : Appears after the moving average crossover closes ️️ Histogram Flip : Signals important trend changes ️ Easy to use : Perfect for those who want fast, confident decisions! Boost your accuracy : Find the best market entry moments with more confidence! Get straight to the point and seize the best trend opportunities!
Simple divergence
Vadim Zotov
5 (2)
The indicator plots a curve of the difference between the values ​​of two trading instruments (currency pairs). The purpose of the indicator is to observe the processes of divergence and convergence of the values ​​of two trading instruments. The results obtained can be used for trading strategies of statistical arbitrage, pair trading, correlation, and others. Trading strategy The indicator is attached to the chart of any trading instrument. In the input parameters, the names of trading instr
FREE
该产品的买家也购买
购买此指标即可免费获得我的专业交易管理器。 首先,值得强调的是,这个交易系统是一个非重绘、非重画和非滞后的指标,这使得它非常适合手动和机器人交易。 在线课程,手册和下载预设。 “智能趋势交易系统 MT5”是专为新手和经验丰富的交易者量身定制的综合交易解决方案。它结合了超过 10 个优质指标,具有 7 多个强大的交易策略,使其成为适用于各种市场条件的多功能选择。 趋势跟随策略:提供精确的入场和止损管理,以有效地跟随趋势。 反转策略:识别潜在的趋势反转,使交易者能够利用区域市场的机会。 剃头策略:专为快速准确的日内交易和短期交易而设计。 稳定性:所有指标都不会重绘、不会重画和不会滞后,确保可靠的信号。 定制:支持自定义策略,以满足个人交易偏好。超过 7 种策略和组合可帮助您找到最佳策略。 信号清晰度:提供箭头信号,以指示清晰的入场和退出点。 实时警报:通过交易进出警报使交易者保持了解。 深入分析:提供更高时间框架的趋势分析和实时交易监控。 自适应颜色编码:利用蜡烛颜色编码来显示成交量、趋势和反转蜡烛信号。通过蜡烛颜色分析市场方向。 “智能趋势交易系统 MT5”赋予交易者必要的工具,以便在
Divergence Bomber
Ihor Otkydach
4.99 (75)
购买该指标的每位用户将额外免费获得以下内容: 原创工具“Bomber Utility”,该工具会自动跟踪每一笔交易,设置止损和止盈点,并根据策略规则自动平仓; 适用于不同交易品种的指标设置文件(Set 文件); 三种不同风险模式下的 Bomber Utility 设置文件:“最低风险”、“平衡风险” 和 “观望策略”; 一套详细的 视频操作手册,帮助您快速完成安装、配置并开始使用本交易系统。 注意: 要获取以上所有赠品,请通过 MQL5 的私人消息系统联系卖家。 我为您介绍原创的自定义指标 “Divergence Bomber”(背离轰炸机),它是一套基于 MACD 背离交易策略 的“全功能”交易系统。 该技术指标的主要任务是识别 价格与 MACD 指标之间的背离,并发出交易信号(包括推送通知),指示未来价格可能的运动方向。平均而言,这些信号的准确率超过 98%。有关该指标如何工作的详细说明,请观看本页面上的视频演示。 该系统使用 止损订单 和 动态回撤平仓机制 来管理交易。 Divergence Bomber 指标的主要特点: 支持交易的品种: AUDCAD、AUDCHF、AUDSG
Gold Sniper Scalper Pro
Ich Khiem Nguyen
5 (3)
Gold Sniper Scalper Pro - MetaTrader 5 黄金 (XAU/USD) 交易系统 专为认真的交易者设计: 采用结构化、数据驱动的方法进行黄金交易,该方法结合了多种市场分析因素。此工具旨在支持您的黄金交易分析。 限时价格机会 这是在价格上涨之前拥有 Gold Sniper Scalper Pro 的机会。 产品价格将在每接下来的 10 次购买后增加 $50。 最终价格: $498 定义您的分析优势的功能 Gold Sniper Scalper Pro 是一个全面的工具包,旨在为您提供深刻见解和清晰的统计优势: 详细的指标使用指南,包括系统信息、输入自定义设置以及指标使用注意事项,已在下方 MQL 文章中呈现。请参阅该文档。 Gold Sniper Scalper Pro - Gold (XAU/USD) Trading System on MetaTrader 5 - Trading Systems - 8 November 2025 - Traders' Blogs 多算法架构: 系统的核心是多个分析算法的智能组合,它们同步运行以过滤市场噪音并确定潜在
FX Power MT5 NG
Daniel Stein
5 (27)
FX Power:分析货币强度,助您做出更明智的交易决策 概述 FX Power 是一款专业工具,帮助您全面了解主要货币和黄金在任何市场条件下的真实强度。通过识别强势货币用于买入,弱势货币用于卖出, FX Power 简化了交易决策,并帮助您发现高概率的交易机会。不论您是想跟随趋势还是通过极端的 Delta 值预测反转,这款工具都能完美适应您的交易风格。别再盲目交易——用 FX Power 让您的交易更加智慧。 1. 为什么 FX Power 对交易者极具价值 实时货币和黄金强度分析 • FX Power 实时计算并显示主要货币和黄金的相对强度,助您全面了解市场动态。 • 监控领先或落后资产,轻松识别值得交易的货币对。 全面的多时间框架视图 • 跟踪短期、中期和长期时间框架的货币和黄金强度,以便将您的交易策略与市场趋势保持一致。 • 无论是快进快出的短线交易还是更长期的投资策略, FX Power 都能为您提供所需的信息。 Delta 动态分析用于趋势和反转 • 极端 Delta 值常常预示反转机会,而平缓的 Delta 变化则确认趋势延续。 • 使用 Delta 分析,轻
Entry In The Zone and SMC Multi Timeframe 是一款基于 Smart Money Concepts(SMC) 开发的实时市场分析工具,旨在帮助交易者以系统化方式分析市场结构,并更加清晰地掌握整体市场方向。 系统能够在多周期中自动分析 反转点、关键价格区域以及市场结构 ,并显示 兴趣点(POI) 、 无重绘信号 以及 自动斐波那契水平(Auto Fibonacci Levels) ,用于精准识别回调位置与潜在反转点。 系统提供的 实时信号与提醒功能 可确保当价格进入关键区域或在区域内出现反转信号时,交易者不会错过重要机会。 此外,本系统同时具备 指标功能 和 信号系统功能(2 合 1) ,将区域分析与实时入场信号集成于同一工具中。所有参数亦可完全自定义,以适配任何交易风格。 ------------------------------------------------------------------------------ 免费赠送!FABLE Pro Suite — 为智能资金交易者打造的一体化交易工具包 购买此指标后,您将免费获得 F
Smart Stop Indicator – 智能化止损逻辑,直接呈现在您的图表上 概述 Smart Stop Indicator 是为希望以清晰、系统、非情绪化方式设置止损的交易者量身打造的工具。它将经典的价格结构逻辑(更高的高点、更低的低点)与现代突破识别技术相结合,精准标记真正合理的止损位置。无论是趋势、盘整还是快速突破行情,指标都会在图表上直接显示最佳 SL 区域及其状态(“new”、“broken”、“valid”)并且现在新增 SL 与 %ADR 的距离显示。 亮点 基于市场结构的自动止损识别 • 根据市场结构与实时价格行为自动识别关键止损位置。 智能突破适应能力 • 能适应突破与快速方向变化,不会强迫过早调整止损。 SL %ADR 显示 • 显示止损距离占平均日波动范围 ADR 的百分比与 Smart Stop Scanner 完全一致帮助交易者即时识别紧密机会或已延伸的行情。 内置警报逻辑 • 当止损水平变为“new”、“valid”或“broken”时触发警报包含准确的状态切换与冷却逻辑。 破损级别的淡化显示 • 对于“broken”状态的方向、价格、S
Atomic Analyst MT5
Issam Kassas
4.31 (26)
首先值得强调的是,该交易指标是非重绘、非延迟的指标,这使其成为手动和机器人交易的理想选择。 用户手册:设置、输入和策略。 Atomic Analyst是一种PA价格行动指标,利用价格的力量和动量来寻找市场上更好的机会。配备了高级过滤器,可帮助去除噪音和假信号,并提高交易潜力。使用多层复杂的指标,Atomic Analyst扫描图表,并将复杂的数学计算转化为任何初学者都能理解并用来做出一致交易决策的简单信号和颜色。 “Atomic Analyst”是专为新手和经验丰富的交易者量身定制的综合交易解决方案。它将高级指标和一流功能融合为一体的交易策略,使其成为所有类型交易者的多功能选择。 日内交易和剥头皮策略:专为快速准确的日内交易和短期交易而设计。 日内和摆动交易策略:可用作追求价格大幅波动的日内和摆动交易者的可靠工具。 多货币和市场:凭借其可靠的精度,在不同的工具和市场上运作。 多个时间框架:可在多个时间框架上使用,性能良好。 稳定性:所有指标均不重绘、不重绘和不滞后,确保可靠的信号。 信号清晰度:提供箭头信号,用于清晰的入场和出场点。 实时警报:通过交易入场、SL和TP警报通知交易者
Trend Screener Pro MT5
STE S.S.COMPANY
4.84 (99)
使用趋势筛选指标释放趋势交易的力量:由模糊逻辑和多货币系统提供支持的终极趋势交易解决方案! 使用趋势筛选器(由模糊逻辑提供支持的革命性趋势指标)提升您的趋势交易。 它是一个强大的趋势跟踪指标,结合了超过 13 种高级工具和功能以及 3 种交易策略,使其成为使您的 Metatrader 成为趋势分析器的多功能选择。 限时优惠:趋势筛选指标终身仅需 50 美元。 ( 原价 250$ ) (优惠延长) 体验趋势筛选器 100% 无需重新绘制的准确性,确保您的交易决策不受过去价格变化的影响。 释放多时间框架和多货币功能的多功能性,使您能够以无与伦比的信心在外汇、商品、加密货币和指数领域进行交易。 利用 Trend Screener 的综合策略套件增强您的交易: - 趋势跟踪策略和趋势延续策略 :趋势筛选器的趋势跟踪策略提供清晰的趋势延续信号,让您有效捕捉趋势走势并管理风险。 - 反转策略和早期入场点策略 :趋势筛选器的反转策略可检测市场方向的潜在变化,使您能够预测趋势反转并利用疲弱的市场趋势。通过早期入场点,您可以在潜在的趋势变化之前定位自己 获取可观的利润。 - 倒卖策略: 趋势筛选器的倒卖
Game Changer Indicator mt5
Vasiliy Strukov
5 (4)
Game Changer 是一款革命性的趋势指标,适用于任何金融工具,可将您的 MetaTrader 平台升级为强大的趋势分析工具。该指标不会重绘,也不会出现滞后。它适用于任何时间范围,有助于识别趋势,发出潜在反转信号,可用作追踪止损机制,并提供实时警报,以便您快速做出市场反应。无论您是经验丰富的交易员、专业人士,还是寻求优势的初学者,这款工具都能帮助您自信、自律地进行交易,并清晰地了解潜在的趋势动态。 购买后立即联系我,即可获得个人奖励!您可以免费获得我们的强力支撑和趋势扫描指标,请私信我! 请注意,我不在 Telegram 上出售我的 EA 或特殊套件,它们仅适用于 MQL5,我的套件文件也仅在我的博客上提供。 请小心诈骗者 ,不要从其他人那里购买任何套件! 设置 启用趋势变化警报 - 真/假 - 趋势变化时在图表上显示警报 发送推送通知 - 真/假 - 启用手机推送警报通知 发送邮件通知 - 真/假 - 发送趋势变化的邮件通知到电子邮件
- Real price is 80$ - 45% Discount (It is 45$ now) Contact me for extra bonus   indicator, instruction or any questions! - Lifetime update free - Non-repaint - Related product: Gann Gold EA - I just sell my products in Elif Kaya Profile, any other websites are stolen old versions, So no any new updates or support. Advantages of  M1 Scalper Pro  Profitability: M1 Scalper Pro is highly profitable with a strict exit strategy. Frequent Opportunities: M1 Scalper Pro  takes advantage of numerous smal
首先,值得强调的是,这个交易工具是非重绘、非重画和非滞后的指标,非常适合专业交易。 在线课程,用户手册和演示。 智能价格行动概念指标是一个非常强大的工具,既适用于新手,也适用于经验丰富的交易者。它将超过20个有用的指标合并到一个指标中,结合了高级交易思想,如内圈交易员分析和智能资金概念交易策略。该指标侧重于智能资金概念,提供有关大型机构交易方式的见解,帮助预测它们的动向。 它在流动性分析方面尤其擅长,有助于理解机构的交易方式。它擅长预测市场趋势,并仔细分析价格波动。通过将您的交易与机构策略对齐,您可以更准确地预测市场走向。该指标多才多艺,擅长分析市场结构,识别重要的订单区块,并识别各种模式。 它擅长识别BOS和CHoCH等模式,理解动量的转变,并突出显示供需强劲的关键区域。它还擅长发现强大的不平衡,并分析价格创造更高高点或更低低点的模式。如果您使用斐波那契回撤工具,该指标可以满足您的需求。它还可以识别相等的高点和低点,分析不同的时间框架,并通过仪表板显示数据。 对于使用更高级策略的交易者,该指标提供了工具,如公平价值差指标和优惠和折扣区域的识别。它特别关注高时间框架订单区块,并
Trend indicator AI mt5
Ramil Minniakhmetov
5 (12)
趋势人工智能指标是一个伟大的工具,将加强交易者的市场分析结合趋势识别与可操作的进入点和逆转警报。 该指标使用户能够自信和精确地驾驭外汇市场的复杂性 除了主要信号,趋势Ai指标识别在回调或回调期间出现的次要入口点,使交易者能够利用既定趋势内的价格修正。 重要优势: *MT4及MT5工程 *明确买入或卖出信号 ·不重绘 *适用于所有资产 小心我不卖EA或设置电报它骗局. 所有设置免费在这里的博客。  重要! 购买后立即与我联系,以获得指示和奖金! 真实的操作监控以及我的其他产品可以在这里找到: https://www.mql5.com/en/users/mechanic/seller&nbsp ; 设置和输入: 建议为所有资源设置默认设置。 第...
Quantum TrendPulse
Bogdan Ion Puscasu
5 (19)
介绍 Quantum TrendPulse   ,这是一款终极交易工具,它将 SuperTrend   、   RSI 和 Stochastic 的强大功能整合到一个综合指标中,以最大限度地发挥您的交易潜力。该指标专为追求精准和效率的交易者而设计,可帮助您自信地识别市场趋势、动量变化以及最佳进入和退出点。 主要特点: 超级趋势整合: 轻松跟随当前的市场趋势并乘上盈利浪潮。 RSI 精度: 检测超买和超卖水平,非常适合把握市场逆转时机,可用作 SuperTrend 的过滤器 随机精度: 利用随机振荡在波动的市场中寻找隐藏的机会, 用作超级趋势的过滤器 多时间范围分析: 从 M5 到 H1 或 H4,在不同时间范围内关注市场动态。 可定制的警报: 当您的自定义交易条件得到满足时收到通知,这样您就不会错过任何交易。 无论您是新手还是经验丰富的交易员,   Quantum TrendPulse 都能为您提供所需的优势,帮助您增强策略并自信地进行交易。借助这一强大的指标,将洞察力转化为利润 — 掌控您的交易! ***购买 Quantum TrendPulse,即可免费获得 Quantum Tr
Grabber System MT5
Ihor Otkydach
5 (19)
向您介绍一款优秀的技术指标——Grabber,它是一套即开即用的“全包式”交易策略。 在一个代码中集成了强大的市场技术分析工具、交易信号(箭头)、提醒功能和推送通知。 每位购买该指标的用户还可免费获得以下内容: Grabber辅助工具:用于自动管理已开仓位 视频操作指南:逐步教学如何安装、设置和使用该指标进行交易 原创Set文件:可快速自动配置,帮助实现最佳交易效果 忘掉其他策略吧!只有Grabber能够真正激励你在交易中攀登新高峰! Grabber策略的主要特点: 交易周期:从M5到H4 适用资产:任意,但我推荐我亲自测试过的品种(GBPUSD、GBPCAD、GBPCHF、AUDCAD、AUDUSD、AUDSGD、AUDCHF、NZDUSD、NZDCAD、EURCAD、EURUSD、EURAUD、EURGBP、EURCHF、USDCAD、USDSGD) 交易时间:全天候 24/7 交易效果:我分享自己的真实交易结果,并在此教学如何操作: https://www.mql5.com/ru/market/product/134563?source=Site+Market+MT5+Indic
Advanced Currency Strength28 MT5
Bernhard Schweigert
5 (3)
任何新手或专家交易者的最佳解决方案! 这个指标是一个独特的、高质量的、可负担得起的交易工具,因为我们纳入了一些专有的功能和一个新的公式。只需一个图表,你就可以读出28个外汇对的货币强度!想象一下,你的交易将如何得到改善,因为你的交易是在你的手中进行的。想象一下,你的交易将如何改善,因为你能够准确地确定新趋势或剥头皮机会的触发点? 用户手册:点击这里  https://www.mql5.com/en/blogs/post/697384 这是第一本,原版的! 不要买一个毫无价值的崇拜者的克隆品。 特别的 子窗口中的箭头显示强劲的货币势头GAP将指导你的交易! 当基础货币或报价货币处于超卖/超买区域(外盘斐波那契水平)时,在个人图表的主窗口中出现警告信号。 当货币力量从外围区间回落时,回撤/反转警报。 十字星模式的特别警报 可选择多个时间框架,以快速查看趋势! 货币强度线在所有的时间框架中都非常平稳,当使用较高的时间框架来识别总体趋势,然后使用较短的时间框架来确定精确的入口时,效果非常好。你可以根据自己的意愿选择任何时间框架。每个时间框架都由其自身进行了优化。 建立在新的基础算法
IX Power MT5
Daniel Stein
4.91 (11)
IX Power:解锁指数、大宗商品、加密货币和外汇市场洞察 概述 IX Power 是一款多功能工具,可分析指数、大宗商品、加密货币和外汇市场的强弱表现。 FX Power 提供针对货币对的最高精度,利用所有可用货币对数据进行分析,而 IX Power 专注于基础资产的市场数据。这使得 IX Power 成为非外汇市场的理想选择,同时在需要简单外汇分析时也非常可靠。它可以无缝适用于任何图表,提供清晰的、有行动价值的洞察,帮助提升您的交易决策。 1. 为什么 IX Power 对交易者非常有价值 多市场强弱分析 • IX Power 分析指数、大宗商品、加密货币和外汇市场的强弱表现,为每个市场提供量身定制的洞察。 • 监控 US30、WTI、黄金、比特币等资产的表现,发现交易机会。 适用于更广泛的市场 • 对于外汇交易, FX Power 提供无与伦比的精度,通过分析所有相关货币对。 • IX Power 专注于基础资产的市场数据,非常适合非外汇市场及简化的外汇分析。 实时适应性 • 借助自适应算法, IX Power 实时响应市场数据变化,保持分析的最新性。 • 实时更新
TPSproTREND PrO MT5
Roman Podpora
4.53 (19)
立即购买 TREND PRO 并免费获得另一个高级趋势指标 如需接收,请写私人消息。 VERSION MT4     -     ИНСТРУКЦИЯ RUS       -     INSTRUCTIONS  ENG 主要功能: 准确的输入信号,无需渲染! 如果出现信号,它仍然相关!这是与重提指标的一个重要区别,重提指标可以提供信号然后改变信号,这可能导致存款资金的损失。现在您可以以更高的概率和准确度进入市场。还有一个功能是在箭头出现后为蜡烛着色,直到达到目标(止盈)或出现反转信号。 显示止损/获利区域 为了提高搜索切入点时的视觉清晰度,创建了一个模块,该模块最初显示买入/卖出区域,在该区域中搜索进入市场的最佳点。用于处理止损水平的附加智能逻辑有助于随着时间的推移减小其大小,从而降低进入交易(移动 sl)时的初始风险。 显示较高时间范围内的最小值/最大值(MTF 模式) 添加了一项功能,可以显示较高时间间隔的最小/最大校正位置,并显示趋势变化。此外,MIN/MAX 现在有编号,显示修正内容。 风险回报率 (RR) 使用指标算法,可以检测精确的入场点,平均风险回报比超过1k2。
Shock Pullback
Suleiman Alhawamdah
5 (1)
简单来说,当白色数字(称为“点”)开始出现在当前蜡烛图旁边时,您就可以开始交易了。白色“点”表示当前的买入或卖出交易正在进行,并且方向正确,其白色即为标志。当白色点的移动停止并变为静态绿色时,这表示当前动能已结束。绿色数字表示以“点”为单位的总利润,无论是来自买入还是卖出交易。 此外,还可以通过指标中的其他高级专业分析工具来开仓。通过观察指标中显示的信号和颜色,您可以高精度地捕捉大量剥头皮交易机会。只需确保在测试或实时图表中理解该指标的运作方式。 适用于大多数外汇市场:非常适合交易黄金和热门指数市场——道琼斯、标普500、纳斯达克、DAX等,以及外汇货币对如欧元/美元、英镑/美元、美元/日元等众多强势货币对。也支持主要加密货币如比特币、以太坊和稳定币——非常适合在数字资产与传统市场之间进行多元化策略。 限时特价优惠。 Shock Pullback 指标在识别回调和积累区域方面是一项真正的突破。它基于完全创新的算法构建,使交易者能够轻松而清晰地识别交易机会、跟踪价格走势,并检测回调、积累区域、缺口和突破。 Shock Pullback V 3.3 新版本更新 Shock Pullbac
Step into the world of Forex trading with confidence, clarity, and precision using Gold Indicator a next-generation tool engineered to take your trading performance to the next level. Whether you’re a seasoned professional or just beginning your journey in the currency markets, Gold Indicator equips you with powerful insights and help you trade smarter, not harder. Built on the proven synergy of three advanced indicators, Gold Indicator focuses exclusively on medium and long-term trends elimina
FX Volume MT5
Daniel Stein
4.86 (22)
FX Volume:从经纪商视角洞察真实市场情绪 简要概述 想要提升您的交易策略? FX Volume 可提供零售交易者和经纪商的持仓实时数据——远早于诸如 COT 之类的延迟报告。不论您希望获得持续稳定的收益,还是想在市场中多一分制胜的砝码, FX Volume 都能帮您识别重大失衡、确认突破以及完善风险管理。立即开启体验,让真实的成交量数据为您的交易决策带来革新! 1. 为什么 FX Volume 对交易者格外有用 极具准确度的早期预警 • 快速捕捉有多少交易者正在买入或卖出某个货币对——比大多数人提前一步。 • FX Volume 是 唯一 能够整合多家零售经纪商真实成交量数据并以简洁方式呈现的工具。 强力风险管理 • 及时识别多头或空头仓位的巨大不平衡,这往往预示着潜在的趋势反转,帮助您更自信地设置止损和目标位。 • 独家而真实的数据让每一次交易决策更具可靠性。 优化进场与出场点 • 发现“过度集中”的交易(大多数交易者都在同一方向),并通过真实成交量来确认突破。 • 避免依赖常见指标可能带来的误导信号,而是利用真实的实时成交量。 适配各种交易策略 • 将 FX
FX Levels MT5
Daniel Stein
5 (11)
FX Levels:适用于所有市场的高精度支撑与阻力 快速概览 想要精准确定适用于任何市场(外汇、指数、股票或大宗商品)的支撑与阻力吗? FX Levels 将传统的“Lighthouse”方法与前沿的动态分析相结合,实现近乎通用的准确性。依托真实经纪商经验和自动化的每日与实时更新, FX Levels 帮助您捕捉价格反转点、设置合理的盈利目标,并自信地管理交易。立即使用,体验更准确的支撑/阻力分析如何助力您的交易更上层楼! 1. 为什么 FX Levels 对交易者非常有利 极度精准的支撑 & 阻力区 • FX Levels 专为不同经纪商提供的行情源和时间设置而设计,可生成几乎相同的价位区,解决数据不一致的常见问题。 • 这意味着无论您在哪里交易,都能获得稳定一致的水平线,为策略打下更加牢固的基础。 结合传统与先进技术 • 通过将久经考验的“Lighthouse”方法与动态分析相融合, FX Levels 不仅限于每日刷新,还可针对新的价格波动进行即时更新。 • 您可以选择经典的静态方式,或实时捕捉新出现的水平,以贴近最新的市场行为。 识别清晰的反转点 • FX Lev
AriX
Temirlan Kdyrkhan
1 (4)
AriX Indicator for MT5 A powerful trend-following and signal-evaluation tool AriX is a custom MT5 indicator that combines Moving Averages and ATR-based risk/reward logic to generate clear buy/sell signals. It visualizes dynamic SL/TP levels, evaluates past trade outcomes, and displays win/loss statistics in a clean on-chart panel. Key features include: Buy/Sell signals based on MA crossovers ATR-based SL/TP1/TP2/TP3 levels with visual lines and labels Signal outcome tracking with real-time stat
描述 ICSM(脉冲-修正SCOB映射器)是一个分析价格走势并识别有效脉冲、修正和SCOB(单蜡烛订单块)的指标。它是一个强大的工具,可以与任何类型的技术分析一起使用,因为它灵活、信息丰富、易于使用,并且能显著提高交易者对最具流动性的兴趣区域的认识。 设置 常规 | 视觉 颜色主题 — 定义ICSM的颜色主题。 SCOB | 视觉 显示SCOB — 启用/禁用SCOB; 标记SCOB — 代表SCOB表示的样式选项列表; SCOB颜色 — 定义SCOB的颜色; ICM | 视觉 显示ICM线 — 启用/禁用ICM(脉冲-修正映射器)线; 显示IC趋势 — 通过图表底部的彩色分隔线启用/禁用脉冲-修正趋势的可视化; 线条颜色 — 定义ICM线的颜色; 线条样式 — 定义ICM线的样式; 警报 ICM — 启用/禁用突破ICM线的警报; SCOB — 启用/禁用SCOB创建的警报; ICM+SCOB — 启用/禁用在单个脉冲/修正结束时出现SCOB的警报,该SCOB抓取ICM线的流动性。 ICM+SCOB(同一蜡烛) — 启用/禁用在抓取ICM线流动性
Quantum Trend Sniper
Bogdan Ion Puscasu
4.73 (52)
介绍   量子趋势狙击指标 ,突破性的 MQL5 指标,正在改变您识别和交易趋势反转的方式!由拥有超过13年交易经验的资深交易员团队开发,     量子趋势狙击指标   旨在通过其创新的方式以极高的准确度识别趋势反转,将您的交易之旅推向新的高度。 ***购买量子趋势狙击指标,即可免费获得量子突破指标!*** 当量子突破指标识别出趋势反转时,它会向您发出警报和信号箭头,并建议您三个止盈水平。 它既适合新手交易者,也适合专业交易者。 量子 EA 通道:       点击这里 MT4版本:       点击这里 建议: 时间范围: 所有时间范围。为了获得最佳结果,我们建议在 M15、M30 和 H1 时间范围内使用它。 货币对:欧元兑美元、英镑兑美元、澳元兑美元、欧元兑英镑、, EURAUD,  XAUUSD 账户类型:ECN、Raw 或 Razor,点差极低 经纪时间:任意 经纪商:IC Markets、Pepperstone with Raw 和 Razor 的点差最低 建议止损:50 点 建议止盈水平:20 点、50 点和 100 点 规格: 不重漆! 最
支撑和阻力筛选器是 MetaTrader 的一个级别指标,它在一个指标内提供多种工具。 可用的工具有: 1. 市场结构筛选器。 2. 看涨回调区。 3. 看跌回调区。 4.每日枢轴点 5.每周枢轴点 6. 每月枢轴点 7. 基于谐波形态和成交量的强大支撑和阻力。 8. 银行级区域。 限时优惠:HV 支撑和阻力指示器仅售 50 美元且终生可用。 (原价 125$) 通过访问我们的 MQL5 博客,您可以找到我们所有带有分析示例的高级指标: 单击此处 主要特点 基于谐波和音量算法的强大支撑和阻力区域。 基于谐波和成交量算法的看涨和看跌回调区域。 市场结构筛选器 每日、每周和每月的枢轴点。 文档 所有支持和阻力筛选器文档(说明)和策略详细信息均可在我们 MQL5 博客的这篇文章中找到: 单击此处。 接触 如果您有任何问题或需要帮助,请通过私信联系我。 作者 SAYADI ACHREF,金融科技软件工程师,Finansya 创始人。
ARICoins
Temirlan Kdyrkhan
ARICoin is a powerful trading companion designed to generate high-probability entry signals with dynamic TP/SL/DP levels based on volatility. Built-in performance tracking shows win/loss stats, PP1/PP2 hits, and success rates all updated live. Key Features: Buy/Sell signals with adaptive volatility bands Real-time TP/SL/DP levels based on ATR Built-in MA Filter with optional ATR/StdDev volatility Performance stats panel (Success, Profit/Loss, PP1/PP2) Alerts via popup, sound, push, or email Cust
Advanced Supply Demand MT5
Bernhard Schweigert
4.5 (14)
任何新手或专业交易者的最佳解决方案! 该指标是一款独特、高质量、且价格合理的交易工具,因为我们已经整合了许多专有功能和新公式。 依据此更新,您将能够显示双重时间帧区域。 您不仅可以显示一个较高的时间帧,还可以同时显示图表时间帧,加上更高的时间帧:显示嵌套时区。 供需双方所有交易者都会喜欢它。 :) 重要信息披露 高级供需的最大潜力,请访问 https://www.mql5.com/zh/blogs/post/720245   想象您的交易如何得以改善,是因为您能够精准定位入场或目标位吗? 构建于新的底层算法,它可以更轻松地识别出买卖双方之间的潜在失衡。 这是因为它以图形方式展示供需最强劲区域,及其过去的表现(显示旧区域)。 这些功能旨在帮助您更轻松地发现最佳入场区域和价位。 现在您可以针对您的交易品种和时间帧来优化和编辑区域强度! 高级供需指标适用于所有产品和时间帧。 它是一个新的公式,非常新的功能是两个区域强度函数可由用户输入进行调整! 这在交易中是一大优势。 当您学习如何使用专有功能,例如带有价格游离最小 X 因子的区域强度时,您能够判断该区域强劲与否。 供需区域用作警报触发器。
Easy Buy Sell Signal Alert
Franck Martin
4.69 (13)
Easy Buy Sell is a market indicator for opening and closing positions. It becomes easy to track market entries with alerts. It indicates trend reversal points when a price reaches extreme values ​​and the most favorable time to enter the market. it is as effective as a Fibonacci to find a level but it uses different tools such as an algorithm based on ATR indicators and Stochastic Oscillator. You can modify these two parameters as you wish to adapt the settings to the desired period. It cannot
SuperScalp Pro
Van Minh Nguyen
5 (1)
SuperScalp Pro  — 混合型 Supertrend 剥头皮指标 SuperScalp Pro 将经典的 Supertrend 概念扩展为一种混合型剥头皮工具,适用于多时间框架(M1–H1)的短期到中期交易配置。该指标将直观的 Supertrend 波段与多种可选确认指标相结合,以提供高概率的入场信号,同时使风险管理保持简单:止损和获利水平根据 ATR 动态计算并直接绘制在图表上。支持弹窗、邮件和推送通知,确保不会错过任何信号。 主要的视觉元素为颜色变化的 Supertrend 波段,用以反映趋势方向并突出候选信号柱。当 Supertrend 翻转时,会出现入场标记;在输出有效信号前,指标会评估已启用的确认过滤器,包括 ATR 区间、ADX、RSI、多重 EMA、EMA 斜率、与 EMA 的距离以及成交量。该混合确认流程通过要求多个已选过滤器一致性来显著减少噪声,而不是单纯依赖 Supertrend。 风险参数根据 ATR 动态计算,并以清晰标注的虚线 SL/TP 及价格标签显示在图表上,为手动交易者提供即时的视觉风险管理参考。图表上的这些水平仅作为参考——自动下单和管理仍
ARIScalping
Temirlan Kdyrkhan
ARIScalp is a powerful trading companion designed to generate high-probability entry signals with dynamic TP/SL/DP levels based on volatility. Built-in performance tracking shows win/loss stats, PP1/PP2 hits, and success rates all updated live. Key Features: Buy/Sell signals with adaptive volatility bands Real-time TP/SL/DP levels based on ATR Built-in MA Filter with optional ATR/StdDev volatility Performance stats panel (Success, Profit/Loss, PP1/PP2) Alerts via popup, sound, push, or email Cus
作者的更多信息
This indicator get all events/countries/values from metatrader terminal calendar and print veritical lines at chart, you can configure anything with inputs (string to filter names/url/code/countries/currencies), select period to filter, nws interval before and after current time (every information about time is seconds based), you can filter importance, type, sector, unit, multiplier, impact, timemode, frequency, forecast/previous % increase/decrease interval, actual/previous % increase/decrease
FREE
Export Deals to CSV - Excell File location: HistoryDeals/<SERVER>/<LOGIN>.<DATETIME>.csv Works as an Script, reading all DEALS in history and exporting it as a plain text CSV file There's no option to change. There's no WebRequest. There's no DLL use. I need to write 300 characters to allow this product being exposed at MQL5 market place. It's simple to use, plug it in graph and wait completion.
FREE
BookMap HeatMap
Roberto Spadim
1 (2)
This Indicator creates a heatmap based on depth of market of the current symbol or another symbol. Other symbol is useful when you trade futures market and a contract has 'mini' and 'full' split. For example, in Brazil (B3 - BMF&Bovespa), WDO and DOL are future Forex contract of BRL/USD (where 1 DOL = 5 WDO) and big banks work mostly with DOL (where liquidity is important). Please use with M1 timeframe , objects are too small to be displayed at higher timeframes (MT5 limit). The number of level
This indicator sends a message (notification), an email, and plays a custom sound when a Limit (Buy/Sell) or Limit Stop (Buy/Sell) or Take Profit, Stop Loss, Stop Out is executed. A user can change the sound file name, and select if they receive notifications/emails. It runs as an indicator, and only one indicator is locked (used) by a user account/login. Parameters soundFile - sound file Save your file at the terminal folder, for example: " C:\Program Files\MetaTrader 5\Sounds\Order Executed.
Teclado trader, é uma BIBLIOTECA que você pode chamar no OnChartEvent para abrir posição de compra/venda/zerar, os botões padrões são: V = venda C = compra Z = zerar posições a mercado S = zerar posições opostas e depois a mercado X = zerar posições opostas Além da função de teclado, é possível mostrar os estados do ExpertAdvisor usando o MagicId, com informação de: lucro mensal, semanal, diario, e posição aberta, para isto use o OnTick, ou qualquer outro evento (OnTimer / OnTrade / OnBookEven
From https://en.wikipedia.org/wiki/Fractional_calculus: Fractional calculus  is a branch of  mathematical analysis  that studies the several different possibilities of defining  real number  powers or  complex number  powers of the  differentiation operator   D This indicator execute fracional differentiation on data, you can select the differentiation D value and execute some tweaks like execute Log(value)  before difefrentiation or execute a window normalization on last [diffNormalizeWindow]
This indicator works in Brazil market, it should be used on options symbols. the indicator create 8 buffers, Delta, Gamma, Vega, Rho, Theta, Time(working days), Implied Volatility, R (interest rate), and can be used to view greeks over time. It shouldn't be used to trade, since it's cpu intensive, it's just a historic viewer, you can see what happened with greeks and teach friends :)
This script use DIDI+BB indicators and display alerts, send mail, send notifications, and play sounds. Scanner can monitor market watch using  ***MARKET***  as symbol name, with  all timeframes Inputs: media_lenta=3 media_base=8 media_longa=20 bb_periodo=20 bb_shift=0 bb_deviation=1.96 symbols - Symbol list, separated by ;   when using ***MARKET*** symbols from marketwatch will be included wait_interval_between_signals - Seconds between signals, default =60, but high frequency signals should red
This Service, export the account Orders/History Orders/Deals/Position on each new change. It save at a common folder with path = <DATE>\\<Server Name>.<Login>.<DATE>.<filetype>.csv Each file type have an header You can use it to receive OMS changes and source SQL Servers outside metatrader with bash scripts or others tools, each time the file change you can read it and get new updates, it works using SharedRead option when opening/flock the file.
筛选:
无评论
回复评论