Untested Supply And Demand Zones Detector
- 指标
- 版本: 1.1
- 更新: 18 九月 2018
- 激活: 5
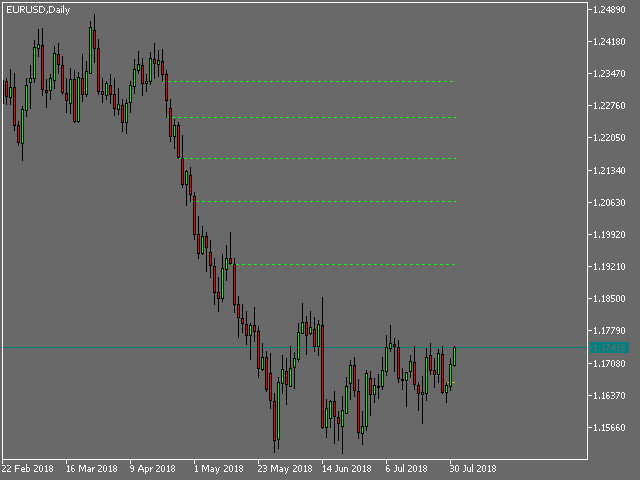
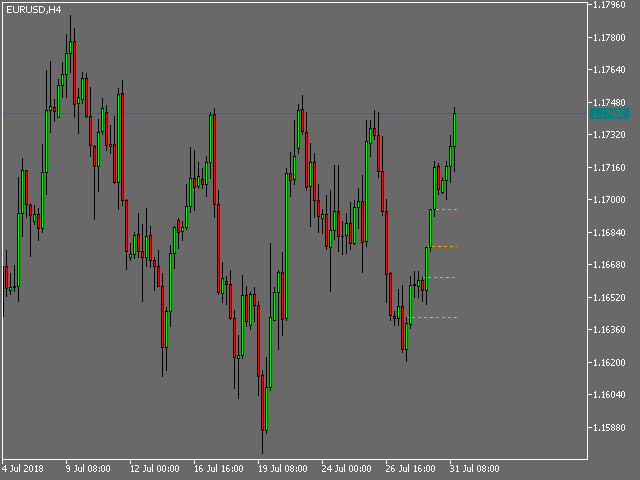
This indicator scanning thorough the history and drawing horizontal rays on all bars untested lows and highs.
Fresh supply/demand zones and support/resistance levels will be marked down.
It allows to be sure that certain levels is fresh and has not been tested yet.
Usually after strong departure price is not retesting base immediately and leaving unfilled orders.
There is no inputs, so indicator is ready to go.