Market Path Forecast
- 指标
-
Shipra Gupta
 我是 Shipra Gupta,一名交易员和量化策略开发者,拥有扎实的数学、经济学以及算法交易系统背景。多年来,我长期专注于外汇、黄金、指数、大宗商品及加密货币市场,致力于构建以数据驱动、强调稳定性、精准度与纪律执行的交易策略。
我的专长包括开发 MetaTrader 5 Expert Advisors(EA)、量化交易模型、剥头皮交易系统、趋势跟随算法、波动率策略以及风险控制自动化框架。我开发的每一个系统都基于市场结构分析、统计研究、历史回测、优化以及真实市场验证。 - 版本: 1.0
Market Path Forecast [BOSWaves]
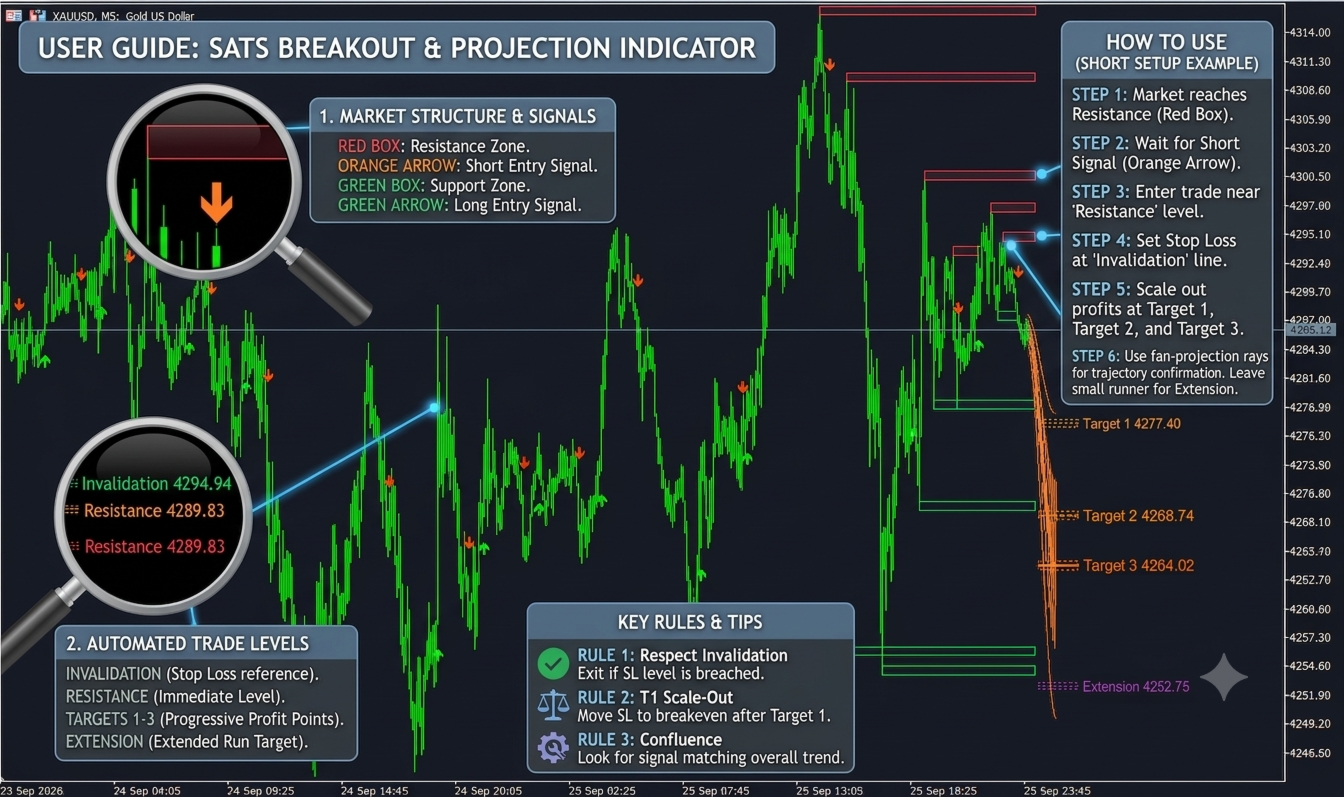
Market Path Forecast [BOSWaves] is an advanced predictive technical analysis indicator that combines market structure detection, statistical swing modeling, and dynamic target projection. It dynamically calculates future price paths and key target levels based on recent historical swing metrics and average true range (ATR) volatility.
Key Features
1. Dynamic Market Path Cone
-
Predictive Projection: Projects a smooth, dynamic trend cone into the future, illustrating the most statistically probable trajectory of price action.
-
Curvature & Trend Bias: Adjusts path bending using EMA-based momentum filters ($9$-period vs $22$-period) to model trend acceleration or exhaustion.
-
Volatility Bands: Uses statistical standard deviations weighted by sample history to plot confidence boundaries around the forecasted path.
2. Smart Target & Risk Levels
Projects dynamic, ATR-padded forecast zones forward into future price space:
-
Target 1 (T1), Target 2 (T2), Target 3 (T3): Multi-tier profit targets calculated from weighted historical swing magnitudes.
-
Extension Level (EX): Stretched target for high-volatility momentum moves.
-
Opposing Support/Resistance: Nearby structural level representing expected pullbacks.
-
Invalidation Level (IV): Dynamic stop level marking where the current forecast structure becomes invalid.
-
Structure Snapping: Automatically aligns raw theoretical target levels to nearby historical support and resistance zones for higher accuracy.
3. Historical Structure & Pivot Tracking
-
Swing High/Low Detection: Identifies market pivots using a customizable swing length (default $16$ bars).
-
Support & Resistance Zones: Visualizes unmitigated historical supply and demand levels with ATR-defined zone heights.
-
Automatic Invalidation: Automatically dims or clears broken key zones once price breaches them.
How It Works
-
Swing & Volatility Analysis: The indicator measures past swing lengths, durations, and percentage moves across a customizable sample size ($20$ samples default), normalized by Wilder's ATR ($200$ bars).
-
Adaptive Forecasting: When a new swing pivot forms, it calculates a weighted mean and standard deviation of historical moves to estimate both how far and how fast the next leg will move.
-
Price Snapping: Raw mathematical projections snap toward recent structural pivots to account for institutional liquidity pools.
Input Settings Guide
| Input Group | Parameter | Default | Description |
| Forecast Detection | InpSwingLen | 16 | Left/right bar length to detect swing highs/lows. |
| InpSamples | 20 | Number of historical swing legs used for statistical weighting. | |
| InpAtrLen | 200 | ATR period for volatility normalization. | |
| Market Path | InpShowPath | true | Toggle the forward-looking forecast cone on/off. |
| InpAdaptive | true | Adapt forecast duration dynamically based on elapsed bars. | |
| InpStretch | 2.0 | Multiplier to stretch or compress visual target time projection. | |
| InpPathBend | 0.45 | Sensitivity of the dynamic path curvature to EMA momentum. | |
| Forecast Levels | InpShowLevels | true | Display Target 1–3, Extension, Support/Resistance, and Invalidation lines. |
| InpSnapStrength | 0.65 | Blending factor for snapping raw targets to past structure ($0.0$ = no snap, $1.0$ = full snap). | |
| Historical Structure | InpShowStructure | true | Plot support and resistance zones around key historical pivots. |
| InpMaxZones | 12 | Maximum active structure zones shown simultaneously. |