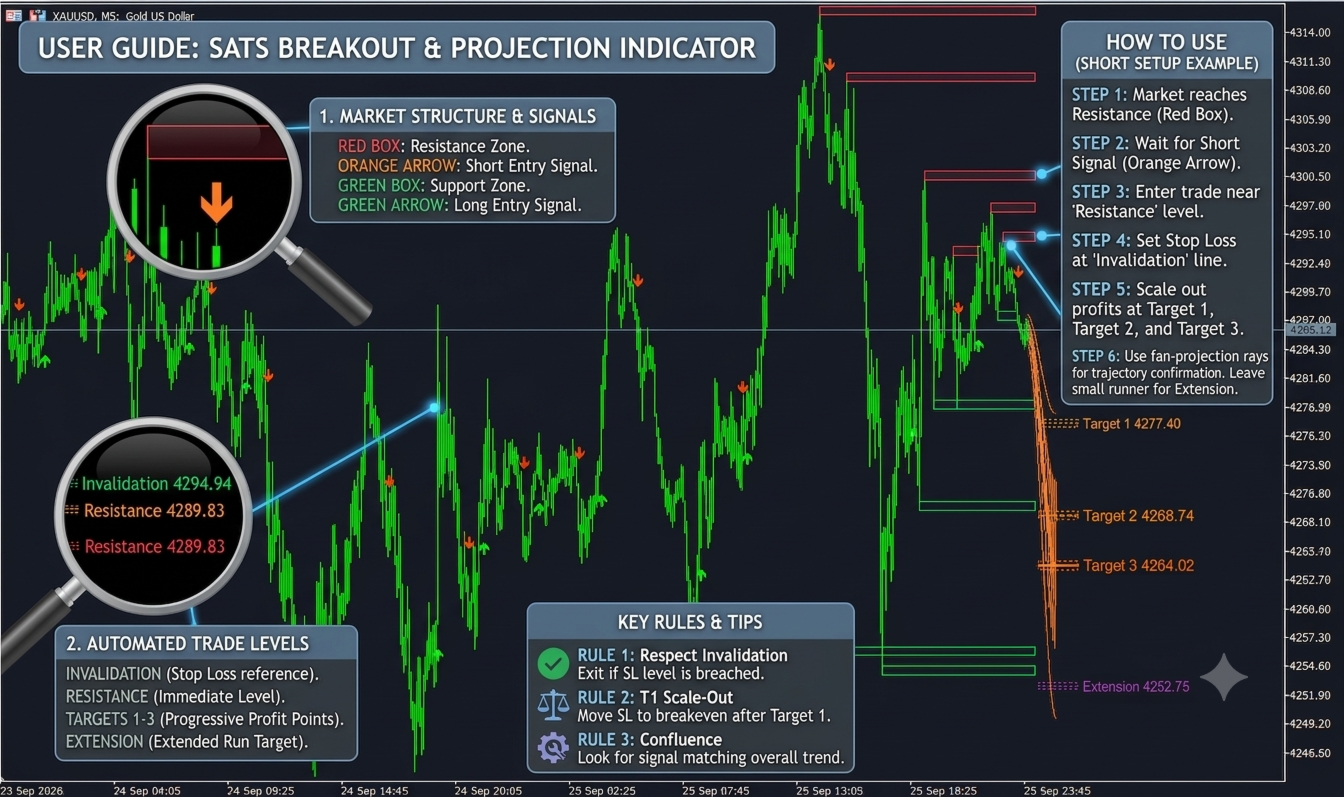
Market Path Forecast
- インディケータ
-
Shipra Gupta
 私はShipra Gupta、数学、経済学、アルゴリズム取引システムに強いバックグラウンドを持つトレーダー兼クオンツ戦略開発者です。これまで、Forex、ゴールド、指数、コモディティ、暗号資産市場に幅広く携わり、一貫性、精度、規律ある執行を重視したデータ駆動型の取引戦略を構築してきました。
 - バージョン: 1.0
Market Path Forecast [BOSWaves]
Market Path Forecast [BOSWaves] is an advanced predictive technical analysis indicator that combines market structure detection, statistical swing modeling, and dynamic target projection. It dynamically calculates future price paths and key target levels based on recent historical swing metrics and average true range (ATR) volatility.
Key Features
1. Dynamic Market Path Cone
-
Predictive Projection: Projects a smooth, dynamic trend cone into the future, illustrating the most statistically probable trajectory of price action.
-
Curvature & Trend Bias: Adjusts path bending using EMA-based momentum filters ($9$-period vs $22$-period) to model trend acceleration or exhaustion.
-
Volatility Bands: Uses statistical standard deviations weighted by sample history to plot confidence boundaries around the forecasted path.
2. Smart Target & Risk Levels
Projects dynamic, ATR-padded forecast zones forward into future price space:
-
Target 1 (T1), Target 2 (T2), Target 3 (T3): Multi-tier profit targets calculated from weighted historical swing magnitudes.
-
Extension Level (EX): Stretched target for high-volatility momentum moves.
-
Opposing Support/Resistance: Nearby structural level representing expected pullbacks.
-
Invalidation Level (IV): Dynamic stop level marking where the current forecast structure becomes invalid.
-
Structure Snapping: Automatically aligns raw theoretical target levels to nearby historical support and resistance zones for higher accuracy.
3. Historical Structure & Pivot Tracking
-
Swing High/Low Detection: Identifies market pivots using a customizable swing length (default $16$ bars).
-
Support & Resistance Zones: Visualizes unmitigated historical supply and demand levels with ATR-defined zone heights.
-
Automatic Invalidation: Automatically dims or clears broken key zones once price breaches them.
How It Works
-
Swing & Volatility Analysis: The indicator measures past swing lengths, durations, and percentage moves across a customizable sample size ($20$ samples default), normalized by Wilder's ATR ($200$ bars).
-
Adaptive Forecasting: When a new swing pivot forms, it calculates a weighted mean and standard deviation of historical moves to estimate both how far and how fast the next leg will move.
-
Price Snapping: Raw mathematical projections snap toward recent structural pivots to account for institutional liquidity pools.
Input Settings Guide
| Input Group | Parameter | Default | Description |
| Forecast Detection | InpSwingLen | 16 | Left/right bar length to detect swing highs/lows. |
| InpSamples | 20 | Number of historical swing legs used for statistical weighting. | |
| InpAtrLen | 200 | ATR period for volatility normalization. | |
| Market Path | InpShowPath | true | Toggle the forward-looking forecast cone on/off. |
| InpAdaptive | true | Adapt forecast duration dynamically based on elapsed bars. | |
| InpStretch | 2.0 | Multiplier to stretch or compress visual target time projection. | |
| InpPathBend | 0.45 | Sensitivity of the dynamic path curvature to EMA momentum. | |
| Forecast Levels | InpShowLevels | true | Display Target 1–3, Extension, Support/Resistance, and Invalidation lines. |
| InpSnapStrength | 0.65 | Blending factor for snapping raw targets to past structure ($0.0$ = no snap, $1.0$ = full snap). | |
| Historical Structure | InpShowStructure | true | Plot support and resistance zones around key historical pivots. |
| InpMaxZones | 12 | Maximum active structure zones shown simultaneously. |