Non Repaint Buy Sell Signals QCL MT5 Indicator
- 指标
-
Shujah Amin
 My journey into algorithmic trading was born from the same frustration many traders face: the battle against emotions and the risks of human error. Determined to master the markets, I transitioned from manual trading to deep-level MQL5 development, focusing on the volatility of Gold (XAUUSD).
 - 版本: 2.40
- 更新: 1 八月 2026
- 激活: 10
Quantitative Methodology:
| Special launch discount price. Final price $149 Indicator User Manual Asset: XAUUSD Timeframe: 15 Minutes, We doing manual trading upon the signals sent by our Indicator |
The core engine is built on a model that analyzes multi-layered price action across three pillars:
-
Adaptive Momentum Smoothing: The algorithm employs a mathematical framework to isolate underlying market bias and eliminate intraday noise. This ensures only high-conviction momentum shifts are qualified as valid signal candidates.
-
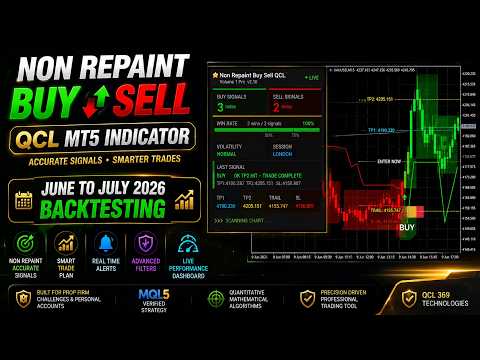
Dynamic Volatility Modeling: Real-time market variance is calculated on every bar to construct self-adjusting boundary channels rendered as green bullish and red bearish volatility zones. These zones dynamically trail price to keep your risk framework relevant as market conditions evolve.
-
Strict Non-Repaint Architecture: Signals are triggered via a mathematical threshold. A signal is only confirmed when the closing price decisively breaches the dynamic volatility matrix in the direction of the prevailing momentum. Once a candle closes and a signal is printed, it is locked. It will never repaint, shift, or vanish.
Visual Chart Elements
Green Zones and Candles: A BUY signal triggers a green volatility zone drawn on the chart. Candles remain colored green for as long as price sustains the bullish momentum phase.
Red Zones and Candles: A SELL signal triggers a red volatility zone. Candles remain colored red for the duration of the bearish momentum phase.
Staircase Trend Boxes: Stepped zone boundaries track the evolving trend structure, making trend continuation and exhaustion straightforward to read.
Signal Projection Levels: Every arrow signal plots four labeled horizontal levels on the chart:
-
Entry: The precise price at which to enter the trade.
-
Stop Loss: Positioned just beyond the opposite volatility zone boundary.
-
TP1: First take-profit target for partial position closure.
-
TP2: Extended target for maximum trend capture.
Advanced GUI Dashboard
The upgraded on-chart dashboard provides a real-time control panel including:
-
Buy and Sell Signal Count: Total signals generated in the current session.
-
Current Volatility Reading: Live market variance level.
-
Active Zone Status: Whether the market is currently in a Bullish or Bearish phase.
-
Signal Scan Animation: Live scanning pulse confirming the indicator is active.
All data updates tick-by-tick, providing a live pulse of market conditions directly on the chart.
Support and Communications
For product support, questions, or technical configuration assistance, please use the Comments tab on this page or send a direct message directly to our profile through the built-in messaging system. All user documentation and setup support are handled strictly inside the official infrastructure.