PixelBastion TD

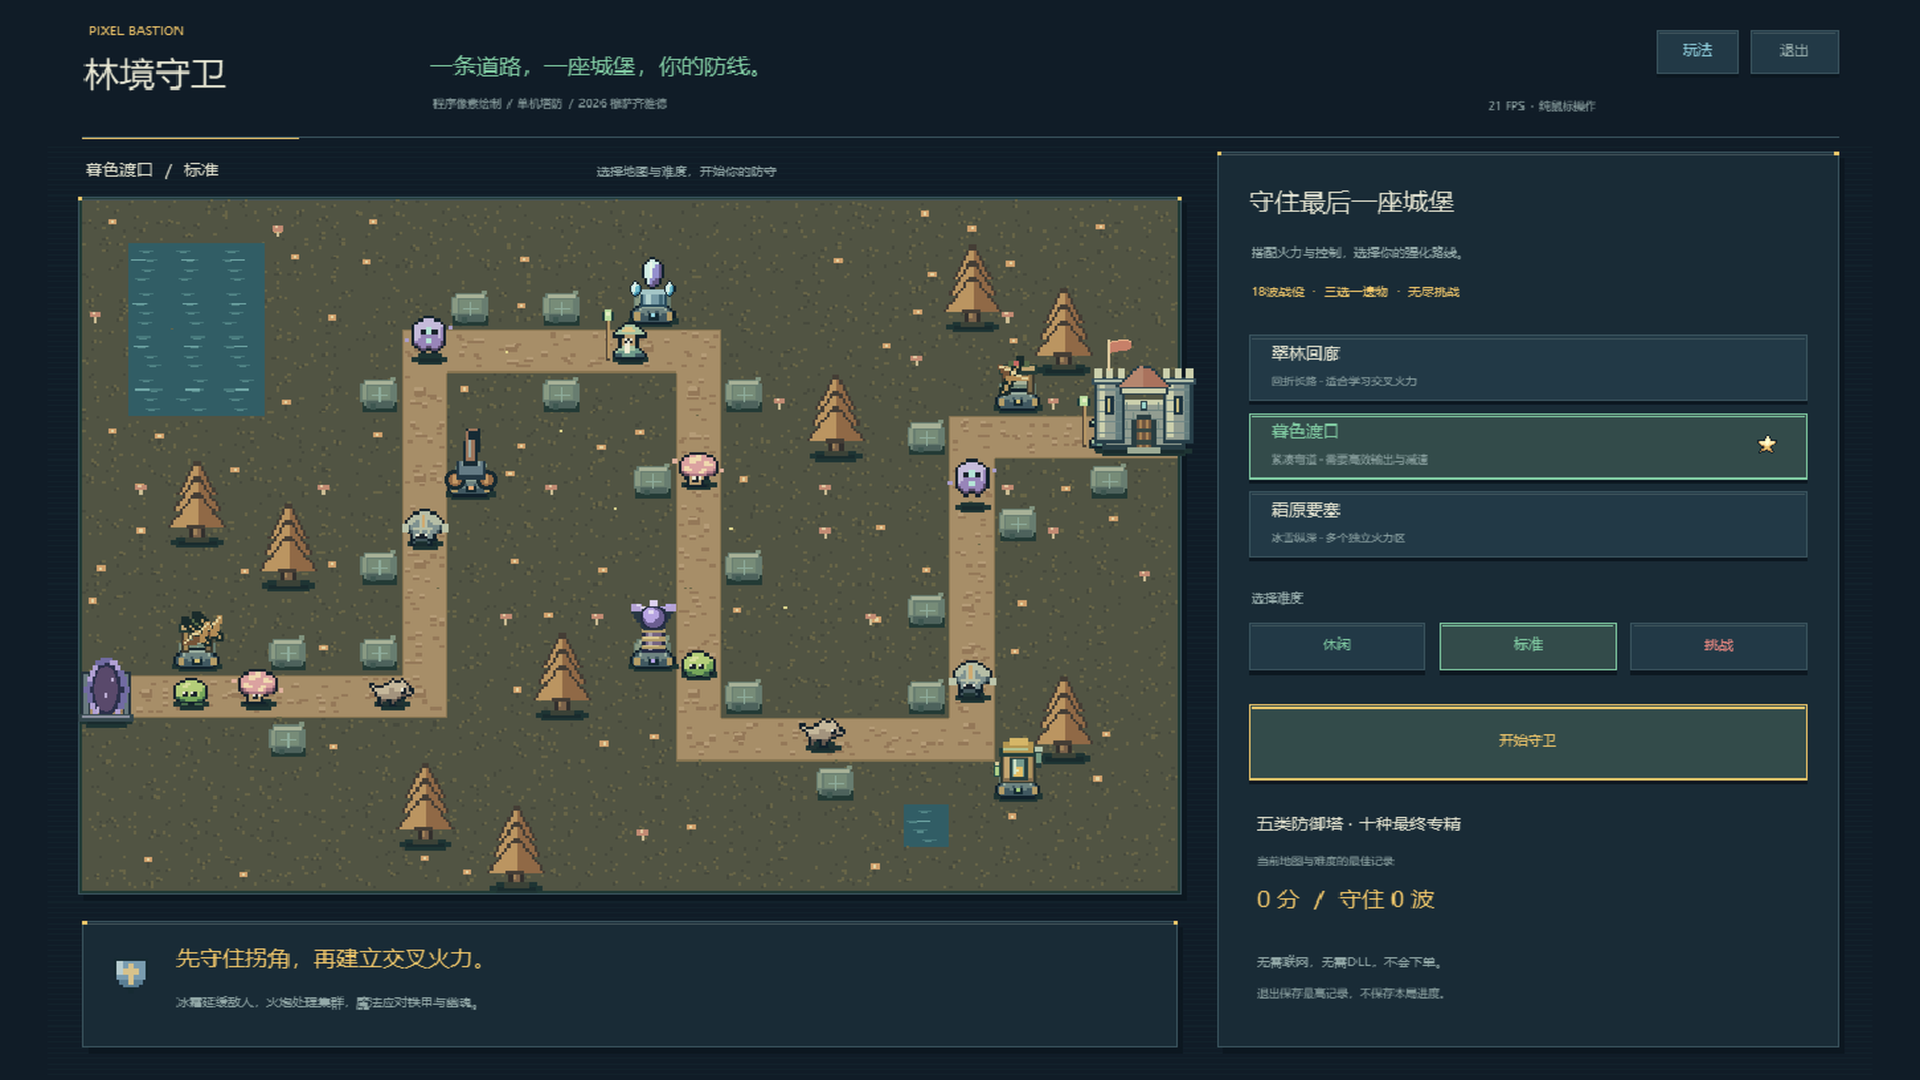
# 林境守卫 (Pixel Bastion TD) · MT5 原生经典像素策略塔防

> **沉浸式策略塔防空降 MetaTrader 5!在盯盘之余指挥防御塔构筑火力网,体验原汁原味的复古像素防守策略与经济运营乐趣。**

---

### 🌟 游戏概述

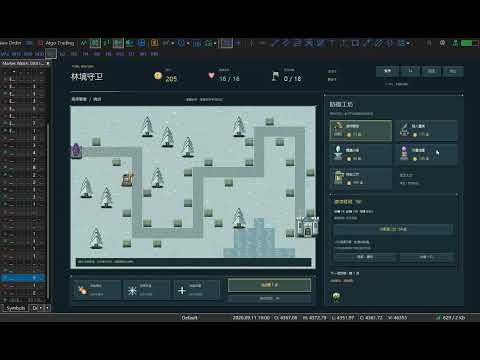
《林境守卫》(Pixel Bastion TD)是一款在 MetaTrader 5 图表内直接运行的原生独立 2D 像素策略塔防游戏。魔物狂潮正穿过精灵古林侵袭城堡,您将作为防线指挥官,在精心设计的战略要道上布置不同特性的防御塔,研究元素克制、升级科技分支、分配金币利息,并实时释放毁灭性主动技能!

**纯鼠标操作、0 DLL 依赖、0 外部资源、0 交易风险!** 游戏完全基于 MQL5 原生 `<Canvas\Canvas.mqh>` 双缓冲光栅化图形引擎,不读取任何行情数据、不查询账户、不发送任何订单,是交易员日常盯盘休憩与锻炼战略思维的绝佳利器。

---

### 🔥 核心特色

1. **纯原生图表光栅化与复古像素美学**
   - 逻辑分辨率 **1280 × 800**,支持最近邻等比智能缩放,完美呈现清晰锐利的复古手绘像素风。
   - 地表地形、林木水系、石质建造台、防御建筑、怪物与动画全部在底层代码中程序化绘制,无需下载任何外部贴图文件或专用字体。

2. **三张精妙地图与三大挑战难度**
   - **翠林回廊 (Verdant Corridor)**:1856 像素回折路线,多段相邻车道,最适合布局大范围交叉火力网。
   - **暮色渡口 (Twilight Crossing)**:1504 像素紧凑路线,深秋地形,行进距离更短,极为考验前中期瞬间爆发。
   - **霜原要塞 (Frost Fortress)**:1632 像素纵深阵地,雪地寒林与独立火力死角,战术走位要求极高。
   - **三档难度体系**:休闲(390金/25血/怪血78%)、标准(320金/20血)、挑战(280金/16血/怪血125%),最高战绩按地图与难度独立存档。

3. **五大基础防御塔与十大终极专精(双路线互斥)**
   每种防御塔升至三阶时,均可选择一种专属觉醒专精:
   - 🏹 **游侠弩塔 (75金)**:超高攻速物理连射,专克轻甲。
     - *疾风连弩*:攻击间隔直接减半,以暴风骤雨般的箭矢压制单体。
     - *鹰眼重弩*:大幅强化射程与单发破甲伤害,化身高空狙击巨炮。
   - 💣 **矮人重炮 (115金)**:范围溅射爆破,需配合减速(无法攻击浮空幽魂)。
     - *集束火炮*:大幅扩充爆炸杀伤半径,群体清怪利器。
     - *熔火榴炮*:炮火轰击后在地面留下持续燃烧的烈焰火海。
   - ❄️ **霜晶尖塔 (90金)**:魔法伤害与强力减速控场。
     - *永冻之心*:将减速提升至恐怖的 58%,持续时间延长至 3.2 秒。
     - *碎冰棱镜*:对已减速或冻结的目标造成巨额增伤,攻防兼备。
   - ⚡ **风暴线圈 (135金)**:在敌群间高频跳跃的连锁闪电。
     - *连锁风暴*:跳跃上限增至 6 个目标,并大幅降低伤害衰减。
     - *雷霆聚焦*:取消连锁,聚能为毁灭性的超高频单体雷霆轰顶。
   - 🧪 **炼金工坊 (100金)**:魔法直伤 + 持续剧毒 + 护甲深度腐蚀。
     - *瘟疫药剂*:毒素与腐蚀扩散至全域,大幅削减高甲敌人抗性。
     - *点金配方*:被命中的敌人阵亡时额外掠夺 3 枚金币,经济滚雪球神器。

4. **四大智能索敌策略与灵活经济机制**
   - 每一座防御塔均可单独定制索敌逻辑:**首要进度 (First)**、**最高生命 (Strongest)**、**最少生命 (Weakest)**、**最近距离 (Closest)**。
   - 随时出售防御塔,全额返还 **70% 累计建造及升级金币**,战术变阵随心所欲。

5. **克制机制鲜明的七大魔物军团**
   - **苔藓史莱姆**(基础步兵)、**疾行狼**(超高速冲刺)、**铁甲兽**(重装高甲,漏怪扣 2 血)、**浮空幽魂**(飞行单位,免疫炮击,弩箭仅造成 35% 伤害,惧怕魔法)、**治疗萨满**(为全队群体回血,受控打断)、**分裂孢兽**(阵亡分裂成两个幼体)、**远古树魔**(第 6/12/18 波及无尽模式首领,自带控制抗性,漏怪扣 6 血)。
   - 界面右下方实时显示**下一波怪物雷达预报**,提前布局克制阵容。

6. **三大应急主动技能 (Active Skills)**
   - ☄️ **陨星轰击**:指定路段召唤天降陨石,造成 `110 + 当前波次 × 18` 的巨额范围魔法轰炸(CD 36秒)。
   - 🧊 **极寒新星**:瞬间冻结全场普通魔物 3.2 秒(首领 1.3 秒),关键时刻绝地求生(CD 46秒)。
   - 🏰 **城堡修复**:紧急修复城堡 4 点生命值(满血不浪费冷却,CD 60秒)。
   *(战斗中每成功守住一波,所有技能额外减免 8 秒 CD!)*

7. **利息理财与肉鸽遗物系统 (Relics & Economy)**
   - **理财利息**:每波结算前持有金币享 5% 现金利息(上限 30 金),体验“以钱生钱”的运营快感。
   - **完美通关奖 & 抢跑奖**:零漏怪额外奖励 15 金;提前迎战奖励最高 20 金。
   - **三选一随机遗物**:每过 3 波解锁一次遗物奖励,涵盖全军伤害、攻速、射程、技能冷却、金币收入等多维被动强化。
   - **无尽挑战模式 (Endless Mode)**:通关 18 波后可领取 120 金与额外遗物,步入怪物不断变强的无尽试炼!

---

### 🎮 纯鼠标操作指南

- **建造防御塔**:
  - 点击地图上的空闲石质地台,在右侧面板选择防御塔卡片支付金币建造;或先点右侧塔卡,再点地台摆放。
- **升级与专精**:
  - 点击已建成的防御塔,右侧面板即时显示其射程圈、攻击间隔、直伤与附加效果。
  - 升至二阶增强属性;升至三阶时二选一专精(互斥)。
- **索敌模式切换**:点击选中塔面板中的索敌按钮即可轮流切换。
- **释放主动技能**:点击右侧技能图标,若为“陨星轰击”,再点击发光的道路格子即可施放;再次点击技能取消施法。
- **倍速与战斗控制**:
  - 支持 **1x / 2x / 3x 三档倍速自由切换**。
  - 随时点击“迎战第 N 波”出怪;支持开启“自动接波”模式。
  - 随时点击右上角 `[暂停]`、`[帮助]` 或 `[退出]`。

---

### ⚙️ 详细参数配置 (Input Parameters)

| 参数名称 | 默认值 | 取值范围 | 参数功能详解 |
| :--- | :---: | :---: | :--- |
| `InpMap` | 1 | 1 ~ 3 | **初始地图选择**。1 为翠林回廊,2 为暮色渡口,3 为霜原要塞(游戏菜单内可随意重选)。 |
| `InpDifficulty` | 2 | 1 ~ 3 | **初始难度**。1 休闲、2 标准、3 挑战(菜单内可随时切换)。 |
| `InpFramesPerSecond` | 30 | 15 ~ 60 | **画面渲染帧率上限**。与物理模拟速度解耦,配置较低电脑设为 25~30 即可丝滑运行。 |
| `InpMaxScale` | 1.5 | 0.75 ~ 2.0 | **最大画面适配倍率**。自动根据图表窗口按比例居中自适应缩放。 |

---

### 🛡️ 安全与环境声明 (100% Safe)

- **无 DLL 调用**:不加载任何外部动态链接库,不需要勾选“允许 DLL 导入”。
- **无行情与账户交互**:独立脚本循环运行,休市断网亦可畅玩,绝不读取账户与订单,绝无下单动作。
- **图表自动恢复**:脚本移除或点击退出时,图表背景色、K线显示、滚动条与鼠标键盘设置自动 100% 还原,不残留任何多余对象。
- **推荐显示空间**:建议图表可用区域在 **1100 × 690** 以上(1280 × 800 最佳);窗口低于 900 × 560 时会自动安全暂停。

推荐产品
Custom Alerts:监控多个市场,绝不错过关键交易信号 概述 Custom Alerts 是一款动态工具,专为希望集中监控多个交易品种潜在机会的交易者设计。通过整合我们旗舰工具(如 FX Power、FX Volume、FX Dynamic、FX Levels 和 IX Power)提供的数据, Custom Alerts 可自动通知您关键的市场变化,无需频繁切换图表,也不会错过交易良机。现在,它支持您的经纪商提供的所有资产类别,只需在设置中选择相应的资产类别即可,无需手动输入任何品种名称。 1. 为什么 Custom Alerts 对交易者非常有帮助 一体化市场监控 • Custom Alerts 收集并整合来自外汇、贵金属、加密货币、指数,甚至(若经纪商支持)股票市场的信号。 • 无需频繁切换图表,一切通知集中呈现。 根据策略定制提醒 • 精准设置提醒条件。无论是追踪成交量激增、强度突破,还是极端价格波动, Custom Alerts 都能确保您不会错过任何关键信号。 • 可与 Stein Investments 工具无缝集成,助您更深入分析与优化交易决策。 节省时

Analyze Less. Understand More. Trade with Greater Confidence. BMAE (Best Market Analyser Edge) is a semi-automated trading assistant designed to help beginner, intermediate, and experienced traders analyze the markets more efficiently, identify high-probability trading opportunities, and gradually build their trading independence. Less hesitation. More structure. More confidence in every trading decision. Trading Shouldn't Be This Complicated... At first, everything seems simple. You open a char
Online Accounts Manager MT5
Kyra Nickaline Watson-gordon
5 (1)
OneClick Online Account Manager is a powerful utility that helps you to manage all your accounts from a centralized panel. It is suitable for all single account traders and specially for multiple accounts traders. The utility help you to : Monitor status of all accounts on a private web page. Some information such as account connection status, account profit, DD, Balance, Equity, Margin Level, Number of positions and orders, Daily and Weekly profit/loss and also overall summation of all these p
Market Ticker Pro MT5
John Louis Fernando Diamante
The only Market Ticker on the market! Add a professional novelty to your workspace, with built in mini-charts A scrolling Market Ticker that displays price changes from all symbols in the Market Watch list. Provides an easy snapshot of symbol prices, and keeps scrolling automatically while you trade and analyse the chart. The ticker color (+/- price changes) are based on either the current or completed candle, and the previous candle. Options include: - MTF, eg choose to show price changes of t
XFlow
Maxim Kuznetsov
XFlow shows an expanding price channel that helps determine the trend and the moments of its reversal. It is also used when accompanying transactions to set take profit/stop loss and averages. It has practically no parameters and is very easy to use - just specify an important moment in the history for you and the indicator will calculate the price channel. DISPLAYED LINES ROTATE - a thick solid line. The center of the general price rotation. The price makes wide cyclical movements around the
Rocket Trend
Andriy Sydoruk
The Rocket Trend indicator is trending. The indicator draws two-color points connected by lines along the chart. This is a trend indicator, it is an algorithmic indicator. It is easy to work and understand when a blue circle appears, you need to buy, when a red one appears, sell. The indicator is used for scalping and pipsing, and has proven itself well. Rocket Trend is available for analyzing the direction of the trend for a specific period of time. Ideal for novice traders learning the laws o
BossFXTradePanelEA (MT5)  [First 10 copies sold at 50 USD price will increase to 99USD] BossFXTradePanelEA is a fully interactive trade management panel designed for MetaTrader 5, providing traders with an easy-to-use, one-click interface to execute and manage trades. This EA simplifies trade execution , risk management, and position control by combining market orders, stop loss, take profit, trailing stops, and breakeven functionalities into a single, intuitive panel.  Key features include: On
Xtrade Trend Detector
Dago Elkana Samuel Dadie
Xtrade Trend Detector is an indicator capable of finding the best opportunities to take a position in any stock market. Indeed, it is a great tool for scalpers but also for Daytraders. You could therefore use it to identify areas to trade, it fits easily on a chart. I use it to detect trends on Big timeframes and take positions on Small timeframes. Don't hesitate to give me a feedback if you test it.
Stop checking charts one by one to discover which markets deserve your attention. Multi Market Scanner monitors multiple symbols and timeframes from a single panel, compares their technical conditions, and organizes the results by signal, score, alignment, and freshness. This helps you focus your analysis on the most relevant instruments without wasting time reviewing markets with no clear conditions. It is a market analysis and decision-support tool. It does not open, modify, or close trades: t
Candlestick Timer is a gadget by MT4Gadgets.com that quickly shows you the countdown to candle close / next candle. This information is useful in some strategies or when you need to be ready to react to news, volatility, market open/close and similar situations. The panels can be adjusted in position, size, color. You can also set a threshold to be alerted when the candle close/open, approach. Features: Visual interface Size, position and colors adjustable Optional alert available Ease of use
FREE
DYNAMIC TARGET AND SL MATRIX REAL-TIME FOREX DISTANCE ENGINE Stop guessing your SL and TP distance. Start measuring it. Dynamic Target and SL Matrix is a professional Forex analytical tool designed to calculate and display a dynamic distance framework for SL and TP planning directly from live market conditions. The engine continuously analyzes the current BID and converts the market state into a dynamic pip-distance reference, which is then expanded through a configurable multiplier matr
Prop Firm Shield Full
Pablo Adolfo Cantos
Prop Firm Shield is a risk management panel for MetaTrader 5, built for prop firm traders who need control over their daily limits. You configure each limit and the tool watches the account around the clock, acting automatically when a limit is reached: closing positions, deleting pending orders and blocking new trading until the next day. Features: - Daily Take Profit - three modes: fixed USD, percent of the day-start balance, or target balance - Daily Stop Loss - three modes: fixed USD, percen
Candle Close Timer Matrix
Sivakumar Paul Suyambu
Candle Close Timer Matrix – MT5 Candle Countdown Indicator Candle Close Timer Matrix is a lightweight and powerful MetaTrader 5 (MT5) candle countdown indicator that shows exactly how many minutes and seconds are left before the current candle closes on any symbol and any timeframe. Download MT5 EA Products Whether you are a scalper , intraday trader or swing trader , knowing the exact candle close time helps you: Time your entries on candle close Avoid impulsive mid-candle decisions Sync your t
FREE
Reals Trends
Vitalii Zakharuk
The Real Trend indicator simplifies the decision-making process by recognizing reversals with a built-in algorithm and then confirming signals at support/resistance levels. Implements a type of technical analysis based on the idea that the market is cyclical. Thus, the indicator follows the market trend with great reliability, ignoring sharp market fluctuations and noise around the average price. The indicator can be used both for pipsing on short periods and for long-term trading.
Time Dashboard
Pankaj Kushwaha
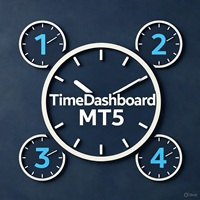
Time Dashboard MT5 is a powerful and user-friendly MetaTrader 5 indicator designed to provide real-time time zone and clock information directly on your trading chart. Ideal for forex traders and global market participants, this tool displays server time, local time, and the time difference between them, enhancing your ability to manage trades across different time zones. Key Features : Real-Time Time Display : Shows current server time, local time, and their respective time zones with precise o
FREE
Speculator MT5
Ivan Stefanov
SPEKULATOR 是一个手动交易系统和指标,帮助您识别关键支撑区域和市场方向。 用简单的策略和隐藏的智慧掌握市场。 您可以在图表上选择任意一个顶部(TOP)和底部(BOTTOM),指标将自动绘制: 您趋势方向的支撑区。 如果是多头趋势,将显示绿色区域;如果是空头趋势,将显示红色区域。该支撑区的灵敏度可以在设置中调整。该区域基于您选择的趋势,表示支撑最可能出现的位置。 高偏差线和低偏差线 根据甘氏九宫格(W.D. Gann’s Square of 9)计算的角度线 入场规则如下: 如果价格向上突破高偏差线,可以做多 如果价格向下突破低偏差线,可以做空 如果价格在偏差线之间震荡,可以在区间内高抛低吸,同时遵守支撑区的方向 甘氏角度线可用作止盈参考 关键水平是360度线: 如果价格高于该线,市场可能会上涨 如果价格低于该线,市场可能会继续下跌 加载指标后,它会出现在图表上的第20根到第50根K线之间。 点击该线即可激活,激活后可以将其移动到任意顶部或底部。 SPEKULATOR 是少数几个将清晰逻辑与优雅视觉效果结合在一起的指标之一。 您可以选择启用区域之间的颜色渐变,使图表显示更为平
Fifty Shades of a Doji - Analytical Level Journal & Tracker The "Fifty Shades of a Doji" is a professional, non-trading analytical utility designed for traders who base their strategies on Daily, Weekly, and Monthly static support and resistance levels, combined with price action compression patterns. This tool does not execute automatic market orders. Instead, it functions as a high-level visual analyzer, virtual trade simulator, and statistical logger. It identifies high-probability setups,
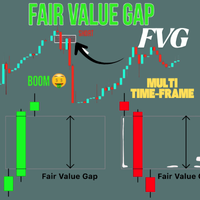
Crystal FVG Touch Detector – 智能资金概念高级指标 Crystal FVG Touch Detector 是为使用 Smart Money Concepts (SMC) 与 ICT 方法的专业交易者设计的高性能指标。 它能自动检测任何周期或品种的 Fair Value Gaps (FVG),并通过颜色区域与触碰检测清晰显示在图表上。 采用无重绘算法和高效结构,实时识别机构失衡区间。 主要特点 精准检测多空 FVG 区域。 实时跟踪价格触碰并自动更新。 多时间框架兼容并显示提醒。 自动配色适配深浅主题。 高效、稳定、无延迟。 参数全面可调。 关键词: FVG, 公允价值缺口, Smart Money Concepts, SMC, ICT, 订单块, 不平衡, 流动性, 机构交易, 供需, 不重绘, 成交量价差分析, 市场结构, 结构突破, CHoCH, BOS, 流动性清扫, 外汇指标, 黄金交易, MT5 指标, 剥头皮, 波段交易.
FREE
本指标是实践实战交易完善的波浪自动分析的指标 !  案例... 注: 波浪分级用西方叫法不习惯,因受到缠论(缠中说禅)命名方式习惯的影响,我是将基础波浪命名为 笔 ,将二级波段命名为 段 ,同时具有趋势方向的段命名为 主趋段 (以后笔记中都是这种命名方式,先告知大家),但是算法上和缠论关系不大切勿混淆.反映的是本人分析盘面总结的 千变万化纷繁复杂的运行规律 . 对波段进行了标准化定义,不再是不同人不同的浪  ,    对人为干扰的画法进行了排除,在严格分析进场起到了关键的作用 . 使用这个指标,等于将交易界面提升美感,抛弃最原始的K线交易带你进入新的交易层次.如果不是为了交易,在宣传上也将使客户观感提升层次. 指标内容: 1.   基础波浪 (笔) : 首先我们找出了价格波动过程中的基础波动拐点,当然他的有序性低,为下一步的计算提供基础. 2.   二级波段( 段 ) :在基础波浪的基础上,通过算法分析得到层级更明显的二级波段,二级波段为波浪提供了分析基础 3.   波浪( 浪 ): 有着更清晰的趋势,更清晰直观的方向.分析一个波浪是否延续,需要看二级波段的形态,分析二级的构成
Advisor for hedging trading or pair trading. A convenient panel allows you to open positions on the necessary trading instruments and lots. Automatically determines the type of trading account - netting or hedging. Advisor can close all its positions upon reaching profit or loss (determined in the settings). A negative value is required to control losses (for example, -100, -500, etc.). If the corresponding fields are 0, the EA will not use this function.   Settings: Close profit (if 0 here
Levels StopTP
Anton Polkovnikov
水平(極值、止損、獲利) 用於更改止損訂單的放置水平(由用戶手動完成,指標僅可視化水平)。它也可用於在與運動相反的水平上獲取部分利潤。 該指標將允許您採取大部分強勁的運動。您不必擔心過早退出該職位。如果您陷入強勢走勢,只需觀察支撐位並在價格突破該水平時止損退出。 該指標並非旨在搜索入場位置 設置: 極值區域 - 最初搜索極值的區域。 在這種情況下,之前有 2 根蠟燭,之後有 2 根蠟燭。 类型级别-负责级别的值-蜡烛的极端或收盘价 Any Break - 啟用此參數可在第一級更改時提供更高的靈敏度。 重新開始新的一天 - 用於具有潛在大範圍第一根蠟燭的工具的日內圖表。 否則,第一根帶有尾巴的蠟燭可能會立即決定全天的水平。 Bar's Quantity - 顯示指標的左側蠟燭數 .... 演示版在"讨论"。 出于某种原因,MQL默认制作的演示不起作用。
cara trading forex agar bisa profit secara konsisten Di video kali ini, kita akan membahas sebuah topik yang jadi impian setiap trader: bagaimana cara trading forex agar bisa profit secara konsisten  kirim screnshot berbagi, beserta nama akun trading anda ke : gunawangroup1982@gmail.com  Tag NB : Video ini hanyalah informasi dan tontonan, apapaun hasil pada setiap individu bisa berbeda beda. Video ini bersifat gratis, dan semua keuntungan dan kerugian adalah tangging jawab masing-masing, jad
General Description In the simplest terms this is a contrarian intra-day scalping system. Built to try and let correct trades run as far as possible and flip the trade when indicated. The indicator looks at historical daily trading ranges to lay out levels at which it takes long and short positions based on the statistical levels. The indicator is built around index futures, mainly around S&P and the DOW but can be used an any futures contract mainly using AMP Futures to trade. The indicator is
Multiple Positions
Emanuel Reynard Phillips
需要同时开立多个头寸/交易吗?我们已经为您创建了简单的解决方案。您现在可以一次输入多个仓位。您可以设置手数、持仓数量、止盈和止损。 例如:您想要购买 3、5、10 或任意数量的具有一定手数的头寸。 您现在只需点击“购买”按钮即可完成此操作。 或者 例如:您想要出售 3、5、10 或任意数量的具有一定手数的头寸。 您只需单击“出售”按钮即可完成此操作。 Xūyào tóngshí kāi lì duō gè tóucùn/jiāoyì ma? Wǒmen yǐjīng wèi nín chuàngjiànle jiǎndān de jiějué fāng'àn. Nín xiànzài kěyǐ yīcì shūrù duō gè cāngwèi. Nín kěyǐ shèzhì shǒushù, chícāng shùliàng, zhǐ yíng hé zhǐ sǔn. Lìrú: Nín xiǎng yào gòumǎi 3,5,10 huò rènyì shùliàng de jùyǒu yīdìng shǒu shǔ de tóucùn. Nín xiànzài zhǐ xū
The Bull DCA DowJones Signal – Premium Trend & Swing Indicator (WinWiFi Robot Series) Overview: Unlock the full potential of Index trading with the latest innovation from the WinWiFi Robot Series . "The Bull DCA DowJones Signal" is a precision-engineered indicator designed to conquer global Indices, Energy, and Forex markets. Optimized for the H4 Timeframe , this tool filters out market noise and delivers clear, actionable signals for Trend Following, Breakouts, and Pullbacks. Key Features & S
FREE
Welcome to ENTRY IN THE ZONE AND SMC MULTI TIMEFRAME Entry In The Zone and SMC Multi Timeframe is a real-time market analysis tool based on Smart Money Concepts (SMC), designed to analyze market structure, price direction, and key trading zones. It supports both Single-Timeframe Analysis and Multi-Timeframe Analysis, providing a clearer view of the overall market structure across multiple timeframes, with real-time BUY / SELL signals that do not repaint. It is designed to help filter trading opp
DoIt EA Monitor - Multi EA Performance Dashboard for MT5 Your account can be profitable while one EA quietly drags down the portfolio. MetaTrader history shows the combined result, but it does not clearly show which strategy deserves more capital and which one needs attention. DoIt EA Monitor runs on one chart and separates live and historical performance by magic number, EA and symbol. It is completely read-only. It never opens, closes or modifies a trade. KNOW WHICH EA IS EARNING ITS PLACE Aut
FREE
Orderflow Super Candles - 简约足迹图指标 平台: MetaTrader 5 (MT5)  (最后一张截图是结合DOM工具配套使用的情况) 1. 产品简介 Orderflow Super Candles 是一款基于底层 Tick 数据分析的专业图表工具,旨在为交易者提供“市场X光”般的深度视角。 通过解析每一根 K 线内部的买卖成交量分布,该指标将隐蔽的市场微观结构可视化。它能帮助交易者透过价格表象,看清机构资金的真实博弈位置,精准识别支撑与阻力位的有效性,从而做出更具逻辑性的交易决策。 2. 核心功能 双重透视模式 买卖量分布 (Buy/Sell Volume): 经典足迹图模式。左侧显示主动卖单,右侧显示主动买单。直观对比每一价格档位的多空力量差异。 净买卖差模式 (Delta Profile): 显示每一价格档位的“买单减去卖单”的净值。绿色代表买方主导,红色代表卖方主导。 自适应缩放技术: 在 Delta 模式下,指标会自动计算当前视野范围内的 Delta 最大绝对值进行动态归一化,确保无论市场波动大小,色块显示都清晰可见。 关键价位自动标注 POC
The indicator helps to enter a trade following the trend, at the same time, after some correction. It finds strong trending movements of a currency pair on a given number of bars, and also finds correction levels to this trend. If the trend is strong enough, and the correction becomes equal to the one specified in the parameters, then the indicator signals this. You can set different correction values, 38, 50 and 62 (Fibonacci levels) are better. In addition, you can set the minimum trend lengt
Calmer chart context, kept practical Northstar Flow Candles MT5 is a chart-window indicator that presents Heikin Ashi candles with a five-state trend context. It is designed for traders who want a quieter view of price while keeping the native chart available as an optional reference. Visual-only indicator: Northstar Flow Candles MT5 does not place trades and does not send popup, push, or email notifications. What appears on the chart Five candle states: strong bullish, bullish, balanced, bearis
FREE
该产品的买家也购买
Trade Assistant MT5
Evgeniy Kravchenko
4.43 (216)
它有助于计算每笔交易的风险,容易安装新的订单,具有部分关闭功能的订单管理, 7 种类型的追踪止损和其他有用的功能。   附加材料和说明 安装说明   -   应用程序说明   -   模拟账户应用程序的试用版 线条功能  - 在图表上显示开仓线、止损线、止盈线。 有了这个功能,就可以很容易地设置一个新的订单,并在开仓前看到它的附加特性。   风险管理  - 风险计算功能在考虑到设定的风险和止损单的大小的情况下,计算新订单的成交量。它允许你设置任何大小的止损,同时观察设定的风险。 批量计算按钮 - 启用 / 禁用风险计算。 在 " 风险 " 一栏中设置必要的风险值,从 0 到 100 的百分比或存款的货币。 在 " 设置 " 选项卡上选择风险计算的变量: $ 货币, % 余额, % 资产, % 自由保证金, % 自定义, %AB 前一天, %AB 前一周, %AB 前一个月。   R/TP 和 R/SL - 设置止盈和止损的关系。 这允许你设置相对于损失的利润大小。 例如, 1 : 1 - 这决定了 TP = SL 的大小。 2 : 1 - 这意味着 TP 是 SL 的两倍。 RR -
欢迎来到 Trade Manager EA——这是一个终极风险管理工具,旨在使交易变得更直观、精准和高效。它不仅仅是一个下单工具,而是一个用于无缝交易计划、仓位管理和风险控制的全面解决方案。不论您是新手交易员、资深交易员,还是需要快速执行的剥头皮交易员,Trade Manager EA 都可以满足您的需求,适用于外汇、指数、大宗商品、加密货币等各种市场。 借助 Trade Manager EA,复杂的计算已成过去。只需分析市场,在图表上用水平线标记入场、止损和止盈,设置您的风险水平,Trade Manager 就会立即计算出理想的头寸规模,并实时显示以点、账户货币计价的止损和止盈。每笔交易都得以轻松管理。 主要功能: 头寸规模计算器 :根据定义的风险瞬间确定交易规模。 简单的交易计划 :在图表上用可拖动的水平线直接计划交易,设置入场、止损和止盈。 实时显示 SL 和 TP :以账户货币、点或分显示止损和止盈,便于分析。 高级保护工具 盈亏平衡选项 : 基本盈亏平衡 :当您的交易达到设定水平时自动保护利润。 多级盈亏平衡 :设置多达 4 个级别以逐步保护利润。 尾随止损选项 : 基本尾随
================================================================================ POC BREAKOUT - V20.72. Full Professional Grade Toolkit ================================================================================ POC Breakout is a full MetaTrader 5 trading dashboard for discretionary traders who want breakout signals, Point of Control (POC) context, volume profiles, order flow, market structure, news, alerts, and advanced trade planning in one professional workspace. Attached directly to you
Strategy Ledger Pro
Abdullah Uygar Tuna
5 (7)
现已支持中文。 Strategy Ledger Pro 是一款适用于 MetaTrader 5 的只读账户分析面板。它按智能交易系统(EA)、策略、品种和魔术号拆分账户结果,让您看清每一个的真实贡献。 面板支持 11 种语言:English、Français、Deutsch、Español、Italiano、Português、Русский、Türkçe、中文、日本語 和 한국어。 下载演示版之前请注意。 Market 仅在策略测试器中运行任何付费产品的演示版。本面板分析的是您自己账户上的交易,而策略测试器中没有可读取的账户历史,因此演示版会打开一个空面板并加以说明。这是演示机制的工作方式,并非产品的限制。 本描述中的视频展示了面板在真实账户上的运行效果。 详细的 使用手册 (英文)介绍了每项功能, AureusAI Trading Suite 群组欢迎交流讨论并发布公告。 MetaTrader 对整个账户只显示一个余额。当多个 EA 同时交易时,这个余额无法说明每个 EA 的贡献。Strategy Ledger Pro 读取账户历史,重建已平仓头寸,将其归入各个策略,并在一个
Local Trade Copier EA MT5
Juvenille Emperor Limited
4.94 (149)
Local Trade Copier EA MT5 是一款快速、灵活的交易复制工具,用于在同一台 Windows 电脑或 Windows VPS 上的多个 MetaTrader 5 账户之间复制和管理交易。 它将本地交易同步与 Receiver 端的手数管理、风险管理、交易过滤、品种映射、交易管理和账户保护功能结合在一起。 只需约 1 分钟 即可完成 Transmitter 和 Receiver 终端的设置,并可在同一经纪商或不同经纪商的账户之间复制手动交易或 EA 交易。在合适的条件下,本地 MetaTrader 终端之间的交易信息可以在 0.5 秒以内 完成同步。实际交易执行速度取决于经纪商延迟、网络状况、电脑/VPS 性能以及终端负载。 购买前先试用免费演示版 您可以在 MT5 模拟账户上测试 功能完整的 Local Trade Copier EA MT5 免费演示版 ,每次可使用 4 小时 : 下载 Local Trade Copier EA MT5 免费演示版 将下载的文件放入: MT5 → 文件 → 打开数据文件夹 → MQL5 → Experts 然后重新启动 MT
Telegram to MT5 Multi-Channel Copier   可将您 Telegram 频道中的交易信号自动复制到 MetaTrader 5。无需机器人、无需浏览器扩展、无需手动复制。信号一到 Telegram,EA 几秒内就在您的终端开仓。 在复制某个频道之前,内置回测器还能告诉您该频道在您的账户上会有怎样的表现。 产品包含两个组件:一个监听您 Telegram 频道的 Windows 应用程序,以及在 MT5 终端执行信号的本 EA。同时提供 MT4 版本   点此 . 设置指南与应用下载:   https://www.mql5.com/en/blogs/post/768988 了解如何 回测任何 Telegram 信号频道 。 当前价格将来会上调。 工作原理 应用通过您自己的 Telegram 账号连接,因此能看到您关注的所有频道、群组、话题和机器人,包括私密和 VIP 频道。信号到达时,应用读取它,EA 按您的手数和设置在终端中开仓。 整个过程全自动,无需守在电脑前。专为 24/7 无人值守运行设计:Telegram 连接断开时,应用会自动重连。 打开应用并登录
TradePanel MT5
Alfiya Fazylova
4.88 (170)
交易面板是一款多功能交易助手。该应用包含超过50种手动交易功能,并允许您自动执行大多数交易任务。 应用程序说明 : https://www.mql5.com/zh/blogs/post/761102 用于模拟账户的应用程序试用版: https://www.mql5.com/zh/blogs/post/762579 如何安装应用程序: https://www.mql5.com/zh/blogs/post/762580 如何在可视化模式下测试应用程序: https://www.mql5.com/zh/blogs/post/770278 如何在VPS MetaTrader上安装应用程序: https://www.mql5.com/zh/blogs/post/770196 贸易. 只需单击一下即可执行交易操作: 打開掛單和頭寸,並自動計算風險。 一鍵打開多個訂單和頭寸。 打開訂單網格。 按組別關閉掛單和頭寸。 反轉頭寸方向(關閉買入>打開賣出,關閉賣出>打開買入)。 鎖定頭寸(通過開啟缺少的頭寸,使買入和賣出頭寸的數量相等)。 一鍵部分關閉所有頭寸。 將所有頭寸的止盈和止損設置在同一價格水平。
按照自己的交易规则复制 Telegram 信号 Telegram to MT5 Signal Trader 可将 Telegram 公开及私密频道和群组中的文字交易信号自动复制到 MetaTrader 5。通过一个桌面应用管理多个信号提供者和 MT5 账户,并为 每个提供者单独设置风险和交易参数 。 复制信号无需 Telegram 机器人,也无需配置 API。 只需通过手机号或二维码登录您自己的 Telegram 账户,然后选择您已加入的频道或群组。您无需创建机器人,也无需提供 Telegram API 令牌、API ID 或 API hash。 自行选择仓位大小,将平仓分配到多个止盈价位,并自动执行保本止损和移动止损。在跟随信号提供者的同时,掌握信号的实际交易方式。 本产品由这款 MT5 EA 和必须配合使用的 Windows 桌面应用组成。请参阅 安装指南及应用下载 。 管理多个信号提供者和账户 为每个提供者单独设置: 为每个频道设置专属的仓位计算方式、入场规则、止损、止盈和交易管理参数。 灵活分配至不同账户: 将同一提供者的信号复制到多个已连接的 MT5 账户,并为每个账户使用不
Farmed Hedge Yield Farming | All Markets (Manual - Hybrid - Semi/Automated EA) VERIFIED TRADING RESULTS - Farmed Hedge Yield Axi Copy:  https://www.mql5.com/en/signals/2356376 - Farmed Hedge Yield Exn Copy:   https://www.mql5.com/en/signals/2356404 - Farmed Hedge Yield V Copy:  https://www.mql5.com/en/signals/2357156 IMPORTANT NOTICE: FarmedHedge is a MANUAL-FOCUSED TRADING UTILITY ,not a fully automated EA. Results shown on this Signal include manual trades and overall strategic management.
Exp COPYLOT CLIENT for MT5
Vladislav Andruschenko
3.97 (35)
适用于 MetaTrader 5 的专业交易复制器 快速、专业、稳定可靠的 交易复制器 ,适用于 MetaTrader 。 COPYLOT 可在 MT4 和 MT5 终端之间复制 Forex 交易,并支持 Hedge 和 Netting 账户。 COPYLOT 的 MT5 版本支持: - MT5 Hedge → MT5 Hedge - MT5 Hedge → MT5 Netting - MT5 Netting → MT5 Hedge - MT5 Netting → MT5 Netting - MT4 → MT5 Hedge - MT4 → MT5 Netting MT4 版本 完整说明 + DEMO + PDF 如何购买 如何安装 如何获取日志文件 如何测试和优化 Expforex 的所有产品 您也可以将交易复制到 MT4 终端(MT4 → MT4,MT5 → MT4): COPYLOT CLIENT for MT4 COPYLOT 是一款专业的交易和持仓复制器,可同时与 2、3 甚至 10 个终端协同工作。 支持从 模拟账户和投资者账户 复制,也支持同时在多个终端上运行。 您可以使
Trade copier MT5
Alfiya Fazylova
4.61 (56)
Trade Copier 是一种专业实用程序,旨在复制和同步交易账户之间的交易。 复制发生从供应商的帐户/终端到收件人的帐户/终端,安装在同一台计算机或 vps 上。 在购买之前,您可以在演示帐户上测试演示版本。 演示 这里 。 完整说明 这里 。 主要功能和优点: 支持复制MT5>MT5、MT4>MT5、MT5>MT4,包括МТ5 netting账户。 供应商和收件人模式在同一产品中实现。 简单直观的界面,允许您直接从图表中实时控制复制。 连接中断或终端重新启动时不会丢失设置和位置。 允许您选择要复制的符号,也可以替换接收者的符号,例如 EURUSD> USDJPY。 允许为每个符号设置个性化的复制设置。 支持回拷贝。 能够仅复制某些订单。 允许您设置开仓交易价格的最大差异和最大时间延迟。 正确复制部分订单关闭的执行。 计算复制手数的几种方法。 同步止盈和止损。有几种方法可以计算它们的位置。 支持通过执行在“Market account”上工作,其中 SL / TP 仅在开仓后设置。 如何使用简单的设置复制交易 将供应商终端和接收终端安装在同一台计算机或 VPS 上。 在供应商终端上
Power Candles 策略扫描器——自优化多符号设置查找器 Power Candles策略扫描器 采用与Power Candles指标相同的自优化引擎,可同时扫描您“市场观察”中的所有交易品种。一个面板即可显示当前哪些品种在统计上具备交易价值、每种策略的最佳应用方向、最优止损/止盈组合,并在新信号触发时立即向您发送提醒。 本工具是 Stein Investments 生态系统的一部分 - 18+ 款工具,加上 Max,您的一对一 AI 交易导师。  随时在线,深入了解每一款指标,在您需要梳理思路的那一刻就在那里。  立即认识他: https://stein.investments 您的全面市场监控。每个交易品种超过3,000次自动优化。2种警报类型。一键切换图表并采取行动。 为何您需要此工具 大多数多标的扫描器仅展示价格 波动 。每只股票的波动率、百分比变化、RSI。您仍需自行摸索正确的策略、合适的止损位以及理想的入场阈值。Power Candles策略扫描器针对每只股票自动解答这些问题,仅在数学验证过的交易设置中触发实际入场信号时才会向您发出提示。这就是全部卖点。 自动
Signal TradingView to MT5 Pro Automator TradingView 与 MetaTrader 5 之间的即时专业执行 使用最强大的桥梁,将 TradingView 警报与 MT5 中的实际执行连接起来,实现交易策略的自动化。这款 Expert Advisor 专为要求速度、灵活性和完美风险管理的交易者设计,可将任何警报消息转化为精确的市价或限价订单。 优势与特点 通用解析引擎(专有): 先进技术,能够自动识别并提取任何警报格式中的数据。您不再受限于单一的死板格式;系统会自动理解交易品种(Symbol)、操作(Action)、价格(Price)、止损(SL)和止盈(TP)。 实时执行: 极速轮询技术(低于 1 秒),经过优化可将延迟降至最低。接收到信号后,订单将在毫秒内执行。 机构级风险管理: 基于以下方式自动精确计算手数: 净值/余额百分比(% of Equity/Balance): 每笔交易承担固定账户百分比的风险。 风险金额(Risk Amount): 设定在触发止损时损失的固定货币金额(例如:100 美元)。 固定手数(Static Lots)
MT5 to Telegram Signal Provider 是一个易于使用且完全可自定义的工具,它允许向 Telegram 的聊天室、频道或群组发送 指定 的信号,将您的账户变为一个 信号提供商 。 与大多数竞争产品不同,它不使用 DLL 导入。 [ 演示 ] [ 手册 ] [ MT4 版本 ] [ Discord 版本 ] [ Telegram 频道 ]  New: [ Telegram To MT5 ] 设置 提供了逐步的 用户指南 。 不需要了解 Telegram API;开发者提供了您所需的一切。 关键特性 能够自定义发送给订阅者的订单详情 您可以创建分层的订阅模型,例如铜、银、金。其中金订阅获得所有信号等。 通过 id、符号或评论过滤订单 包括执行订单的图表截图 在发送的截图上绘制已关闭的订单,以便额外核实 延迟发送新订单消息的可能性,以便在发送前对位置进行调整 订单详情完全透明: 新的市场订单*带截图 订单修改(止损、获利) 已关闭的订单*带截图 部分关闭的订单** 新的挂单 修改的挂单(进场价格) 挂单激活(作为新的市场订单附加) 已删除的挂单 历史订单报告
Premium Trade Manager - 内置交易导师的图表面板 Premium Trade Manager 将一位交易导师嵌入您的图表,并在其下搭载完整的执行引擎。像往常一样建立交易,然后让您的 AI 交易导师 Max 读取这笔具体的交易,结合您的实时账户给出直接判断,再由您决定是否下单:止损是否符合纪律化交易的要求、风险规模是否合理、高影响新闻事件是否即将发布、您是否接近资金盘限额。其下是完整的执行引擎,负责点击之后的一切:一键按风险下单、您在图表上拖动规划且交易进行中仍可随时调整的计划、最多四个分批止盈级别、七种移动止损方式、实时资金盘合规检查、新闻屏蔽保护,以及对自身成本进行评级的点差功能。决策由您做出。Max 给出第二次审视。面板负责此后的一切。 购买前先亲手体验。 直接在浏览器中点击实时面板,这是在购买前感受其工作方式的最快途径。 stein.investments/products/premium-trade-manager Max 是您的一对一 AI 交易导师,他直接内置于面板之中。  他了解您的账户、您的设置和您的规则,用您自己的语言回答,并在每笔交易下单前进
HINN MagicEntry Extra
ALGOFLOW OÜ
4.74 (19)
HINN MAGIC ENTRY – the ultimate tool for entry and position management! SIMPLE. FASTEST. INTUITIVE. MAX AUTOMATED. Place orders by selecting a level directly on the chart! full description   ::  demo-version  :: 60-sec-video-description Key features: - Market, limit, and pending orders - Automatic lot size calculation - Automatic spread and commission accounting - Unlimited partitial take-profits  - Breakeven and trailing stop-loss and take-profit  functions - Invalidation leves - Intuitive, a
EA Overfitter
Stephen J Martret
5 (1)
回测看起来很漂亮。但它明天、下周、下个月还能继续赚钱吗? EA Overfitter 让您的 EA 在 100 段它从未见过的价格历史上重新运行。一个分数告诉您这个优势是否真实。 回测告诉您的,是 EA 在某一段价格历史上的表现——那段恰好发生过的历史。您无法从中判断,这个结果有多少来自策略本身,又有多少只是那一条特定路径带来的。 EA Overfitter 回答的正是这个问题。它构建最多 100 段您的 EA 从未交易过的合成价格历史,让策略在全部这些历史上重新运行,并展示它所产生的完整结果区间。您得到的不再是一条幸运或不幸路径上的单个数字,而是一幅真实的图景:策略在陌生数据上多久能赚钱、典型结果是什么样(而不是最好的那一次),以及您的回测离它有多远。 这些世界是由您自己的近期历史重建而成,因此这不是预测——任何从历史数据出发的检验都不可能是预测。它告诉您的是:这个优势是否依赖于价格的某一种特定排列,以及回测数字距离典型结果有多远。在投入资金之前,这才是值得回答的问题。 三个步骤 1. 构建。在图表上选择时间区间和世界数量,然后按 Build。EA Overfitter 会
购买后请联系我,以获取完整手册包 + 3天 OpenAI API 试用,用于测试 AI 功能 + 另一份额外奖励 当前价格为八月重新发布更新的限时折扣价——请在价格上涨前立即锁定您的版本。 下一阶段价格:$340 这与您尝试过或在市场上见过的任何交易面板都完全不同。这是目前零售市场上最具创新性的 AI 驱动交易面板之一。 想象一下,将   AI 直接连接到您的图表   ——获取 AI 建议、账户审计、接收 AI 交易信号,并通过一次点击执行交易。 想象一下,通过 Telegram 在手机上管理您的   整个交易账户   ——与 AI 聊天、接收即时提醒、管理交易,并随时随地保护您的账户。 想象一下,运行   多个 EA   ,并能够分别监控每个 EA 的表现、管理其交易,或直接通过智能手机关闭特定仓位。 想象一下,您拥有一个   内置风险规划器   ,可以随时准备在图表上直接执行任何交易想法。 想象更多,更多……这一切都可以通过这款面板实现。 我们打造它的目标远不止是一款交易面板——它是一个   完整的交易套件、交易助手和 AI 导师,集于一体。 AI Desk 一个真正能够看到您账
Footprint Chart Pro — Professional OrderFlow EA for MetaTrader 5 Version 6.34 | Professional tool for real traders | Institutional-Grade Visualization DEMO USERS - PLEASE SELECT EVERY TICK / REAL TICK WHEN TESTING AND YOU HAVE DOWNLOADED HISTORICAL DATA. IF YOU SEE A WAITING SCREEN AND IT IS NOT DOWNLOADING, IT MEANS YOU HAVE LOW HISTORICAL DATA. TRY 1 MIN AND 5 MIN FIRST ON 1 DAY DATA. ONE DAY DATA SHOULD BE THE NEWEST AND MOST CURRENT DATE. PLEASE WAIT UNTIL THE MARKET HAS ROLLED OVER PERIOD.
EA Slipstream
Stephen J Martret
5 (1)
EA Slipstream — MQL5 市场产品说明(简体中文) 您的回测按照 EA 要求的价格成交了每一笔订单,您的账户却不会。 EA Slipstream 使用您自己的成交价、滑点和点差,衡量执行成本对 EA 的影响,呈现 EA 的真实表现。 回测按 EA 指定的价位计算每一笔交易。而在实盘中,挂单会按触发瞬间可获得的价格成交,止损会在行情触及时的位置平仓,当时的点差就是账户当时的报价。这两者之间的差异既不是观点,也不是模型——它已经记录在您的 EA 所下的订单里,也记录在您终端保存的价格历史里。 EA Slipstream 同时读取两者。它衡量您的账户在成交时让出了多少,每笔交易开仓那一分钟的点差是多少,以及重要新闻发布后的几秒内点差发生了什么变化。随后,它把这些测量结果应用到交易本身:既包括已在您账户上运行的 EA,也包括您加载的任意一份策略测试器报告。结果是同一个 EA 的第二次呈现——按您自己的执行条件计价,而不是按完美成交计价。 执行条件因账户而异,也因交易品种而异。本工具不对其做优劣评判,也不比较不同的服务提供方。它衡量的是您的账户实际发生了什么,并显示这对策略意味着
Trade Manager DaneTrades
Levi Dane Benjamin
4.23 (30)
交易管理器可帮助您快速进入和退出交易,同时自动计算风险。 包括帮助您防止过度交易、报复性交易和情绪化交易的功能。 交易可以自动管理,账户绩效指标可以在图表中可视化。 这些功能使该面板成为所有手动交易者的理想选择,并有助于增强 MetaTrader 5 平台。多语言支持。 MT4版本  |  用户指南+演示 交易经理在策略测试器中不起作用。 如需演示,请参阅用户指南 风险管理 根据%或$自动调整风险 可选择使用固定手数或根据交易量和点自动计算手数 使用 RR、点数或价格设置盈亏平衡止损 追踪止损设置 最大每日损失百分比,在达到目标时自动平仓所有交易。 保护账户免遭过多提款并阻止您过度交易 最大每日损失(以美元为单位)在达到目标时自动关闭所有交易。 保护账户免遭过多提款并阻止您过度交易 一键实现所有交易的盈亏平衡 自动计算从手机/电话发送的交易的风险 OCO 在设置中可用 交易和头寸管理 通过设置每月、每周、每天、每小时或每分钟的最大交易次数,停止过度交易和报复性交易。 高级挂单管理。 调整何时关闭挂单的规则 追踪挂单 支持市价订单和挂单 每日最大利润目标(以美元为单位)以确保头寸并停止
Telegram To MT5 Ultra
Mirel Daniel Gheonu
5 (5)
Telegram To MT5 — 信号复制器 将您的 Telegram 频道中的交易信号变成真实的 MT5 订单 — 自动执行,可用于任意数量的账户,风险与规则完全由您掌控。 Telegram To MT5 将您已在 Telegram 关注的 VIP / 信号频道连接到您的 MetaTrader 5 终端。一个免费的配套桌面应用读取消息(即使是禁止机器人的频道),而本 EA 在您的账户上执行这些信号 — 应用您自己的风险设置、品种映射、止盈处理、交易时段与新闻过滤。 它是一个信号复制器,而非黑箱策略:由您决定信任哪些频道,以及每笔交易如何计算手数和管理。 分步设置与配套应用安装指南 工作原理 [您的 Telegram 频道] -> [配套桌面应用] -> [MT5 + 本 EA] -> 订单 配套桌面应用(免费,已包含)使用您的 Telegram 账户登录并监视您所选择的频道。即使是禁止机器人的 VIP 频道也能正常工作,它通过一个私有、加密的本地桥接转发每条消息。 本 EA 挂在一个图表上,在 MT5 接收这些信号,并按照您的规则开仓 / 管理交易。 应用与 EA 之间的连接是位于
Dynamic Fibonacci Grid
Tsvetan Tsvetanov
5 (1)
推出最新版本的 MT5 动态斐波那契网格仪表盘(Dynamic Fibonacci Grid Dashboard)。 全新版本配备了众多新功能,为您的交易体验带来彻底升级,并让您从全新的角度观察市场和价格行为。通过同时分析多个时间周期和多个交易品种,探索更多可能性。界面友好,支持手动交易和持仓管理,并大幅扩展了预设自动化策略的应用能力。此外,DFG 现在在策略测试器中可作为交易模拟器全面运行,您可以使用历史数据重现不同的交易环境。在可视化模式中练习手动交易,在高速模式中测试自动化策略。 主要功能 • 基于动态斐波那契通道(Dynamic Fibonacci Bands)的多周期、多品种高级技术分析。 通过我们的实时市场监控仪表盘,体验前所未有的高效分析能力。我们将来自 M1、M5、M15 和 H1 图表的复杂数据合成为易于理解的网格水平。这种独特呈现方式让交易者能够在同一个屏幕上监控 10 个不同品种的价格行为,而无需依赖传统图表。结果是更快速的决策过程,以及更简洁、不杂乱的交易环境。 • 可自定义且用户友好的界面,集成最重要的功能。 包括账户状态与信息、快捷手动交易与持仓管理按
Trade Indicator Assistant   is a powerful MT5 utility designed to turn indicators into automated trading systems. Its main feature is the ability to automatically detect an indicator’s   BUY and SELL signal buffers , without requiring you to know the buffer numbers, search through indicator settings, or modify the indicator source code. Bonus Indicator:   After purchasing Trade Indicator Assistant, contact me to receive   Trade Signal Pro   completely free as a bonus indicator. [Download Demo V
Grid Manual MT5
Alfiya Fazylova
4.73 (22)
Grid Manual是一个交易面板,用于处理订单网格。 该实用程序是通用的,具有灵活的设置和直观的界面。 它不仅可以在亏损方向上设置订单网格,还可以在盈利方向上设置订单网格。 交易者不需要创建和维护订单网格,实用程序会这样做。 打开一个订单就足够了,Grid manual会自动为它创建一个订单网格,并伴随它直到非常关闭。 完整说明和演示版 此處 。 该实用程序的主要特性和功能: 伴隨以任何方式打開的訂單,包括從移動終端打開的訂單。 適用於兩種類型的網格:“限制”和“停止”。 使用兩種方法計算網格間距:固定和動態(基於 ATR 指標)。 允許您更改未結訂單網格的設置。 顯示圖表上每個網格的盈虧平衡水平。 顯示每個網格的利潤率。 允許您一鍵關閉網格中的盈利訂單。 讓您一鍵關閉每個訂單網格。 允許您對訂單網格應用追踪止損功能。 允許您在訂單網格上應用將訂單網格的止損轉移到盈虧平衡水平的功能。 相對於訂單網格的盈虧平衡水平自動重新排列止盈(僅在限價網格模式下,距離取決於所選的計算類型:“保守”或“激進”)。 最多可管理 20 個訂單網格,每個網格最多可包含 100 個訂單。 計算初始手數時,
DrawDown Limiter
Haidar Lionel Haj Ali
5 (22)
DrawDown Limiter v5.0 — 高级账户保护控制器 DrawDown Limiter v5.0 是一款运行于客户端的交易账户保护控制器,用于监控您的交易账户,并在达到您所设定的风险、盈利、新闻、时间计划、Rollover 或持仓数量限制时自动采取相应措施。 它可以通过一个独立图表监控 手动交易、自动化策略、多个 EA、挂单以及浮动持仓 。它既可以保护整个交易账户,也可以通过 Magic Number 仅监控特定 EA 或一组 EA。 DrawDown Limiter 的目的不仅仅是显示回撤,而是 主动执行您设定的交易规则 ,并在保护条件保持有效期间持续执行这些规则。 DrawDown Limiter v5.0 不仅用于监控您的亏损程度,还用于控制策略何时可以继续运行、哪些风险敞口可以保留、何时必须停止交易,以及自动化交易环境何时可以安全恢复运行。 需要帮助或有任何问题?  请查看   DrawDown Limiter 用户指南 我是  Lio ,欢迎随时联系我!  我们始终愿意为您解答问题、提供帮助并持续改进产品。 统一的保护系统 DrawDown Limiter v
Exp5 Duplicator
Vladislav Andruschenko
4.78 (9)
Duplicator for MetaTrader 5 —— 单终端内的专业持仓复制系统 这是一款面向专业交易者的可靠 Expert Advisor,用于在 MetaTrader 5 中自动复制已经打开的持仓、放大总仓位、应用自定义手数规则,并按照明确的逻辑管理复制出来的持仓。 它非常适合手动交易者、自动化系统使用者,以及希望在同一个终端内更灵活地管理已有持仓的用户。 Duplicator for MT5 并不会依靠自己的交易策略主动开仓。它的职责是监控 MetaTrader 5 账户中已经存在的持仓,并根据你的设置创建对应副本,包括复制次数、手数、Stop Loss、Take Profit、注释以及额外的管理条件。 如果你需要的是 同一个 MetaTrader 5 终端内部 的持仓复制工具,而不是不同平台或不同终端之间的复制系统,那么 MT5 版 Duplicator 正是为这种需求而设计。 MT4 版本 详细描述 + DEMO + PDF 如何购买 如何安装 如何获取日志文件 如何测试和优化 Expforex 的所有产品 链接 如果你需要 MetaTrader 终端之间 的交易复
Seconds Chart MT5
Boris Sedov
4.61 (18)
秒级图表 (Seconds Chart) - 一款专为 MetaTrader 5 设计的独特工具,用于创建秒级时间框架的图表。 通过 秒级图表 ,您可以构建以秒为单位的时间框架图表,获得标准分钟或小时图表无法提供的极致灵活性和分析精度。例如,时间框架 S15 表示每根蜡烛图持续15秒。您可以使用任何支持自定义交易品种的指标和EA交易系统。操作它们就像在标准图表上交易一样方便。 与标准工具不同, 秒级图表 让您能够在超短时间框架下进行高精度交易,无延迟干扰。 免费演示版: Seconds Chart v2.29 Demo.ex5 下载免费演示版,亲自体验: 功能齐全 - 所有功能均可使用 24小时测试 - 足够评估准确性和便利性 仅限模拟账户 - 大多数经纪商均可轻松开立 仅限GBPCAD图表 - 大多数终端均可使用 这些限制仅适用于演示版。完整版适用于任何账户类型(真实、演示、竞赛)和任何图表(XAUUSD、EURUSD 等),无任何限制。 如何安装演示版 通过上方链接下载演示文件 打开MetaTrader -> 文件 -> 打开数据文件夹 -> MQL5 -> Experts 将下
Multi Account Local Trade Copier 是一款快速的 MetaTrader 本地跟单工具:在同一台 Windows 电脑或 VPS 上的 MT4/MT5 终端之间复制交易,从一个主账户复制到多个接收账户 —— 您自己的真实、模拟和自营公司账户,同一经纪商或不同经纪商均可。它是 事件驱动 的:主终端在每笔交易发生的瞬间立即发布,接收端会 测量并记录每一笔复制的真实延迟 — 通常为 50-150 毫秒 。无 DLL,无网络桥接,无配置文件。 一个 EA,两种模式 在源终端上以 MASTER 模式挂载,在每个目标终端上以 RECEIVER 模式挂载。使用 Master ID = AUTO 时,接收端会自动找到活跃的主终端:拖入图表即可。一个主终端可以供给 无限个接收端 ,一个终端可以运行多个接收端,甚至同一个终端可以同时充当主终端和接收端。 每个接收端都有自己独立的设置 :一个按风险 % 复制,另一个按余额比例,另一个反向复制 — 资金管理始终在接收端完成。与 Multi Account Local Trade Copier MT4 配合可覆盖全部四种组合:MT5>
Trade Dashboard MT5
Fatemeh Ameri
4.94 (134)
疲于复杂的订单下达和手动计算?Trade Dashboard 是您的解决方案。凭借其用户友好的界面,订单下达变得轻而易举,只需点击一下,您就可以开设交易、设置止损和止盈水平、管理交易手数,并计算风险回报比,让您只需专注于您的策略。告别手动计算,使用 Trade Dashboard 简化您的交易体验。 立即下载演示版本 。 您可以在这里找到仪表盘功能和特性的详细信息 。 加入 Telegram 频道 。 购买后请给我发消息以获取支持。如果您需要添加更多功能,可以在产品的评论区留下您的想法,我愿意听取任何建议,希望您能在使用我的产品时获得最佳体验 。 这是 MT4 版本。 风险管理:使用 Trade Dashboard,可以将您的风险设置为账户余额或权益的百分比,或将风险设置为总金额。在图表上直观地定义您的止损,让工具准确计算每个货币对的适当手数。该工具还可以根据您期望的风险回报比自动设置止盈水平。它甚至可以在手数计算中涵盖佣金和点差费用。此外,您的止损和止盈可以转变为虚拟水平,隐藏于经纪商。通过 Trade Dashboard 的高级风险管理功能,掌控风险,保护您的资本。 交易线
作者的更多信息
This product can be used to synchronize multiple Charts, and each Chart can be set to a different sync mode. With this product you can better view and manipulate charts: different time frames for a single Symbol, the same time frame for multiple Symbols... and more. PS: The link below is the FreeDemo product, you can use it on EURUSD/XUAUSD/USDCNH symbol: https://www.mql5.com/en/market/product/38557 Feature: Chart settings  can be synchronized, including : background, indentation, size, etc. M
Do you think it's a bit cumbersome when you need to switch symbols or timeframes with mouse click? 1. What is this? This is a program that can switch symbols and timeframes with direction keys. Fast switching, very convenient, no mouse click required. For traders, one symbol with multi-timeframe charts are usually added,  you can change symbol on those charts easily. For multi-currency traders, different symbol charts are usually added, you can also change those timeframes easily. I wrote this p
1.这是什么         上涨波动和下降波动是不一样的,无论是学术研究还是实际检验都说明了这一点。         原始的ATR指标是把上涨波动和下降波动放在一起进行计算。本指标则是把上涨波动和下降波动分开进行计算,这样能更好的帮助你研究市场。 2.指标说明         本指标的计算有两种模式,如下表所示: 0 1 2 3 4 5 波动方向 + - + + - + TR 15 20 17 5 16 8 原始ATR (15+20+17+5+16+8)/6=13.5 模式1 不以0填充位置,周期数改变 模式1上涨TR 15 17 5 8 模式1下跌TR 20 16 模式1上涨ATR (15+17+5+8)/4=11.25 模式1下跌ATR (20+16)/2=18 模式2 以0填充位置,周期数不变 模式2上涨TR 15 0 17 5 0 8 模式2下跌TR 0 20 0 0 16 0 模式2上涨ATR (15+0+17+5+0+8)/6=7.5 模式2下跌ATR (0+20+0+0+16+0)/6=6         如上表。比如周期为6的序列中,有4个上涨2个下跌。模式1不
1.这是什么: 下载Market Watch中所有的Symbol数据到系统。PS:不是把数据输出到文档。 2.为什么要用这个: 如果系统中没有数据:网络链接不好的时候,用MT5看一个Symbol需要等待很长时间;在不同Symbol或不同TimeFrame切换,如果系统没有数据也需要等待很久;如果进行长时间回测,系统没有数据,需要下载很长时间。 所以提前把历史数据下载到系统中,能提高工作效率。 3.怎么使用: parameters: input bool bool_usualtimeframe=true; //true-系统默认TimeFrames; || false-所有的TimeFrames. input bool bool_allSymbol=true; //true-Market Watch中所有品种; || false-根据你的输入 input string input_Symbol=NULL; //上面参数为false时,输入你的Symbol名称 input datetime time_Start=D'2017.01.01'; //默认数据下载开始时间 input int s
Do you think it's a bit cumbersome when you need to switch symbols or timeframes with mouse click? 1. What is this? This is a program that can switch symbols and timeframes with direction keys. Fast switching, very convenient, no mouse click required. For traders, one symbol with multi-timeframe charts are usually added,  you can change symbol on those charts  easily . For multi-currency traders, different symbol charts are usually added, you can also change those timeframes easily. I wrote thi
According to trading experience: Some symbols are easy to reverse on certain days, such as Monday, or afternoon, and so on. So comparing the current price with the corresponding historical moment price is valuable. If the price coordinate system uses a logarithmic price, you will get a lot of valuable information. 1. What is this? This program can convert the symbol price and add it to your Chart. You can compare it with your major chart. The DEMO version Link: https://www.mql5.com/en/market/pr
What is this: Violent trading: means sending a large number of orders to your brokerage server,  it can conduct a stress test of the trading. In this program you can run a variety of trading tests.  Now you can trade at high speed, For example 1000 orders in an instant. The Demo version's link:  https://www.mql5.com/en/market/product/38431/ Why to use: Whether manual trading or EA trading,  the status of the broker server is very important. So it is beneficial to conduct a trading stress test on
1. Why did I develop this series of indicators I found that most traders need to use multiple time frame indicators. They usually switch time frame to see indicators. However, once the timeframe is switched, you cannot see the  corresponding relationship  between  the price in the smaller timeframe  and  the indicator in the larger timeframe . For example: if your price chart is in H1 timeframe, you can see H4, D1 and W1 indicators in H1 timeframe Chart. This is more helpful for you to find th
筛选:
无评论
回复评论