PixelBastion TD

# Pixel Bastion TD · Native 2D Classic Strategy Tower Defense for MT5

> **Experience deep tactical Tower Defense directly on your MetaTrader 5 chart! Manage gold interest, unlock powerful tower specializations, and deploy game-changing spells during market downtimes.**

---

### 🌟 Game Overview

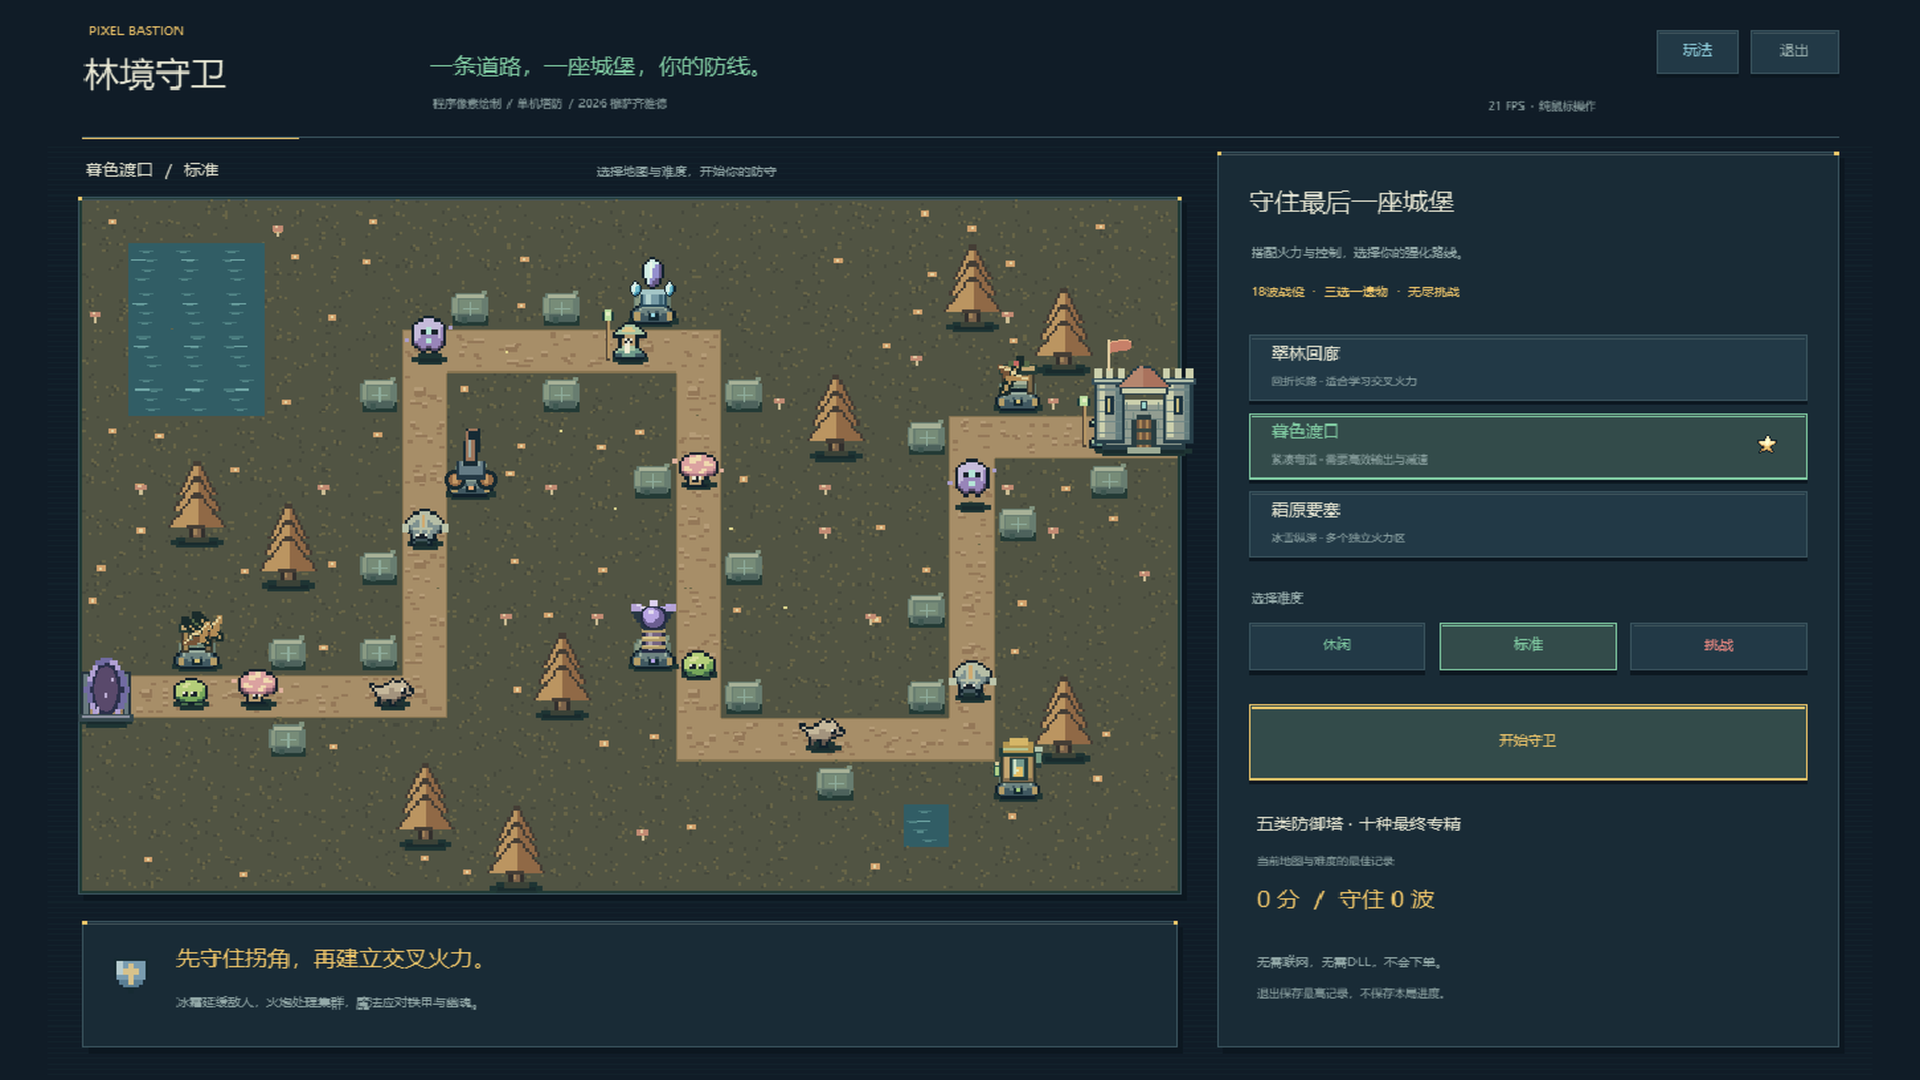
**Pixel Bastion TD** is a fully featured, standalone 2D pixel-art strategy tower defense game built natively for MetaTrader 5. As the commander of the elven frontier, your mission is to protect the fortress from waves of invading void monstrosities. Construct diverse defenses across strategic chokepoints, exploit elemental armor weaknesses, manage economic investments, research mutually exclusive Tier-3 specializations, and cast battlefield-clearing spells!

**100% Pure Mouse Control: 0 DLLs, 0 External Files, 0 Trading Risk!** Powered strictly by MT5’s built-in `<Canvas\Canvas.mqh>` software rasterization engine. It reads no market ticks, requires no internet connection, accesses no account balances, and executes no trades. Perfectly safe, endlessly replayable, and lightweight.

---

### 🔥 Key Features

1. **Native Chart Rasterization & Crisp Retro Aesthetics**
   - High-performance double-buffered rendering at **1280 × 800** logical resolution with nearest-neighbor scaling.
   - Hand-coded procedural pixel graphics: lush foliage, stone platforms, diverse turrets, monster sprites, and visual spells are all drawn directly in code—no external image assets or fonts needed.

2. **Three Tactical Maps & Three Difficulty Levels**
   - **Verdant Corridor**: 1856px winding route with adjacent parallel lanes, optimal for crossfire killzones.
   - **Twilight Crossing**: 1504px compact autumn terrain with short travel distances, demanding rapid burst DPS.
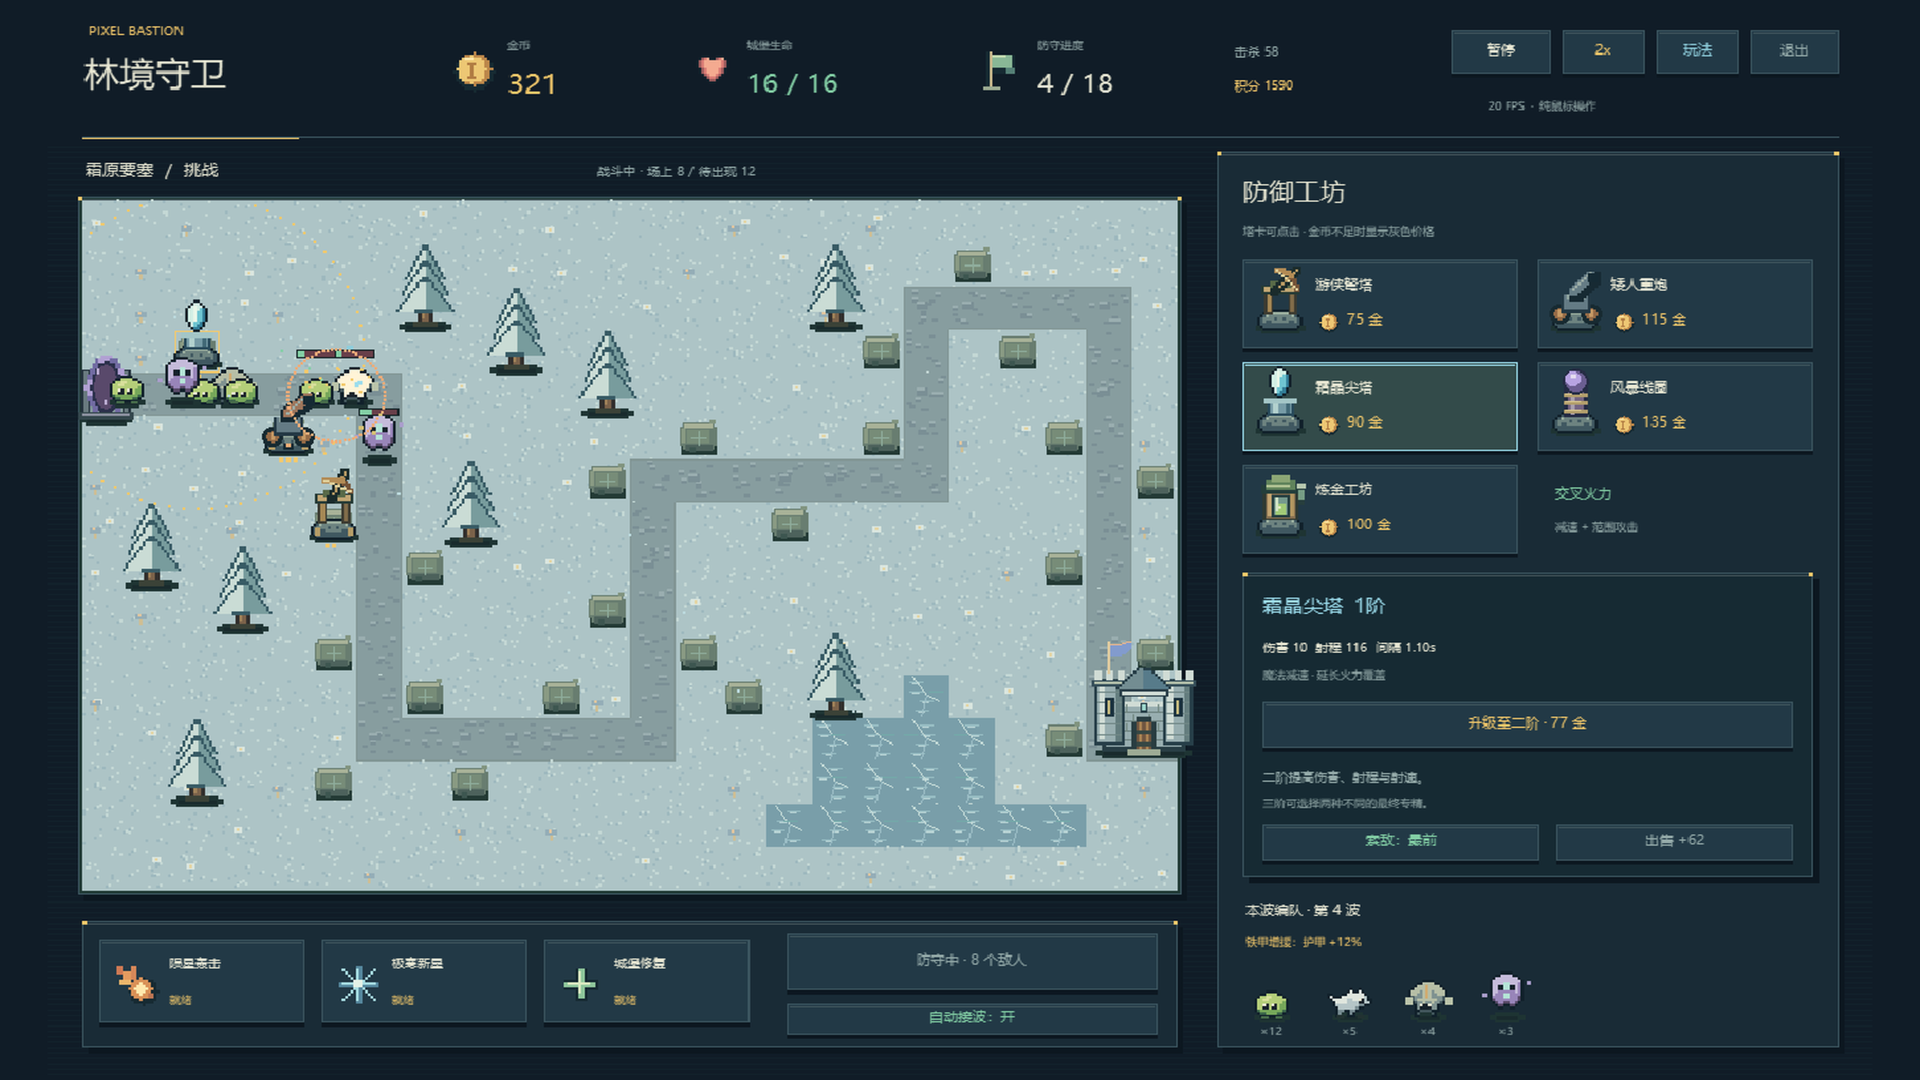
   - **Frost Fortress**: 1632px snowbound landscape with isolated firing zones and distinct defense perimeters.
   - **3 Difficulty Tiers**: Casual (390g / 25 HP / 78% mob HP), Standard (320g / 20 HP), Challenging (280g / 16 HP / 125% mob HP). Best scores and cleared waves are recorded independently per map and difficulty.

3. **Five Defense Towers with 10 Mutually Exclusive Specializations**
   Upgrade your towers through 3 tiers, choosing between two game-changing Masteries at Tier 3:
   - 🏹 **Ranger Crossbow (75g)**: Rapid physical single-target fire, ideal for light armor.
     - *Gale Repeater*: Halves attack cooldown to unleash a torrential storm of bolts.
     - *Hawkeye Ballista*: Tremendous range, crushing armor-penetrating damage, and long-range sniping.
   - 💣 **Dwarven Cannon (115g)**: Ballistic AOE devastation (Cannot hit flying Wraiths).
     - *Cluster Artillery*: Greatly expands explosion radius for overwhelming crowd suppression.
     - *Molten Mortar*: Detonations leave lingering scorch fields on the battlefield.
   - ❄️ **Frost Spire (90g)**: Magic damage with potent slowing debuffs.
     - *Heart of Permafrost*: Supercharges slow effect up to 58% lasting 3.2 seconds.
     - *Ice-Shatter Prism*: Inflicts massive bonus damage against slowed or frozen targets.
   - ⚡ **Storm Coil (135g)**: Arcing chain lightning bouncing across clustered packs.
     - *Chain Tempest*: Arcs up to 6 targets with minimal damage decay.
     - *Thunder Focus*: Sacrifices bouncing to deliver rapid, devastating single-target lightning strikes.
   - 🧪 **Alchemist Lab (100g)**: Magic direct damage + poison damage over time + armor erosion.
     - *Plague Concoction*: Widespread toxic miasma with severe armor-stripping capabilities.
     - *Midas Formula*: Slain poisoned enemies yield +3 bonus gold, accelerating economic growth.

4. **Four Smart Targeting Priorities & 70% Refund**
   - Configure targeting for each individual tower: **First**, **Strongest (Highest HP)**, **Weakest (Lowest HP)**, or **Closest**.
   - Resell any tower at any time to recover **70% of total invested gold** (including upgrade costs) for flexible tactical repositioning.

5. **Seven Unique Monster Types & Radar Forecasting**
   - **Moss Slime** (Swarm infantry), **Swift Wolf** (High-speed sprinter), **Armored Beast** (High physical armor; costs 2 HP if leaked), **Floating Wraith** (Flying ghost, immune to artillery and takes only 35% damage from crossbows; weak to magic), **Healing Shaman** (AoE heal for allies; interrupted by freeze), **Spore Splitter** (Splits into two mini-slimes upon death), and the **Ancient Treant** (Boss on waves 6, 12, 18 and every 6 waves in Endless Mode; controls resistant; costs 6 HP if leaked).
   - Bottom-right radar displays full previews of upcoming wave compositions, counts, and modifiers.

6. **Three Powerful Active Commander Spells**
   - ☄️ **Meteor Strike**: Target any road tile to drop a devastating meteor dealing `110 + (Wave × 18)` magic AOE damage (36s base CD).
   - 🧊 **Frost Nova**: Instantly freezes all regular monsters for 3.2s (1.3s on bosses) to halt breaches (46s base CD).
   - 🏰 **Fortress Repair**: Instantly repairs 4 castle HP (wastes no cooldown when full; 60s base CD).
   *(Each successfully cleared wave grants an extra 8-second cooldown reduction to all skills!)*

7. **Economy Interest & Roguelike Relics**
   - **Compound Interest**: Earn 5% cash interest on unspent gold between waves (capped at 30g max).
   - **Flawless & Quickstart Bonuses**: +15g for zero-leak waves; up to +20g for calling waves early.
   - **Choose-1-of-3 Relics**: Unlock powerful passive artifacts every 3 waves (Damage, Attack Speed, Range, Cooldown Reduction, Bonus Income, Instant Gold, Max HP, and DOT Amplification).
   - **Endless Mode**: After conquering wave 18, claim 120g and an extra relic to test your defense against infinite escalating swarms!

---

### 🎮 Mouse-Only Controls

- **Building Towers**: Click an empty stone pad, then pick a tower card from the right panel. Alternatively, select a card first and click a pad.
- **Upgrading & Specializing**: Click any existing tower to inspect its range, damage, rate of fire, and targeting mode. Upgrade to Tier 2 for general stat boosts; choose between two unique Masteries at Tier 3.
- **Targeting Modes**: Click the targeting button on the selected tower's panel to cycle priorities.
- **Casting Spells**: Click an active spell on the right sidebar. For Meteor Strike, click any highlighted path tile to deliver payload.
- **Speed & Waves**: Toggle game speed between **1x, 2x, and 3x** at any moment. Call waves manually or toggle Auto-Wave mode.
- **Menu & Pause**: Access in-game Help `[?]`, Pause `[Ⅱ]`, or Quit with a single click.

---

### ⚙️ Input Parameters

| Parameter | Default | Range | Description |
| :--- | :---: | :---: | :--- |
| `InpMap` | 1 | 1 ~ 3 | **Initial Map**. 1: Verdant Corridor, 2: Twilight Crossing, 3: Frost Fortress (Can be switched in-game). |
| `InpDifficulty` | 2 | 1 ~ 3 | **Initial Difficulty**. 1: Casual, 2: Standard, 3: Challenging. |
| `InpFramesPerSecond` | 30 | 15 ~ 60 | **Display FPS Cap**. Independent of battle simulation ticks. 25~30 FPS is recommended for low-spec PCs. |
| `InpMaxScale` | 1.5 | 0.75 ~ 2.0 | **Max Auto-Fit Scaling**. Automatically centers and fits chart window up to this multiplier. |

---

### 🛡️ Cleanliness & Safe Execution (Zero Risk)

- **Zero DLLs**: Requires no Windows API extensions or "Allow DLL imports" permission.
- **Zero Trading Interaction**: Standalone loop executes offline or when markets are closed. Reads no accounts, balances, or quotes.
- **Clean State Restoration**: Removing the script or exiting cleanly restores your chart’s original background color, candles, quick navigation, and mouse scroll settings with zero leftover chart objects.
- **Recommended Workspace**: Best experienced with a chart area of **1100 × 690** or higher (1280 × 800 optimal). Auto-pauses if resized below 900 × 560.
Altri dall’autore
This product can be used to synchronize multiple Charts, and each Chart can be set to a different sync mode. With this product you can better view and manipulate charts: different time frames for a single Symbol, the same time frame for multiple Symbols... and more. PS: The link below is the FreeDemo product, you can use it on EURUSD/XUAUSD/USDCNH symbol: https://www.mql5.com/en/market/product/38557 Feature: Chart settings  can be synchronized, including : background, indentation, size, etc. M
Do you think it's a bit cumbersome when you need to switch symbols or timeframes with mouse click? 1. What is this? This is a program that can switch symbols and timeframes with direction keys. Fast switching, very convenient, no mouse click required. For traders, one symbol with multi-timeframe charts are usually added,  you can change symbol on those charts easily. For multi-currency traders, different symbol charts are usually added, you can also change those timeframes easily. I wrote this p
1. What is this         Rising volatility and falling volatility are not the same, whether it is academic research or actual testing has shown this point.         The original ATR indicator is calculated by putting up and down fluctuations together. This indicator is to calculate separately the upward volatility and the downward volatility, which can better help you study the market. 2. Indicator description          There are two modes for the calculation of this indicator, as shown in the fo
Have you ever take a long time to watch a Symbol when the network link is not good ? Have you ever wait for a long time when you switch chart between different Symbols or different TimeFrames ? If you do long-term backtesting , Have you ever to be downloaded datas for a long time ? Yes, If there is no data in the system, those will happen.  1. What is this: Download all the Symbol data in Market Watch to the system. PS: This is not outputting data to Files. This Link go to Demo version: https:/
This product can be used to synchronize multiple Charts, and each Chart can be set to a different sync mode. With this product you can better view and manipulate charts: different time frames for a single Symbol, the same time frame for multiple Symbols, system indicators for single/multiple Symbols... and more. Feature: Chart settings can be synchronized, including : background, indentation, size, etc. Multiple Chart window start times  or end times can be synchronized. Multiple Chart time fr
I see that many tools in the market deal with Position and Order in the form of operation panels. Which is loaded into a Chart in the form of an EA. However, once the operator panel EA is loaded, no other EAs can be loaded. So, I wrote the one-click operation of Position and Order as a script, so you can load other EAs and easily complete one-click operation of Trade. 1. What is this: This is a one-click script to close position order. Now you can close position tickets at high speed, for examp
I see that many tools in the market deal with Position and Order in the form of operation panels. Which is loaded into a Chart in the form of an EA. However, once the operator panel EA is loaded, no other EAs can be loaded. So, I wrote the one-click operation of Position and Order as a script, so you can load other EAs and easily complete one-click operation of Trade. 1. What is this: This is a one-click script to delete the pending order . Now you can delete pending tickets at high speed, for
Do you think it's a bit cumbersome when you need to switch symbols or timeframes with mouse click? 1. What is this? This is a program that can switch symbols and timeframes with direction keys. Fast switching, very convenient, no mouse click required. For traders, one symbol with multi-timeframe charts are usually added,  you can change symbol on those charts  easily . For multi-currency traders, different symbol charts are usually added, you can also change those timeframes easily. I wrote thi
According to trading experience: Some symbols are easy to reverse on certain days, such as Monday, or afternoon, and so on. So comparing the current price with the corresponding historical moment price is valuable. If the price coordinate system uses a logarithmic price, you will get a lot of valuable information. 1. What is this? This program can convert the symbol price and add it to your Chart. You can compare it with your major chart. The DEMO version Link: https://www.mql5.com/en/market/pr
What is this: Violent trading: means sending a large number of orders to your brokerage server,  it can conduct a stress test of the trading. In this program you can run a variety of trading tests.  Now you can trade at high speed, For example 1000 orders in an instant. The Demo version's link:  https://www.mql5.com/en/market/product/38431/ Why to use: Whether manual trading or EA trading,  the status of the broker server is very important. So it is beneficial to conduct a trading stress test on
1. Why did I develop this series of indicators I found that most traders need to use multiple time frame indicators. They usually switch time frame to see indicators. However, once the timeframe is switched, you cannot see the  corresponding relationship  between  the price in the smaller timeframe  and  the indicator in the larger timeframe . For example: if your price chart is in H1 timeframe, you can see H4, D1 and W1 indicators in H1 timeframe Chart. This is more helpful for you to find th
Filtro:
Nessuna recensione
Rispondi alla recensione