Levels StopTP

水平(極值、止損、獲利)


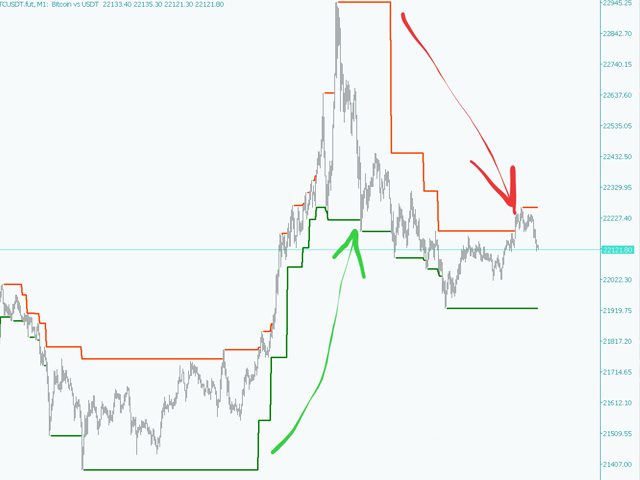
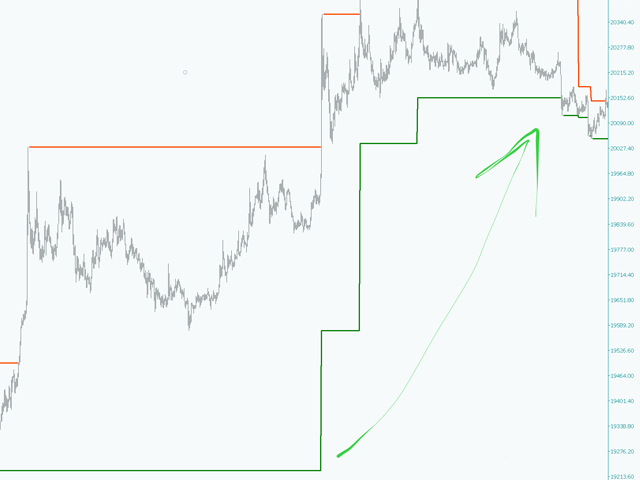
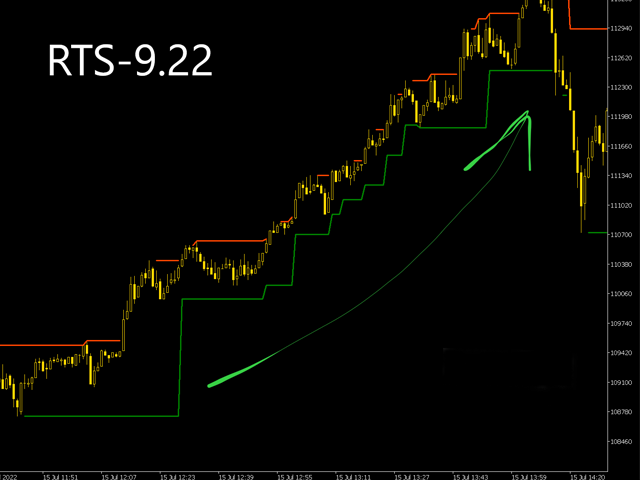
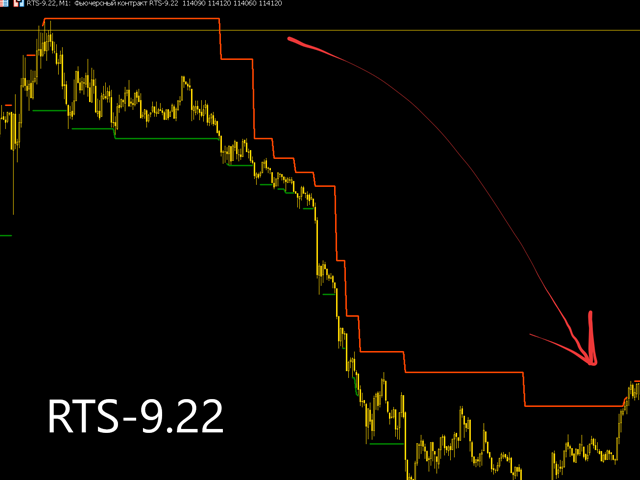
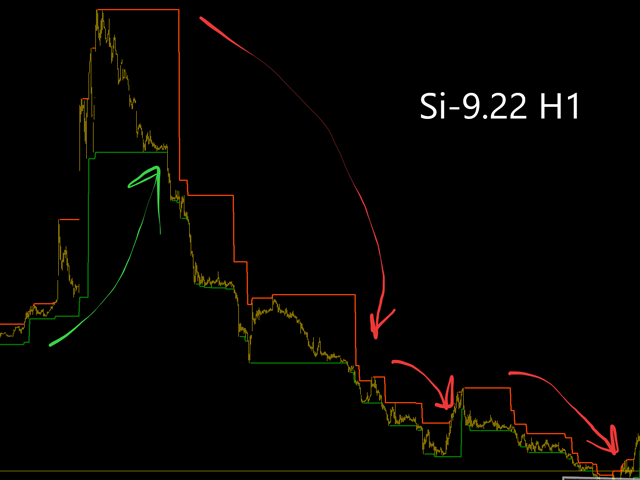
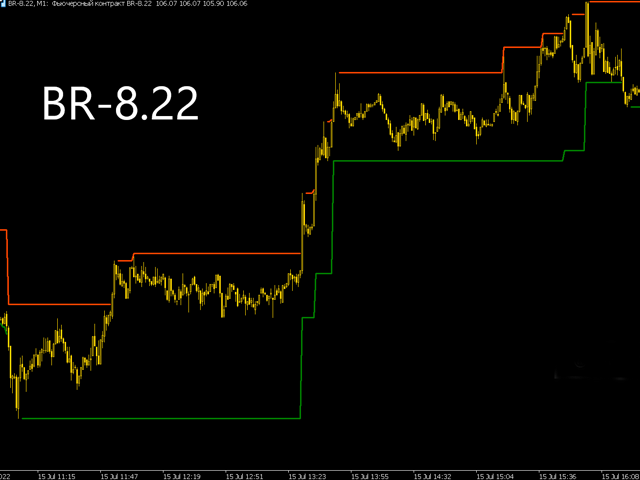
用於更改止損訂單的放置水平(由用戶手動完成,指標僅可視化水平)。它也可用於在與運動相反的水平上獲取部分利潤。 該指標將允許您採取大部分強勁的運動。您不必擔心過早退出該職位。如果您陷入強勢走勢,只需觀察支撐位並在價格突破該水平時止損退出。 該指標並非旨在搜索入場位置

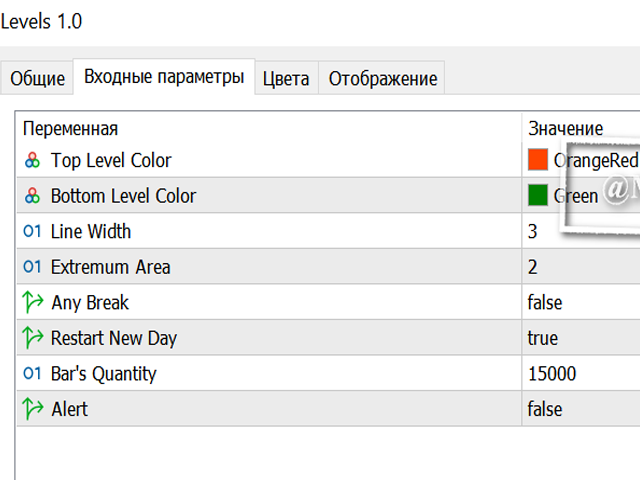
設置:

  • 極值區域 - 最初搜索極值的區域。 在這種情況下,之前有 2 根蠟燭,之後有 2 根蠟燭。
  • 类型级别-负责级别的值-蜡烛的极端或收盘价
  • Any Break - 啟用此參數可在第一級更改時提供更高的靈敏度。
  • 重新開始新的一天 - 用於具有潛在大範圍第一根蠟燭的工具的日內圖表。 否則,第一根帶有尾巴的蠟燭可能會立即決定全天的水平。
  • Bar's Quantity - 顯示指標的左側蠟燭數
....

演示版在"讨论"。 出于某种原因,MQL默认制作的演示不起作用。
推荐产品
这是一个基于前一个交易日的最高价、最低价和收盘价来计算的枢轴点指标,具体公式如下: 计算前一日的 Pivot Point (枢轴点): Pivot = (High + Low + Close) / 3 计算 Resistance 1 (R1) 、 Support 1 (S1) ​ 等: R1 = (2 * Pivot) - Low S1 = (2 * Pivot) - High R2 = Pivot + (High - Low) S2 = Pivot - (High - Low) 与市面上其他的枢轴点指标相比,该指标主要有以下4个特点: 1、可以修改交易日的开始时间; 2、可以设定支撑压力线的颜色; 3、可以设定是否显示各个支撑压力线对应的价格; 4、可以设定天数用以显示枢轴点的历史记录; 开发这个指标的最初目的是为了解决设定交易日开始时间的问题,接下来会进一步说明。基于计算公式,我们需要获得上一个交易日的最高价、最低价和收盘价,在夏令时,北京时间6点是开市时间,大多数交易平台服务器的0点对应的是北京时间的6点,但是香港的服务器6点才是对应的是北京时间的6点。如果你有多个平台,且存在
Veltrion Smart Fibonacci   is a clean automatic Fibonacci structure overlay for MetaTrader 5. It automatically detects recent swing highs and swing lows, then draws key Fibonacci retracement levels directly on the chart. The indicator is designed to help traders visualize market structure, retracement zones, and the golden zone without manually drawing Fibonacci tools. Key Features Automatic swing high and swing low detection Clean Fibonacci retracement overlay Horizontal Fibonacci levels for a
Trading Discipline Trend Dashboard 只读取您自己账户已平仓的交易历史,并把四种特定模式转化为7天走势,让您看清某种行为只是偶然一次,还是每周都在重复。它不做预测,也不给建议。面板上的每一个数字,都是这个账户上已经发生过的事实。 数字是怎么算出来的:它读取最多37天内所有品种、所有魔术号的已平仓交易——这是整个账户的画面,而不只是当前图表品种的画面。四行数据,各有各的定义。Post-loss oversize 统计在一次亏损平仓后10分钟内开出的新仓位中,手数超过30天基准值(同类新仓的手数中位数)的笔数——这与免费指标 Trade Behavior Mirror 的定义完全相同。Win-streak oversize 统计在连胜仍在持续期间开出的新仓位中,手数超过同类30天基准值的笔数——这与免费指标 Win Streak Size Creep Mirror 的定义完全相同。Symbols per day (avg) 统计某一天有新仓位的不同品种数量,并显示统计窗口内的日均值——这与免费指标 Multi-Symbol Chase Mirror 的定义
BTFX Pivot Points
Bradley Thomas Farrington
The BTFX Pivot Points is an indicator which calculates the Support and Resistance levels for each day. By using this indicator the pivot levels point out clear targets to aim for. The resistance levels are shown in purple above the silver pivot line. The support levels are shown in Orange and can be found below the silver pivot line. This indicators works very well when used with The BTFX Daybreak Indicator. For a more in depth explanation of these indicators please watch the Youtube video attac
Fair Value Gap (FVG) & Inversion Fair Value Gap (iFVG) – TradingLabs ID (公允价值缺口与反转公允价值缺口) 在 ICT (Inner Circle Trader) 和 Smart Money Concepts (SMC) 交易体系中,公允价值缺口 (Fair Value Gap, 简称 FVG)——也称为失衡区 (Imbalance)——发生在价格以极端的动能移动时,留下了一个流动性空白区。这些未填补的缺口充当未来价格行为的磁铁,使其成为专业交易者概率最高的回撤区和进场区。 但并非所有的 FVG 都是平等的。您如何知道哪个缺口具有真正的机构分量? 隆重推出 FVG & iFVG Pro 指标。 我们将标准的失衡检测提升到了一个新的水平。该工具不仅能以极高的精度自动检测新鲜 (Fresh)、已缓解 (Mitigated) 和反转公允价值缺口 (iFVG),还具备 首创的动态评分系统 。现在,您甚至可以直接看到每个 FVG 区域内部隐藏的买入和卖出压力! 停止手动绘制区域。让算法为您完成繁重的工作,从而让您可以专注于执
The CPR (Central Pivot Range) Indicator is a powerful technical analysis tool designed to identify key support and resistance levels on your MetaTrader 5 charts. It calculates the Central Pivot (CP) as the average of the previous day's high, low, and close prices, providing a central reference point. Calculates and plots 11 pivot levels (CP, BC, TC, S1-S4, R1-R4) Adjustable lookback period (default: 5 days) Option to show or hide price labels with customizable size and offset Fully customizable
FREE
Structure Levels (Highs & Lows) Indicator for MetaTrader 5 Decode Market DNA — Trade with Institutional Precision Description: The Structure Levels (Highs & Lows) Indicator is your secret weapon to map the market’s hidden roadmap. Designed for traders who think in terms of price action and market structure, this tool automatically identifies critical swing highs and swing lows, transforming chaotic charts into a clear blueprint of support/resistance zones, breakout opportunities, and trend rev
Indicator Description Range Filter Pro is a sophisticated trading tool for XAUUSD (Gold) that combines adaptive price filtering with volume analysis and real-time market monitoring. Designed for both novice and professional traders, this indicator helps identify trend direction, potential reversals, and significant market movements through its multi-layered approach. Key Components 1.Dynamic Range Filter 2.Volatility-Adjusted Bands 3.Volume-Enhanced Candles 4.Professional Trading Dashboard 5.M
FREE
Pivots Lines
Abakou Nazaire Ayelenou
5 (1)
FREE
Market Ticker Pro MT5
John Louis Fernando Diamante
The only Market Ticker on the market! Add a professional novelty to your workspace, with built in mini-charts A scrolling Market Ticker that displays price changes from all symbols in the Market Watch list. Provides an easy snapshot of symbol prices, and keeps scrolling automatically while you trade and analyse the chart. The ticker color (+/- price changes) are based on either the current or completed candle, and the previous candle. Options include: - MTF, eg choose to show price changes of t
Caicai L&S Yield Histogram Important Notice: This indicator is an integral tool of the automated EA Caicai Long and Short Pair Trading . This indicator visually displays the percentage deviation (Yield %) of a pair's current spread relative to its own historical mean. It is an excellent tool for quickly visualizing the gross financial potential of a market distortion in Long & Short operations. Main Features: Percentage Visualization: Understand the size of the distortion in palpable percentage
ICT Institutional Zones Pro
Celestine Anyango Wabomba
ICT Institutional Zones Pro — Trade with Institutional Precision Stop wasting time manually drawing key ICT levels every day. ICT Institutional Zones Pro is a professional-grade MT5 indicator built for traders who use ICT (Inner Circle Trader) and Smart Money Concepts (SMC) to read market structure with precision. This indicator automatically maps the most important institutional levels directly on your chart, helping you instantly identify where smart money is likely accumulating, distributing
Pivot Box Range draws daily pivot levels and a high-low range box for each day, and it fixes the one thing that quietly breaks most pivot indicators: the broker's short days. THE SHORT DAY PROBLEM Most brokers open a Sunday candle that lasts only an hour or two, and some holidays produce half sessions. A pivot indicator that treats those as a full day calculates Monday's levels from almost no data, and the levels land in the wrong place for the whole week. This indicator merges a short day i
FREE
SPECIAL LAUNCH OFFER: $30 (1-Month Rent) Limited time offer to build our community and gather feedback! AmbM GOLD Institutional Scalper A high-precision M5 algorithm for XAUUSD (Gold) , engineered to trade exclusively at Institutional Liquidity Levels ($5/$10 psychological marks). PERFORMANCE DATA (BUY ONLY) • Win Rate: 87.09%. • Safe Growth: +$4,113 profit on $10k (13.75% Max Drawdown). • Extreme Stress Test: Successfully generated +$22,997 in a 5-year stress test (2020-2026), proving
Rocket Trend
Andriy Sydoruk
The Rocket Trend indicator is trending. The indicator draws two-color points connected by lines along the chart. This is a trend indicator, it is an algorithmic indicator. It is easy to work and understand when a blue circle appears, you need to buy, when a red one appears, sell. The indicator is used for scalping and pipsing, and has proven itself well. Rocket Trend is available for analyzing the direction of the trend for a specific period of time. Ideal for novice traders learning the laws o
GDS Renko Entry Helper - Free Renko Price Interaction Indicator for MetaTrader 5 GDS Renko Entry Helper is a free Renko price interaction indicator for MetaTrader 5. It helps traders highlight important areas where price reacts, slows down, returns to a zone or changes behavior around support and resistance. The tool is designed for manual Renko analysis. It does not generate buy or sell signals and does not tell the trader when to enter the market. Its purpose is to help focus attention on area
Bid Price Timer Indicator — 精准计时,智能价格追踪! 使用 Bid Price Timer Indicator ,让您的交易更具 时间感与精准度 !这是专为重视 时机、精确与清晰度 的交易者打造的强大工具。 主要功能: 固定计时器显示 —— 始终显示在图表 右侧 (可自定义 X_Offset)。 动态价格追踪 —— 计时器会随 买价 (Bid) 实时 上下移动 。 自动重新定位 —— 当市场价格变化时,计时器会 自动跟随 新的价格水平。 可选水平线 —— 可添加一条 水平线 ,清晰显示 当前买价位置 。 ️ 实时倒计时 —— 每秒自动更新,显示 距离下一根K线的倒计时 ,让您不错过任何交易时机! 交易者喜爱的理由: 帮助您以 毫秒级精度 掌握K线收盘时间 让图表更 简洁、美观、信息丰富 非常适合 剥头皮、日内交易与技术分析 简洁、高效、现代化的设计,让 Bid Price Timer Indicator 成为您市场中精准控制时间的最佳助手!
The indicator plots flexible support and resistance levels (dots). A special phase of movement is used for construction. Levels are formed dynamically, that is, each new candle can continue the level or complete it. The level can provide resistance or support to the price even where it is no longer there. Also, support and resistance levels can change roles. The importance of levels is affected by: the amount of time the level is formed and the number of touches. The significance of these lev
VFI Quantum
Nikita Berdnikov
5 (1)
Introducing VFI (Volume Flow Indicator) – a trading indicator that analyzes the relationship between volume and price movement to identify key trading opportunities. The indicator displays the strength and direction of volume flow, providing clear signals about potential entry and exit points. Signals are formed based on zero line crossovers, crossovers between the VFI line and its exponential moving average (EMA), and when the indicator exits overbought and oversold zones. Attention! This stra
FREE
Market session with fibonacci
Batsukh Sumchin Khuyagbaatar
該指標是我們每天使用的最常見的指標,包括我們最常用的策略,ICT和SMC,交易所開盤和收盤時發生的止損限額和流動性限額,以及帶有斐波那契和放大和縮小的交易所交易量,以及您想要看到的最常見操作,例如選擇您想要看到的交易所走勢並拉動您想要的全波那契那,都是自動操作您想要的交易。我 100% 確信,一旦您學會使用此指標分析所有類型的交易,您將再也無法離開它。 該指標是我們每天使用的最常見的指標,包括我們最常用的策略,ICT和SMC,交易所開盤和收盤時發生的止損限額和流動性限額,以及帶有斐波那契和放大和縮小的交易所交易量,以及您想要看到的最常見操作,例如選擇您想要看到的交易所走勢並拉動您想要的全波那契那,都是自動操作您想要的交易。我 100% 確信,一旦您學會使用此指標分析所有類型的交易,您將再也無法離開它。
Opulence Levels
Tokunbo Greatpath Adebowale
Opulence Levels is a precision-engineered, non-repainting indicator that automatically identifies the most critical price levels on any chart — the exact zones where smart money reacts, liquidity is hunted, and the next big move is born. Powered by swing-based structure analysis and multi-timeframe intelligence, Opulence Levels cuts through chart noise to deliver clean, high-probability BUY LEVELS and SELL LEVELS with surgical accuracy. No guesswork. No repainting. Just levels that matter. What
“可调分形” - 是分形指标的高级版本,非常有用的交易工具! .......................................................................................... - 众所周知,标准分形 MT5 指标根本没有设置 - 这对交易者来说非常不方便。 - 可调分形解决了这个问题 - 它具有所有必要的设置: - 指标的可调周期(建议值 - 高于 7)。 - 价格高点/低点的距离可调。 - 可调分形箭头设计。 - 指标内置移动和 PC 警报。 点击这里查看高质量的交易机器人和指标! 这是仅在此 MQL5 网站上提供的原创产品。 ....................................................
成交量分布多模式:按您自己的方式分析成交量,而不是按指标的方式。 大多数成交量分布指标将交易者限制在预定义的分析范围内。但市场并非按照固定的模式运行,所以你的分析也应该如此。 成交量分布多模式指标 让您可以完全自由地决定在何时何地以及如何分析成交量。无论您是研究市场结构、分析交易时段、监控更高时间框架的活动,还是追踪正在形成的竞价行情,该指标都会适应您的交易风格,而不是强迫您去适应它。 Volume Profile Multi-Mode 专为寻求直观工作流程的初学者和要求灵活性的专业人士而设计,它将四种强大的分析方法结合到一个高度交互式和可定制的交易工具中。 四种强大的分析模式 1.       灵活框: 在控制面板中将切换按钮设置为 “灵活框” ,然后点击“创建新的灵活框” 。只需在任何价格结构周围绘制一个矩形,指标即可立即在选定区域内生成成交量分布图。您可以随时移动、调整大小或删除该框,以便在分析发生变化时创建多个独立的分布图,从而同时比较不同的市场结构。 2.       固定范围 :将切换按钮设置为 “固定范围” ,然后单击 “创建新的固定范围” 。图表上会显示两条可移动的垂直
รองรับโครงสร้างตลาดอัจฉริยะ AI PRO MT5 ไอดิเคเตอร์นี้รวม 3 ส่วนหลัก: โครงสร้างตลาด → HH / HL / LH / LL สัญญาณรูปแบบ → 2B / 123 / ตัดและทดสอบใหม่ AI Forecast (NN) → ทิศทาง + กรองสัญญาณ วิธีใช้งานจริง (เข้าใจง่าย) 1. ดูโครงสร้างตลาด (ตัวหลัก) HH + HL ต่อเนื่อง → เทรนขึ้น (หาจังหวะ ซื้อ) LH + LL ต่อเนื่อง → เทรนลง (หาจังหวะขาย) ใช้เป็น “ในหลัก” ก่อนที่จะดูสัญญาณ 2. ใช้รูปแบบการป้อนเข้า 2B ( กลับตัว) 2B บน → ขาย 2B ล่าง → ซื้อ ใช้ตอน “ตลาดเริ่มกลับ” แพทเทิร์น 123 เบรกจุด 2 → เข้าเ
No Wick Candle
Hafiz Anas Hashmi
5 (1)
No Wick Candles is a powerful price action indicator that identifies candles with no upper or lower wick (also known as Marubozu candles ) and automatically draws horizontal compensation lines from their open price with a "Compensation" label . These wickless candles represent strong momentum and are often used by professional traders as key support/resistance zones . The indicator helps you visualize potential reversal or continuation zones instantly. Key Features Detects Bullish (no lower wick
FREE
HTF Open Markers + ICT Silver Bullet Zones — Usage & Strategy Guide What it draws Session 1 / Session 2 lines : vertical lines at the open of every bar on two independently configurable higher timeframes (defaults: H4 and D1), including a projected line for the rest of today's not-yet-opened bars on sub-daily timeframes, so you can see where the next candle will open before it happens. ICT Silver Bullet zones : shaded rectangles over the three classic ICT kill-zone windows, converted from New Yo
FREE
Fractal Market Structure CHoCH BOS MT5 Fractal Market Structure CHoCH BOS MT5 is a price-action indicator designed to identify market structure through confirmed fractal formations. Instead of relying only on traditional swing-point calculations, the indicator analyzes structured candle patterns to locate important highs and lows, detect changes in directional behavior, and display relevant market structure events directly on the chart. The indicator can identify bullish and bearish Break of Str
Pivot Points Buy Zones
Nils R M Peleman
4.83 (6)
Detailed Description: The   Pivot Points Indicator   is designed for traders who rely on pivot points, midpoints and support/resistance levels for their trading strategies. By automatically calculating and plotting these levels (based on   the   previous period's high, low, and close prices) , the indicator provides a clear, visual representation of critical price areas where the market may reverse or break out.The tool is particularly useful for day traders and swing traders looking to base th
FREE
解锁聪明钱的秘密:Area of Interest + Exact Fibs! 您是否厌倦了假突破和错误的入场?您想知道大型机构和银行究竟在哪里下买单和卖单吗? 了解 Area of Interest (AOI) — 这款用于 MT5 的终极精准指标, 将先进的 Pine Script 逻辑直接引入您的 MetaTrader 5 图表。 该指标自动检测做市商留下的隐藏供需区域(Supply and Demand zones), 并将其与高精度的动态斐波那契回撤系统相结合。 停止猜测您的入场点, 开始以狙击手般的精度进行交易! 核心功能(为什么这是最好的指标): 自动供需框 (Auto Demand & Supply Boxes): 在您的实时图表上自动且准确地绘制支撑和阻力区域(兴趣区域)。 精确的 Pine 自动斐波那契 (Exact Pine Auto-Fibs): 使用高级逻辑识别最新且已确认的高低枢轴点, 自动绘制关键斐波那契水平 (0. 236, 0. 382, 0. 500, 0. 618, 0. 786)。 100% 不重绘算法 (Non-Repainting): 一旦信
Water Mark Pro MT5
Robby Suhendrawan
TradingView 风格图表水印 (TradingView Style Chart Watermark) 让您的 MetaTrader 5 图表变得和 TradingView 一样优雅专业。 您是否厌倦了 MetaTrader 默认、朴素的外观?WaterMark MT5 是一款轻量级、完全可自定义的指标,旨在通过直接向您的交易终端添加时尚、现代的水印来增强您的图表体验。 该指标缩小了标准 MetaTrader 图表与高级网页图表平台之间的视觉差距。它允许您在图表上动态显示当前的交易品种和周期,以及另外两个完全可自定义的文本标签。受现代图表工具简洁美学和 ICT 概念的启发,该指标非常适合渴望拥有更具视觉吸引力的工作区的交易者。 无论您是分享技术分析的交易导师、记录交易设置的自营公司(Prop Firm)交易者,还是单纯热爱简洁美学的爱好者,该指标都是您工具箱中不可或缺的补充。它赋予您的图表独特的专业身份,并在您将截图分享到社交媒体之前为其打上精美的品牌标识。 指标主要特点: 动态品种和周期显示: 指标自动检测并显示您当前的品种和周期。如果您从 5 分钟图表切换到 4 小时图表,文
FREE
该产品的买家也购买
SMART TREND TRADING SYSTEM — 特别优惠 您的交易系统、自动化 EA,以及配套培训与支持。 以 99 美元购买适用于 MT5 的 Smart Trend Trading System,即可 免费获赠 Smart Universal Expert Advisor ,用于自动执行系统的交易信号。 STTS 将趋势方向、入场和出场信号、反转区域及重要价格水平集中呈现在图表上。您可以根据系统手动交易,也可以连接随附的 EA,按照您选择的设置自动执行交易。 当前 99 美元的价格适用于接下来的 30 次购买。此后,价格将上调至 149 美元。 您的完整产品套装 购买后,您将获得: • 适用于 MT5 的 Smart Trend Trading System。 • Smart Universal Expert Advisor — 免费赠送。 • 完整的 STTS PDF 用户手册。 • STTS 官方在线课程。 • 逐步安装与设置指导。 • 私人客户社区访问权限及支持服务。 您不仅能获得工具,还能按照清晰的步骤学习如何使用它们。 一套系统,四种交易思路 STTS
Trend Sniper X
Sarvarbek Abduvoxobov
4.9 (39)
Trend Sniper X 是一款适用于 MetaTrader 5 的多周期趋势跟踪指标,可帮助交易者清晰精准地识别趋势方向和潜在的反转点。 适用于 MT4: https://www.mql5.com/en/market/product/193245 价格信息: 当前价格为促销价,随着后续更新和新功能的推出,价格可能会有所变动。 赠品优惠: 购买后联系作者,即可免费获取该指标的 Auto-Trade Assistant EA(自动交易助手 EA)。 Code2Profit 频道 通过多时间框架分析掌控市场! 如何使用 Trend Sniper X 最大化您的胜率:核心规则与交易时段技巧 技术规格 平台 MetaTrader 5 指标类型 多时间周期趋势指标 运行时间周期 任何图表时间周期,可独立选择更高的时间周期 (M1–MN1) 主要交易品种 外汇、黄金 (XAUUSD) 及其他差价合约 (CFD) 推荐账户 任何账户类型 可视化 彩色趋势蜡烛 (买入/卖出/微弱/变化) + 买入/卖出箭头 附加模块 交易时段方框 (悉尼、东京、伦敦、纽约) 主要功能 多时间周期趋势分析: 直接在
Neuro Poseidon MT5
Daria Rezueva
4.75 (52)
Neuro Poseidon is a new indicator by Daria Rezueva. It combines precise trading signals with adaptive TP/SL levels - creating best possible trades as a result! Message me and get  Neuro Poseidon Assistant  as a gift to automize your trading process! What makes it stand out? 1. Proven profitability on all assets and timeframes 2. Only confirmed BUY and SELL signals present on the chart 3. Adaptive TP & SL levels generated by the software for each trade 4. Easy to understand - suitable for al
SuperScalp Pro
Van Minh Nguyen
4.65 (34)
SuperScalp Pro - Professional Multi-Layer Confluence Scalping System SuperScalp Pro 是一款高级剥头皮交易指标,在经典 Supertrend 的基础上加入了多个智能确认过滤器。它可以帮助您识别概率更高的 Buy/Sell 交易机会,同时显著减少虚假信号。 清晰的 Buy 和 Sell 箭头会直接显示在图表上,基于 ATR 的 Stop Loss 和 Take Profit 水平会实时自动计算。 购买后,请联系我获取设置指导和推荐配置。 使用 SuperScalp Pro Auto Trader 轻松实现信号自动化: [Auto Trader] 下载推荐设置文件: [Set File] 完整文档请参阅产品博客: [User Guide] 加入官方频道获取最新更新: [Official Channel] SuperScalp Pro 如何工作? 只有当多个确认层同时一致时,指标才会生成交易信号(趋势 + 动能 + 成交量 + 波动率)。 您可以手动交易,也可以连接 SuperScalp Pro Auto Tr
Gann Made Easy MT5
Oleg Rodin
5 (10)
Gann Made Easy   是一个专业且易于使用的外汇交易系统,它基于使用先生理论的最佳交易原则。 W.D.江恩。该指标提供准确的买入和卖出信号,包括止损和获利水平。您甚至可以使用推送通知在旅途中进行交易。 购买后请联系我,即可免费获得交易指导和超棒的额外指标! 您可能已经多次听说过江恩交易方法。通常 Gann 的理论不仅对于新手交易者而且对于那些已经有一定交易经验的人来说都是非常复杂的东西。这是因为江恩的交易方法在理论上并不那么容易应用。我花了几年时间来完善这些知识,并将最好的原则应用到我的外汇指标中。 该指标非常易于应用。您所需要的只是将其附加到您的图表并遵循简单的交易建议。该指标不断进行市场分析工作并寻找交易机会。当它检测到一个好的入口点时,它会为您提供一个箭头信号。该指标还显示止损和获利水平。 换句话说,当您像先生一样进行交易时,该指标会为您提供最佳江恩建议。江恩亲自告诉你此时此刻该做什么。但最好的部分是您不需要了解任何有关江恩交易原则的知识,因为该指标会为您完成整个市场分析工作。
M1 Sniper MT5
Oleg Rodin
5 (7)
M1 SNIPER   是一款易于使用的交易指标系统。它是一个专为 M1 时间框架设计的箭头指标。该指标可以作为独立的系统在 M1 时间框架下进行剥头皮交易,也可以作为您现有交易系统的一部分使用。虽然该交易系统专为 M1 时间框架交易而设计,但它也可以用于其他时间框架。我最初设计此方法是为了交易 XAUUSD 和 BTCUSD。但我发现这种方法在其他市场交易中也同样有用。 指标信号既可以顺势交易,也可以逆势交易。我教授一种特殊的交易技巧,帮助您利用指标信号进行双向交易。该方法基于使用特殊的动态支撑位和阻力位区域。 购买后,您可以立即下载 M1 SNIPER 箭头指标。此外,我还为所有 M1 SNIPER 工具用户免费提供下方屏幕截图所示的 Apollo Dynamic SR 指标!这两个指标的组合可以帮助您更轻松、更准确地利用 M1 时间框架进行交易。 购买后请联系我,免费获取交易提示和奖励指标! 祝您交易成功!
Entry Points Pro for MT5
Yury Orlov
4.52 (151)
传奇回归:Entry Points Pro 10。 这款传奇指标曾 3 年稳居 MQL5 Market 前三,如今全面重启。 数百条热情好评(两个版本合计 589 条),每天有数千名交易者用它交易,演示版下载 31,000+   MT4+MT5  次。 五年来我读过你们的每一条评价——在第 10 版里,我没有给出许诺,而是把答案直接做进了产品。指标作者自 1999 年入市, 珍视诚信、自己的声誉和自己的客户 。 Entry Points Pro 给出的入场信号严格不重绘。 而且这一次不再只是作者的一面之词,而是可验证的事实:确认信号只在 K 线收盘后标出,自动化测试记录到 零重绘 (在 EURUSD、XAUUSD 和 BTCUSD 上共 2,486,568 次不变量检查——0 次违规)。测试方法完全公开——您可以在策略测试器中自行复现。 购买后请务必第一时间给我发私信。 我会发给您 扩展版说明书《交易者圣经》 ——使用本指标交易的完整指南——并告诉您如何免费获得 赠品:市场扫描器 ,它能同时分析多个品种和多个时间周期,并在一个界面上显示 Entry Points Pro 此刻在哪里表现
Unix Scalper
Issam Kassas
4 (4)
UNIX SCALPER — 特别优惠 发现交易形态,看清交易计划,选择执行方式。 以 99 美元购买适用于 MT5 的 UNIX Scalper,即可免费获赠 Smart Universal Expert Advisor,用于自动执行指标的交易信号。 UNIX Scalper 将市场分析、BUY/SELL/WAIT 决策以及 Entry、Stop Loss、TP1 和 TP2 水平集中在一个清晰的面板中。您可以按照交易计划手动交易,也可以连接随附的 EA,按照您选择的设置自动执行交易。 当前 99 美元的价格适用于接下来的 30 次购买。此后,价格将上调至 149 美元。 您的完整产品套装 购买后,您将获得: • 适用于 MT5 的 UNIX Scalper。 • Smart Universal Expert Advisor — 免费赠送。 • 完整的 UNIX Scalper PDF 用户手册。 • UNIX Scalper 官方在线课程。 • 逐步安装与设置指导。 • 私人客户社区访问权限及支持服务。 您不仅能获得工具,还能按照清晰的步骤学习如何使用它们。 看清信号与交
Reversion King Indicator
Eugen-alexandru Zibileanu
5 (9)
全新王者降临 - 指标 + 订单管理提示(TP1 + TP2 + TP3)+ 可选 Telegram 信号发送器 INCLUDED(免费) (完整交易与信号系统) 我们最强的黄金 EA: Gold Slayer 该指标包含先进的交易策略、可自定义订单管理系统,以及结合 Envelope 扩展的均值回归系统,并通过 RSI 等多重智能确认过滤器进行验证,以捕捉高概率反转入场机会,提供 BUY 与 SELL 信号。 你不仅能够学习如何交易,还能学会如何高效管理多个仓位,并利用之前盈利的持仓来覆盖亏损交易。 专为 M5 周期打造并优化,在 BTCUSD 和 XAUUSD 上表现尤为出色,因为这些市场的流动性能够让信号更加干净、可靠。 该指标会自动生成清晰的多头(Long)与空头(Short)信号,同时基于 ATR 自动计算入场位、止损位和止盈位,让风险管理从一开始就融入系统之中。 多 TP 系统设有三个渐进式目标位,你可以在 TP1 锁定部分利润、在 TP2 继续持仓,并在更大的行情中将仓位持有至 TP3,而这正是平均风险回报比真正开始大放异彩的地方。 默认参数开箱即用,已经针对稳定表现进行
Welcome to ENTRY IN THE ZONE AND SMC MULTI TIMEFRAME Entry In The Zone and SMC Multi Timeframe is a real-time market analysis tool based on Smart Money Concepts (SMC), designed to analyze market structure, price direction, and key trading zones. It supports both Single-Timeframe Analysis and Multi-Timeframe Analysis, providing a clearer view of the overall market structure across multiple timeframes, with real-time BUY / SELL signals that do not repaint. It is designed to help filter trading opp
FiboSniper Pro
Van Minh Nguyen
5 (3)
FiboSniper Pro – Multi-Filter Fibonacci System with Auto SL/TP and Control Panel FiboSniper Pro 是一款技术指标,将动态 Fibonacci Envelopes 与多个确认过滤器相结合,以生成经过筛选的 Buy 和 Sell 信号。Fibonacci 水平基于 Moving Average 和 ATR 计算,然后通过 ADX、EMA、RSI、ATR、Volume、Time 和 Candle 结构进行过滤。该指标直接在图表上显示基于 ATR 自动计算的 Stop Loss 和 Take Profit 水平,并提供交互式控制面板,以便快速调整参数。 购买后,请联系我以获取推荐的设置文件和详细使用说明。 使用 Auto Trader X 自动执行 FiboSniper Pro 信号: [Auto Trader X] 用户指南和设置文件: [Click here] 加入官方频道获取最新更新: [Click here] 专为偏好结构化入场和清晰风险管理的交易者设计,适用于 Gold (XAUUSD)、B
Atomic Analyst MT5
Issam Kassas
4.46 (59)
ATOMIC ANALYST — 特别优惠 您的市场分析工具、自动化 EA,以及配套培训与支持。 以 99 美元购买适用于 MT5 的 Atomic Analyst,即可 免费获赠 Smart Universal Expert Advisor ,用于自动执行指标的交易信号。 Atomic Analyst 将价格行为、趋势方向、入场和出场信号、止损位及多个止盈位集中呈现在图表上。您可以参考其分析手动交易,也可以连接随附的 EA,按照您选择的设置自动执行交易。 当前 99 美元的价格适用于接下来的 30 次购买。此后,价格将上调至 149 美元。 您的完整产品套装 购买后,您将获得: • 适用于 MT5 的 Atomic Analyst。 • Smart Universal Expert Advisor — 免费赠送。 • 完整的 Atomic Analyst PDF 用户手册。 • Atomic Analyst 官方在线课程。 • 逐步安装与设置指导。 • 私人客户社区访问权限及支持服务。 您不仅能获得工具,还能按照清晰的步骤学习如何使用它们。 看清信号,理解交易形态 Atom
Auto Optimized SpeedAngle 是一款机构级的动量向量化系统,通过持续的前瞻优化(Walk-Forward Optimization, WFO)彻底消除了曲线拟合(curve-fitting)。该指标没有采用在市场 状态转换时容易失效的静态输入参数,而是利用出样外验证(Out-of-Sample, OOS) dynamically 动态重新校准设置,从而确保显示的 信号代表真正的统计优势,而非历史巧合。 核心机构级架构 前瞻优化引擎(Walk-Forward Optimization Engine): 核心算法持续扫描数千种回溯周期(lookback)与阈值组合,严格将数据划分为样本内(in-sample)和样本外(out-of-sample)。只有当参数配置在未知数据环境中证明具备数学优越性时,系统才会对其进行 adoption。 量化目标函数(Quantitative Objective Functions): 优化引擎不一味追求绝对毛利,而是聚焦于机构级的稳定性指标。用户可针对系统质量数(SQN)、期望值(每笔交易的平均 R 倍数)或净 R 值进行优化,从而优
货币强度向导是一个非常强大的指标,为您提供成功交易的一体化解决方案。该指标使用多个时间范围内所有货币的数据来计算这个或那个外汇对的力量。此数据以易于使用的货币指数和货币电力线的形式表示,您可以使用它们来查看这种或那种货币的力量。 您所需要的只是将指标附加到您要交易的图表上,该指标将向您显示您交易的货币的真实强度。该指标还向您显示买卖量压力的极值,您可以在顺势交易时利用这些压力。该指标还显示了基于斐波那契的可能目标。该指标可用于各种交易时间范围。该指标支持各种货币对的交易。   该指标为您提供所有类型的警报,包括推送通知。 购买后请联系我。我将与您分享我的交易技巧,并免费为您提供丰厚的红利指标! 祝您交易愉快,获利丰厚!
Adaptive Price Action Engine 买指标,免费送EA 自适应多时间框架趋势与K线形态智能分析系统 市场环境始终在变化,不同的市场阶段中,并非所有 Price Action 形态都具有相同的参考价值。 Adaptive Price Action Engine 旨在适应不断变化的市场条件,将 趋势结构、多时间框架分析、K线形态与统计优化 整合到一个统一的分析框架中。 两种自适应模式 Dual Alpha Trend Mode(双 Alpha Trend 模式) 自动搜索适合的 Alpha Trend 参数,并结合低周期与高周期市场结构,使指标能够根据近期市场行为动态调整趋势识别。 Candlestick + Alpha Mode(K线 + Alpha 模式) 将 Alpha Trend 市场状态与 22种多空K线形态 相结合。系统不会简单地对所有形态一视同仁,而是对不同的形态组合进行统计评估,并识别在特定市场环境下表现出更强历史统计特征的配置。 主要功能 趋势参数自动优化 多时间框架市场状态分析 22种多头与空头 Price Action K线形态 对数千种可能
M1 Quantum MT5
Hamed Dehgani
4.2 (10)
使用 M1 Quantum 的实盘交易信号 : 信号 (交易由 Quantum Trade Assistant 自动 执行,并作为本产品 免费 提供。) 最新消息: 版本 1.64 已发布。现在所有交易的止损都会设置在相应的支撑位/阻力位之后。Smart Close 功能也进行了改进,以提升此版本 EA 的性能。 自 8 月 9 日起,实盘信号一直运行在版本 1.64 上。 价格计划: 当前价格: $169 (早期用户优惠) 下一阶段计划价格: $189 计划零售价: $299 开发者提示: 购买后请联系我,以获取 最新推荐的参数设置文件(Set File) 、交易建议,以及加入 VIP 支持群组 ,与其他 M1 Quantum 用户交流经验。 常见问题 - 设置文件 - 安装指南 M1 Quantum 是一款专业的 M1 交易系统,提供快速且精准的交易信号,并内置止损(Stop Loss)、止盈(Take Profit)以及智能资金管理功能。 M1 Quantum 包含专业的资金管理系统,通过专注于 连续盈利交易 ,帮助交易者更快地增长账户资金。 M1 Quantum 指标 的主
Volatility Master for MetaTrader is a real-time dashboard tool that scans up to  50 symbols  to identify high-volatility , trending markets instantly. With bullish/bearish signals, customizable alerts, and a user-friendly interface, it helps you avoid range-bound conditions and focus on high-probability trades. Clarity leads to confidence. Trade confidently and protect your capital effectively with this powerful dashboard. We don't offer free or bonus indicators in exchange of reviews from you.
Power Candles MT5
Daniel Stein
4.58 (12)
Power Candles V3 - 自我优化的强度指标 Power Candles V3 把货币与品种的强度直接转化为图表上可执行的交易方案。指标不再仅根据强度给K线着色,而是在后台持续运行实时自动优化,为您正面对的品种给出最佳 Stop Loss、Take Profit 与信号阈值。一键采用,Entry、Stop Loss、Take Profit 线就以精确价格绘制在图表上,提醒消息中直接包含方向。 本工具是 Stein Investments 生态系统的一部分 - 18+ 款工具,加上 Max,您的一对一 AI 交易导师。  随时在线,深入了解每一款指标,在您需要梳理思路的那一刻就在那里。  立即认识他: https://stein.investments 每根收盘K线运行 3,000+ 次交易模拟。9 种强度状态。2 种策略并行测试。一键采用最优配置。 为什么需要这个 大多数强度指标只给您一个数值,然后留下三个问题:相信哪个阈值、用哪个 Stop Loss、走哪个交易方向。Power Candles V3 在每根收盘K线上自动回答这些问题。结果就是一个完整的交易方案 -
PZ Trend Trading MT5
PZ TRADING SLU
3.8 (5)
许多盈利交易者不仅知道如何识别市场趋势,而且也能把握趋势建立后的交易机会。 Pz 趋势交易 指标设计用来在趋势行情中尽可能的赚取利润。 已建立的趋势提供了一揽子交易机会,但大多数趋势交易指标完全忽视了它们,让交易者在趋势行情时完全不知道该如何做!一般趋势指标只通知有关的趋势变化,但根本不足以得到卓越的回报. Pz 趋势交易 指标比一般趋势指标显示多达 20 倍的交易 , 因为它注重所谓的市场时机。它不仅显示当前的市场趋势,也有回调,内柱线的突破和调整。它令您在趋势回调之后介入,安全的柱线内突破金字塔加仓,以及发现潜在的反转,和已知的调整。 趋势改变 一个趋势改变在市场方向变化时发生。趋势变化在图表上用带数字的彩色圆圈显示。蓝色 (1) 信号为上涨开始, 而红色 (1) 信号为下跌开始。趋势变化并非评估当前价格动作的结果, 它意味着交易设置是不定时地。如果您正确使用本指标, 在趋势变化时, 您将将已经入场 (参看下面的调整)。 回调 但凡趋势在运动中,行情上下抖动,盈利者收割利润,且其它参与者入场。趋势回调代表好的买入机会,通常是由主力获利离场导致。如果行情在回调后回归上行, 指标将
Scalper Vault   是一个专业的剥头皮系统,为您提供成功剥头皮所需的一切。该指标是一个完整的交易系统,可供外汇和二元期权交易者使用。推荐的时间范围是 M5。 该系统为您提供趋势方向的准确箭头信号。它还为您提供顶部和底部信号以及江恩市场水平。无论您拥有何种交易经验,该系统都易于使用。您只需要遵循简单的规则并每天重复该过程。 建议将此系统用于主要货币对。感谢您的关注! 请注意,该指标在策略测试器中可能无法正常工作。因此,我建议仅在模拟或真实账户的真实交易条件下使用该系统。 指示器提供所有类型的警报,包括推送通知。 购买指标后请与我联系。我将免费与您分享我的个人交易建议和出色的奖励指标! 祝您交易愉快,盈利!
IQ FX Gann Levels a precision trading indicator based on W.D. Gann’s square root methods . It plots real-time, non-repainting support and resistance levels to help traders confidently spot intraday and scalping opportunities with high accuracy. William Delbert Gann (W.D. Gann) was an exceptional market analyst, whose trading technique was based on a complex blend of mathematics, geometry, astrology, and ancient mathematics which proved to be extremely accurate. We don't offer free or bonus indic
Divergence Bomber
Ihor Otkydach
4.89 (94)
购买该指标的每位用户将额外免费获得以下内容: 原创工具“Bomber Utility”,该工具会自动跟踪每一笔交易,设置止损和止盈点,并根据策略规则自动平仓; 适用于不同交易品种的指标设置文件(Set 文件); 三种不同风险模式下的 Bomber Utility 设置文件:“最低风险”、“平衡风险” 和 “观望策略”; 一套详细的 视频操作手册,帮助您快速完成安装、配置并开始使用本交易系统。 注意: 要获取以上所有赠品,请通过 MQL5 的私人消息系统联系卖家。 我为您介绍原创的自定义指标 “Divergence Bomber”(背离轰炸机),它是一套基于 MACD 背离交易策略 的“全功能”交易系统。 该技术指标的主要任务是识别 价格与 MACD 指标之间的背离,并发出交易信号(包括推送通知),指示未来价格可能的运动方向。平均而言,这些信号的准确率超过 98%。有关该指标如何工作的详细说明,请观看本页面上的视频演示。 该系统使用 止损订单 和 动态回撤平仓机制 来管理交易。 Divergence Bomber 指标的主要特点: 支持交易的品种: AUDCAD、AUDCHF、AUDS
Trend Catcher ind mt5
Ramil Minniakhmetov
5 (18)
趨勢捕捉指標 趨勢捕捉指標結合了作者獨有的客製化自適應趨勢分析指標,用於分析市場價格趨勢。它透過過濾掉短期噪音,並專注於潛在的動能強度、波動性擴張和價格結構行為,來識別真實的市場方向。此外,它還結合了平滑和趨勢過濾等客製化指標,例如移動平均線、相對強弱指標 (RSI) 和波動率過濾器。 您可以在這裡查看實際運行情況以及我的其他產品: https://www.mql5.com/en/users/mechanic/seller 請注意,我不會在 Telegram 上出售 EA 或任何設置,那是騙局。所有設定都可以在我的部落格上免費取得。 重要提示!購買後請立即聯繫我,以獲取使用說明和額外獎勵! 請注意,我不會在 Telegram 上出售 EA 或任何設置,那是騙局。所有設定都可以在我的部落格上免費取得。
FX Trend MT5 NG
Daniel Stein
5 (6)
FX Trend NG:新一代多市场趋势智能分析工具 概述 FX Trend NG 是一款专业的多时间周期趋势分析与市场监控工具,帮助您在几秒钟内全面了解市场结构。 无需在多个图表之间来回切换,您可以立即看到哪些品种处于趋势中、哪里动能正在减弱,以及哪些时间周期之间存在强烈共振。 限时发布优惠 – 仅需 $30(6个月) 或 $80 终身授权 即可拥有 FX Trend NG 。 已经是 Stein Investments 客户? -> 发送消息 以获取专属客户群访问权限。 需要帮助或安装指导? -> 请访问 Stein Investments 官方页面 。 1. FX Trend NG 的核心优势 三状态趋势逻辑 —— 不只是 Buy 或 Sell • 大多数指标仅显示两种状态:Buy 或 Sell。 • FX Trend NG 增加第三种状态: Fade 。 • Fade 表示趋势强度正在减弱,在完全反转之前提前发出信号。 这种结构化逻辑让您看到趋势变化过程,而不仅仅是简单方向信号。 多时间周期分析(M1 至 MN1) • 从短线交易到中长线交易全面覆盖。 • 快速识别趋势
First time on MetaTrader, introducing IQ Star Lines - an original Vedic Astrology based indicator. "Millionaires don't use astrology, billionaires do" . - J.P. Morgan, Legendary American financier and banker. We don't offer free or bonus indicators in exchange of reviews from you. You won't need any free products with this indicator to make it work. ;) Enjoy! Welcome to  the new and updated  IQ Star Lines , the ultimate fusion of ancient planetary harmonic cycles and modern quantitative trading.
Gartley Hunter Multi
Siarhei Vashchylka
5 (12)
Gartley Hunter Multi - An indicator for searching for harmonic patterns simultaneously on dozens of trading instruments and on all possible timeframes. Manual (Be sure to read before purchasing) | Version for MT4 Advantages 1. Patterns: Gartley, Butterfly, Shark, Crab. Bat, Alternate Bat, Deep Crab, Cypher 2. Simultaneous search for patterns on dozens of trading instruments and on all possible timeframes 3. Search for patterns of all possible sizes. From the smallest to the largest 4. All fou
ATstrong
Zaha Feiz
5 (1)
ATSTRONG PRO: 市场结构与突破指标 突破检测引擎 | 5个动态TP目标 | 实时仪表板面板 | 不重绘 首发价格 当前价格: $59 — 每售出10份价格增加$10。 ATSTRONG PRO 是一款专为 MetaTrader 5 设计的高级突破和机构市场结构指标。 它能够检测高概率波段枢轴,识别集群的支撑和阻力堆积区,并实时发送结构破坏(BOS)和特征改变(CHoCH)信号。 该指标会自动在您的图表上绘制动态止损和5个不同的止盈水平(TP1到TP5), 并配有风险回报预测框、星级信号质量评级以及图表上的实时绩效分析仪表板。 交易提示: 这是一款用于手动交易和市场分析的指标。它在K线收盘时显示清晰的视觉信号、水平和警报,并且 完全不重绘 。它不执行自动交易。 核心亮点与特性 智能突破引擎: 同时检测集群水平区域突破和单波段枢轴突破(BOS / CHoCH)。 突破强度评分: 评估动能、成交量/K线实体大小和枢轴质量,以过滤虚假突破和诱多/诱空。 5阶段止盈水平: 预测可自定义的R倍数目标(TP1: 0.5R, TP2: 1.0R, TP3: 1.5R, TP4:
SkyHammer Signal Pro
Shengzu Zhong
5 (4)
SkyHammer Signal Pro Professional No-Repaint Trend Signal Indicator with Locked Entry, SL and TP Levels SkyHammer Signal Pro is a structured trend and momentum signal indicator designed for traders who want clear, fixed, and verifiable trading signals. It works best on lower timeframes such as M1 and M5 . The indicator does not try to predict tops or bottoms. Instead, it waits for confirmed market structure, trend direction, momentum strength, volatility quality, and target space before generati
Hydra Trend Rider   is a premium multi-timeframe dashboard that instantly reveals the market trend across 9 timeframes (M1 to Monthly). Using a highly accurate, non-repainting AI-Powered algorithm, it helps you trade in the direction of the dominant market momentum. We don't offer free or bonus indicators in exchange of reviews from you. You won't need any free products with this indicator to make it work. ;) Enjoy! User Manual: Here MT4 Version: Here MQL5 Channel - For daily market insight
FX Power MT5 NG
Daniel Stein
5 (33)
FX Power:分析货币强度,助您做出更明智的交易决策 概述 FX Power 是一款专业工具,帮助您全面了解主要货币和黄金在任何市场条件下的真实强度。通过识别强势货币用于买入,弱势货币用于卖出, FX Power 简化了交易决策,并帮助您发现高概率的交易机会。不论您是想跟随趋势还是通过极端的 Delta 值预测反转,这款工具都能完美适应您的交易风格。别再盲目交易——用 FX Power 让您的交易更加智慧。 1. 为什么 FX Power 对交易者极具价值 实时货币和黄金强度分析 • FX Power 实时计算并显示主要货币和黄金的相对强度,助您全面了解市场动态。 • 监控领先或落后资产,轻松识别值得交易的货币对。 全面的多时间框架视图 • 跟踪短期、中期和长期时间框架的货币和黄金强度,以便将您的交易策略与市场趋势保持一致。 • 无论是快进快出的短线交易还是更长期的投资策略, FX Power 都能为您提供所需的信息。 Delta 动态分析用于趋势和反转 • 极端 Delta 值常常预示反转机会,而平缓的 Delta 变化则确认趋势延续。 • 使用 Delta 分析,轻
作者的更多信息
RENKO Reversal
Anton Polkovnikov
5 (3)
RENKO Reversal by StockGamblers Actually working RENKO in MT5. Uses "custom symbols" for drawing. You can apply any indicators with complete peace of mind. The movement of the last price is displayed in real during the formation of the "brick". Put the script in the MQL5/Experts folder. More precisely: C:\Users\user\AppData\Roaming\MetaQuotes\Terminal\terminal_number\MQL5\Experts Settings: ValuePerBar - height of the "brick" in points revCandle - multiplier for the height of the turning "brick".
FREE
The script removes all of the indicators on the chart with one movement of the hand. There are situations when there are too many indicators on the chart. And it is required to delete all of them without closing the tab. Unfortunately, the settings window doesn't allow us to select all indicators at once and we have to delete one by one. This script will solve this problem. Simply drag the script   from Navigator window onto the chart.
FREE
Anchored VWAP (with no Volume) A unique development of one of the most useful VWAP indicators. This product allows you to get away from using the basics of VWAP, namely the volume. Everything is calculated without it. In addition, a convenient system for selecting starting points has been developed - by moving the "starting field" you indicate to the script the area, in which the extremum, from which the calculation will start, should be searched for. The main advantages of this development: con
TrendMeasurer indicator manual / TMi manual The indicator is designed to help the user to find the end point of a strong trending price movement. Important - END. Not start. How the indicator works The first price impulse and its subsequent pullback form a certain "critical mass" which acts as "fuel" for further price movement. The production of this fuel indicates the potential end of the trend. Both volume and indicator calculated in a certain way from price data can be the fuel. The amount of
TrendMeasurer indicator / TMi The indicator is designed to help the user to find the end point of a strong trending price movement. Important - END. Not start. How the indicator works The first price impulse and its subsequent pullback form a certain "critical mass" which acts as "fuel" for further price movement. The production of this fuel indicates the potential end of the trend. Both volume and indicator calculated in a certain way from price data can be the fuel. The amount of "fuel" can be
VWAP Daily
Anton Polkovnikov
Weighted average price indicator or VWAP. The well-known standard VWAP with the beginning of the day is added with the function of selecting the periodization. It can be calculated both every day and on other periods. Also the indicator allows to exclude the volume from the calculation, which will allow using it on the cryptocurrencies and forex. There is an alert for a VWAP price crossing. There are 1 and 2 standard deviation. Settings: Volume: turning volume on and off in the calculation mecha
Point of Control POC
Anton Polkovnikov
A huge number of traders use the VolumeProfile/MarketProfile analysis method. And I think there is no need to explain such concepts as POC and VAH/VAL. However, the standard VolumeProfile representation has a drawback - we only see the current picture of the market. We see the "convexity" of the volume distribution within the period. But we don't see the main thing - the "migration" of the POC level during the price movement. Our indicator is unique. It is dynamic. The first feature is that the
Non-lagging VOLATILITY indicator A radical modification of the ATR indicator, which corrected all of its shortcomings (the picture shows the difference with ATR). The indicator shows the swing size of the current market movement. Features: does not have a time window period, i.e. any subjective settings non-delayed, the extremums of the indicator always coincide with the extremum of the price (note the picture) is normalized by means of a color solution, i.e. it has the properties of an oscillat
MultiVWAP
Anton Polkovnikov
MultiVWAP A radical reworking of the well-known VWAP, which is in fact a completely new unique tool. It gives you the opportunity to put 5 types of different VWAPs on the chart: Volume - standard VWAP calculated based on volume No volume - no volume in calculations, which allows using the indicator on the charts, for which the broker does not supply volumetric data Volatility - new development, the calculation is based on unsteady volatility Buyer - VWAP calculation is based on current market bu
Seconds time frame In MT5 there are no second charts by default. Many of the presented options for creating such do not work fully - errors with extrema, inability to use indicators, etc. I present you a fully working variant. The script works as an Expert Advisor by creating a custom symbol. To work, the script is placed on the M1 chart of the instrument of interest, after which the window of the custom symbol will open automatically. The settings are minimal and intuitive - the timeframe inter
POC Auto
Anton Polkovnikov
Auto Point of Control Indicator for those who use the Market/Volume Profile in their trading, who are familiar with the concepts of POC and VAH/VAL. I often noticed that it is inconvenient to change the zone of POC level calculation. Also it is not always convenient to use periodic areas, such as Day, Hour, etc. So I decided to develop a fully automated POC, where the zones change each other through the algorithm in the script. How to use POC - everyone decides for himself. They can be stop-loss
Cumulative Delta NG
Anton Polkovnikov
Cumulative delta indicator As most traders believe, the price moves under the pressure of market buying or selling. When someone redeems an offer standing in the cup, the deal is a "buy". If someone pours into the bid standing in the cup - the deal goes with the direction of "sale". The delta is the difference between purchases and sales. A cumulative delta - the difference between the cumulative sum of purchases and sales for a certain period of time. It allows you to see who is currently contr
Pullback Hunter
Anton Polkovnikov
PULLBACK HUNTER (回调猎手) 每个交易员的终极梦想是什么?要毫不迟疑地看到反转将在哪里发生。当然,这也是一种魔法,虽然... 没有什么是不可能的。但与此同时,我为你准备了一个指标,它可以实时标记当前运动的修正结束,或者简而言之,它可以捕捉到反转的情况。什么是主旨?许多人在价格向开仓方向移动时练习反弹。他们在新极点的形成过程中这样做。一切都很好,但在这种情况下,头寸的加权平均价格并不理想。但如果我们等待回调并在趋势中买入,我们将获得一个良好的平均价格。这个指标显示了矫正运动可能结束的地方。 什么是重要的?不建议 "正面 "使用指示器。也就是说,在向上的箭头上买入,等待向下的箭头来关闭购买。指标的最佳用途是设定一个位置。通过这个额外的工具,你可以过滤你的方向,并在箭头上买入(或做空)被过滤的方向。例如,你使用累积三角洲。它向你展示了整个市场的购买情况。你等待上升的箭头,然后买入。使用额外的分析工具来退出头寸。 该指标的原理是什么?箭头是价格测试支撑或阻力水平的地方。这些水平是由指标内部的算法计算出来的。一个相同的蜡烛图可能同时测试几个支撑位。这可以通过箭头的颜色看出。如果烛
筛选:
无评论
回复评论