
Kinetic Compression Index
- Göstergeler
- Sürüm: 1.0

KCI (Kinetic Compression Index)
Advanced Volatility-Distance Engine & Probability Dashboard.
The KCI Custom Oscillator is not your typical price tracking tool. It is a quantitative analytical engine that dissects the market using pure kinematics principles. Instead of simply tracking where the price moves, KCI measures how it moves—calculating velocity, energy dispersion, and trajectory efficiency using dynamic Z-Score normalization.
The result is a polarized oscillator that precisely detects when the price is building pressure (compression) and when that pressure is primed to detonate into a new trend.
Core Advantages of the KCI Oscillator
- Pure Kinematics Engine: Calculates the ratio between the "net distance" traveled by the price against its actual "path length." This detects inefficient price movements—a hallmark of the compression phase preceding a volatility explosion.
- Independent Probability Algorithm (Sigmoid Curve): The dashboard does not merely mirror the oscillator values. The Explosion Probability metric is powered by a logistic regression function (Sigmoid) that independently calculates the mathematical probability from 0% to 100% based on raw data anomalies, providing an advanced predictive edge.
- Cognitive Validation System: Capable of distinguishing between false breakouts and genuine energy depletion. The system internally evaluates tick volume and kinetic energy decay to ensure signals are only formed when opposing momentum has truly exhausted its strength.
- Dynamic Visual UI/UX: Equipped with a solid, layered dashboard (isolated Z-order) that delivers instant telemetry. The horizontal level bars and colors respond dynamically to compression intensity, freeing traders from second-guessing momentum strength.
Utilizing Visuals for Accurate Entries
KCI provides highly structured visual signals. To achieve maximum accuracy, traders must combine Zone readings, Dashboard Status, and Sigmoid Probability.
1. Reading Zones and Status (Phase Identification)
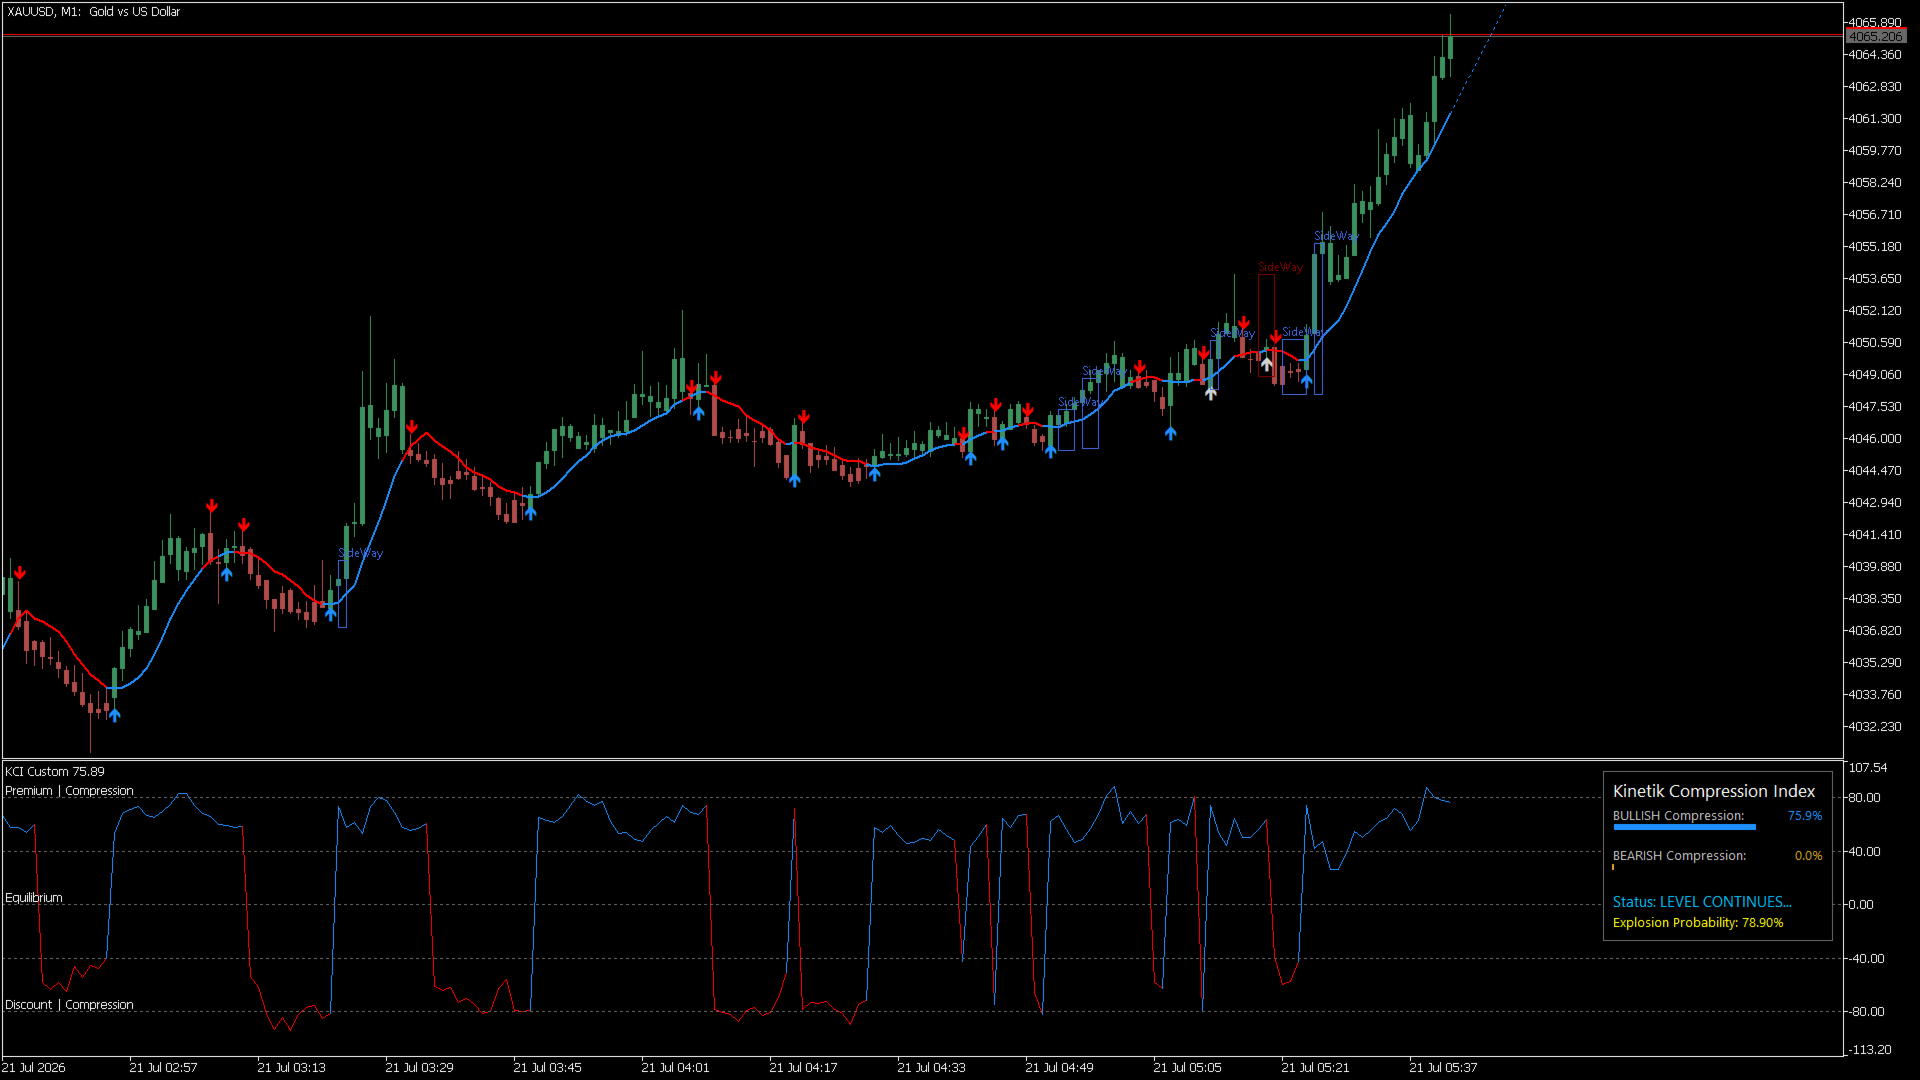
- "WEAK COMPRESSION" Phase (Line in the 0 to ±39 area): The market is choppy or lacks a clear direction. Action: Standby or avoid execution.
- "LEVEL CONTINUES..." Phase (Line in the ±40 to ±79 area): The market is moving swiftly and directionally. Price is moving efficiently without significant counter-pressure. Action: This is not a reversal area. Do not attempt to fade the move. If you are already in a directional position, let your profits run.
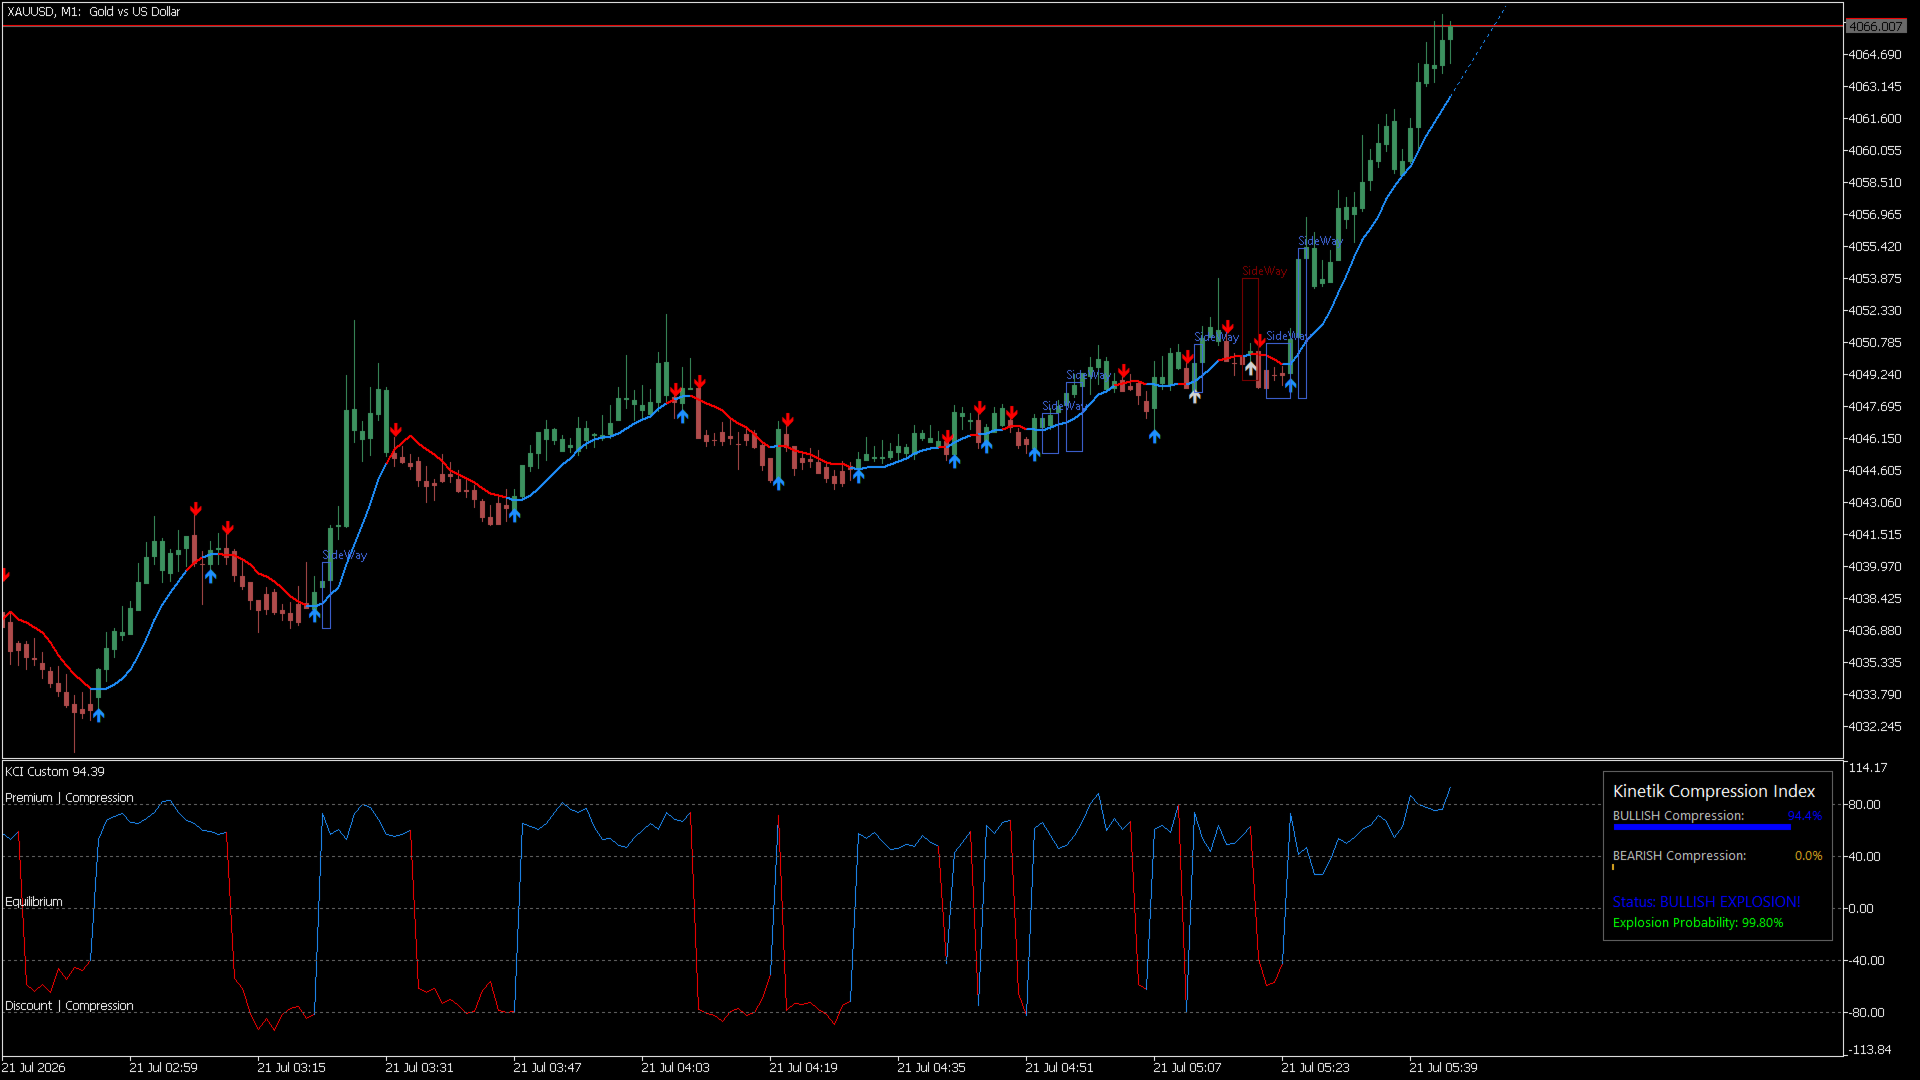
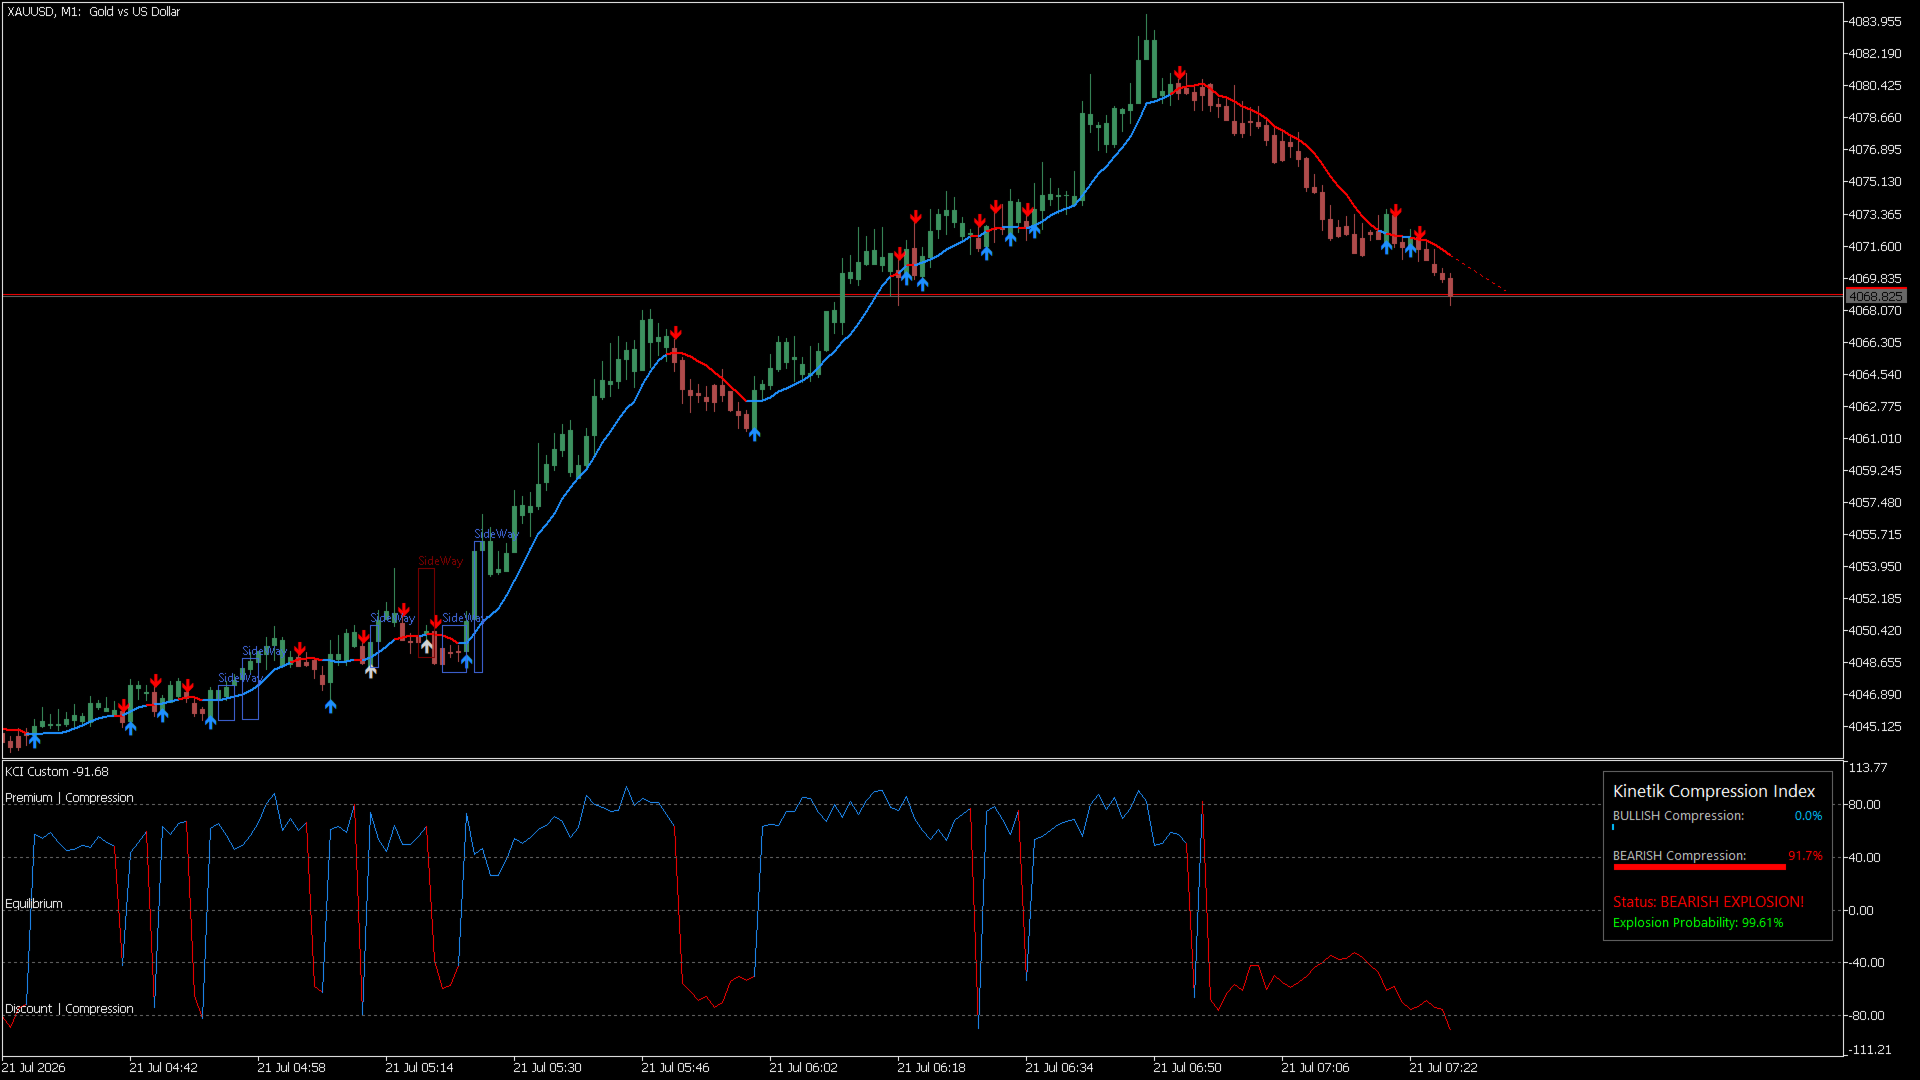
- "EXPLOSION!" Phase (Line breaches Premium +80 or Discount -80 zones): The price has reached the extreme point of kinetic compression. The pent-up energy is massive and ready to rebound forcefully. Action: Prepare for a Reversal Entry setup.
2. Executing Accurate Entries (The Trigger)
A fatal mistake is entering immediately as the line touches the 80 level. Use the following 3-layer confirmation for high-precision accuracy:
BUY Setup (Opportunity from bottom to top):
- Oscillator Line: Must be in the Discount (≤ -80) zone.
- Dashboard Probability: Monitor the Explosion Probability metric. Wait until this number surges above 80.0% (Text changes to Bright Lime). This indicates the mathematical probability for an explosion is ripe.
- Visual Trigger: Do not enter while the line is still plunging sharply downward. Wait until the tip of the KCI line begins to hook upward (entering Cognitive Validation) or the Bearish compression bar on the dashboard starts to shrink.
SELL Setup (Opportunity from top to bottom):
- Oscillator Line: Must be in the Premium (≥ +80) zone.
- Dashboard Probability: The Explosion Probability number on the dashboard must show > 80.0% (Color changes to Bright Lime).
- Visual Trigger: Wait until the price exhausts its kinetic thrust—indicated by the KCI line beginning to hook downward, or the color intensity of the compression level on the dashboard starting to fade from its peak.
Pro Execution Tip:
KCI is most lethal when the Sigmoid probability is above 90%, combined with the tip of the oscillator line suddenly making a sharp turn away from the extreme level. That is the visual proof that the Cognitive Validation Engine has detected a drop in opposing energy, and a kinetic explosion in the opposite direction is underway.
































































Kullanıcı değerlendirmeye herhangi bir yorum bırakmadı
De nada, espero que isso seja útil.