ZIVA Risk Split Manager

ZIVA Risk Split Manager — Advanced Position Scaling

Scaling into a position can be a powerful way to build trades around a defined zone, but calculating the correct lot size across multiple entry levels manually can be slow, inconsistent, and exposed to execution mistakes.

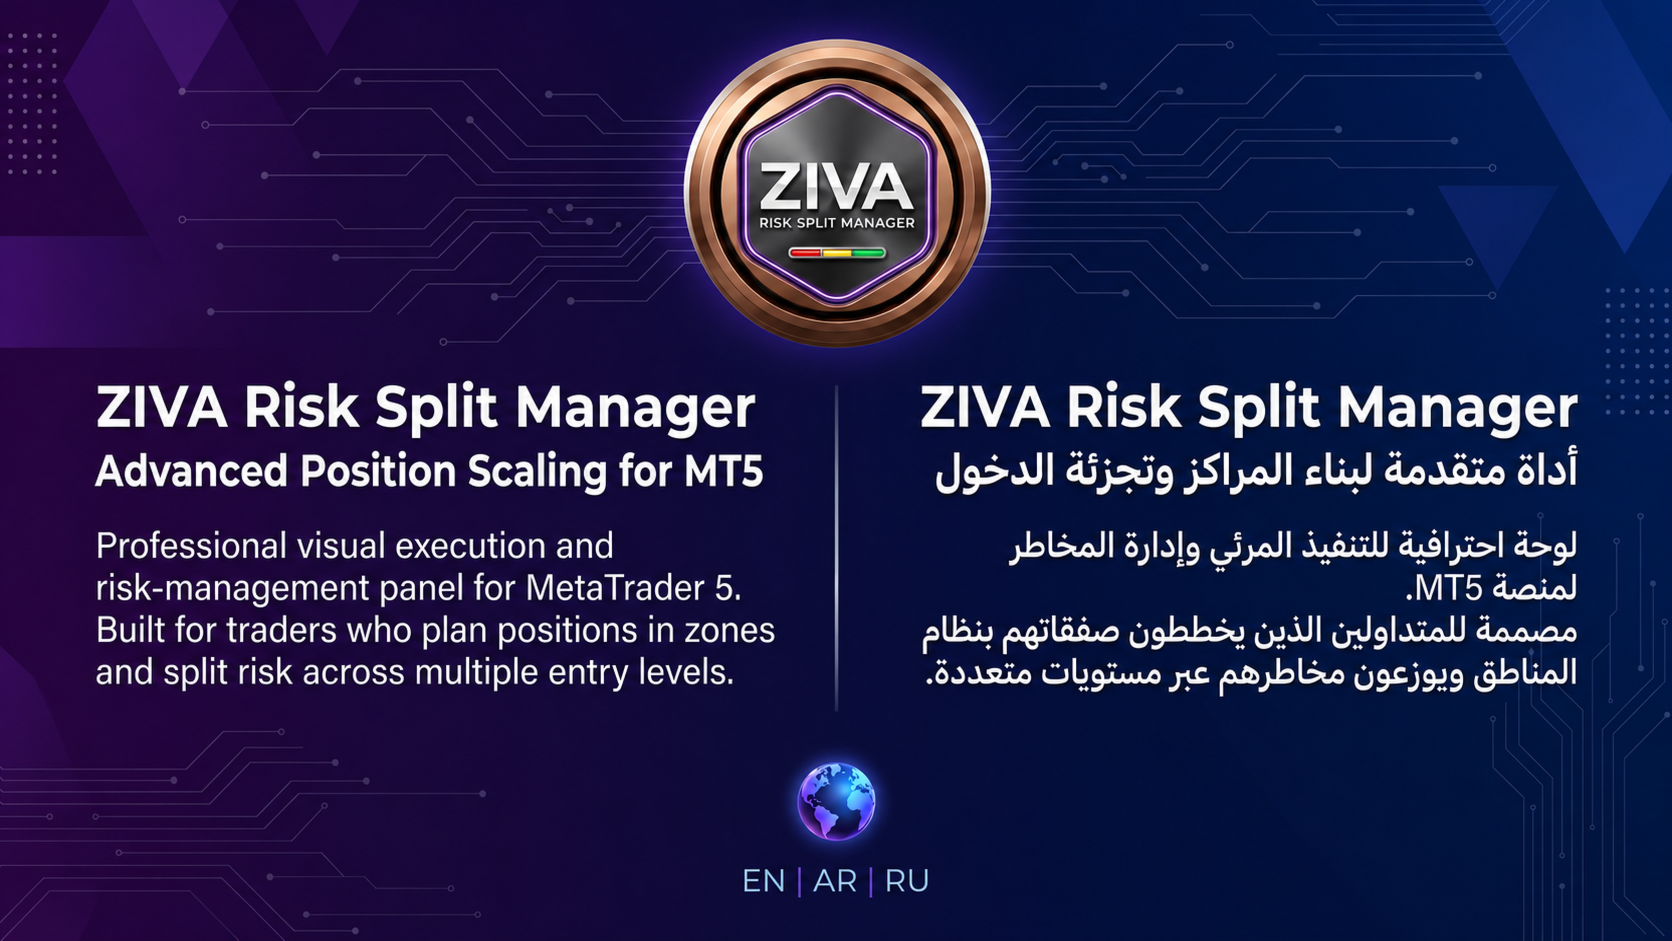
ZIVA Risk Split Manager is a professional visual execution and risk-management panel for MetaTrader 5. It is built for traders who plan positions in zones, split risk across multiple entry levels, and want the full structure calculated directly from the chart before execution.

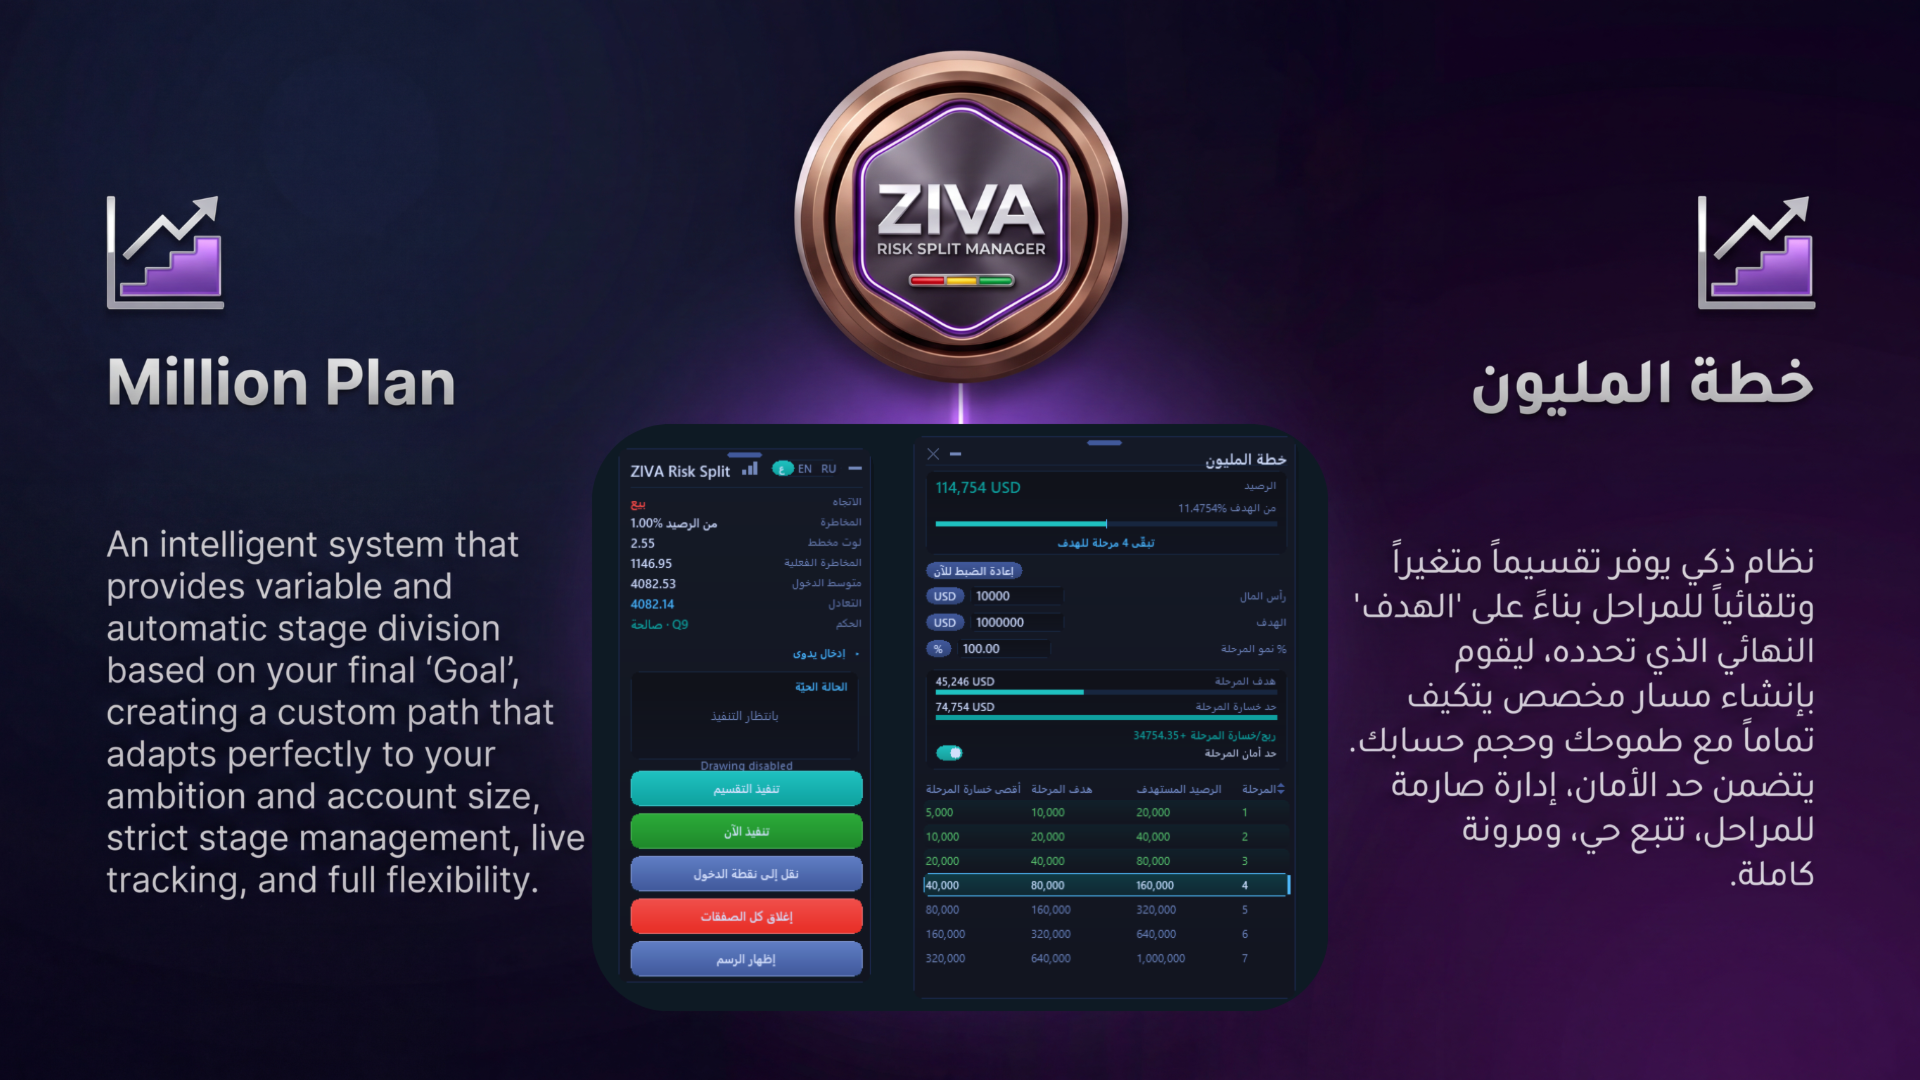
Define your entry zone, place the Stop Loss, choose your risk model, and the utility builds a complete risk-split plan with calculated lot allocation, average entry, breakeven level, risk/reward projection, and execution controls.

No spreadsheets. No manual lot guessing. No disconnected calculations while the market is moving. You define the trade structure; ZIVA calculates the execution plan.

Key Features

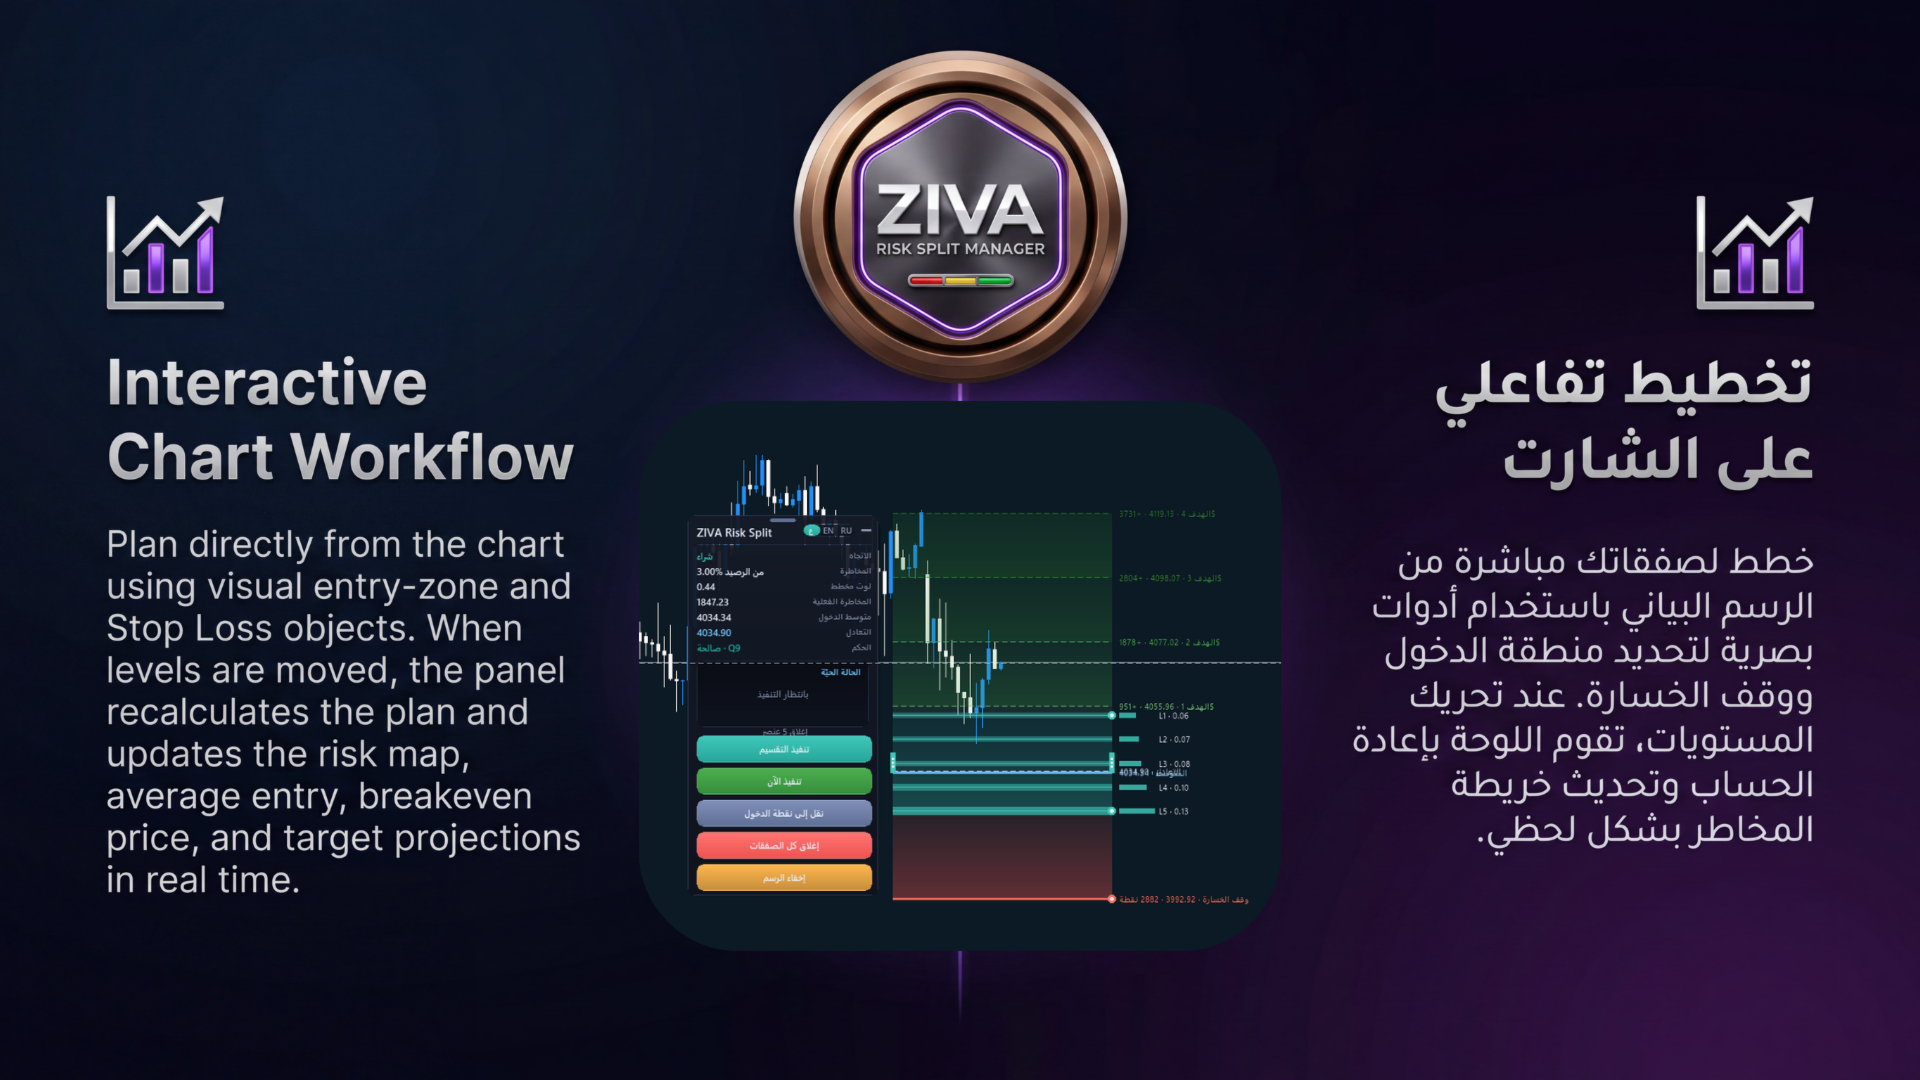
  • Interactive Chart Workflow: Plan directly from the chart using visual entry-zone and Stop Loss objects. When the levels are moved, the panel recalculates the plan and updates the risk map, average entry, breakeven price, and target projections in real time.

  • Risk-Split Lot Planning: Split your total risk across multiple planned entry levels with support for fixed cash risk, balance percentage, or equity percentage.

  • Broker-Aware Calculation: The calculation engine uses live symbol specifications from the terminal, including tick size, tick value, volume step, minimum lot, maximum lot, spread, and broker stop-level restrictions.

  • Automatic Direction Detection: The planned direction is detected from the relationship between the entry zone and the Stop Loss level. This keeps the workflow clean and removes unnecessary manual switching.

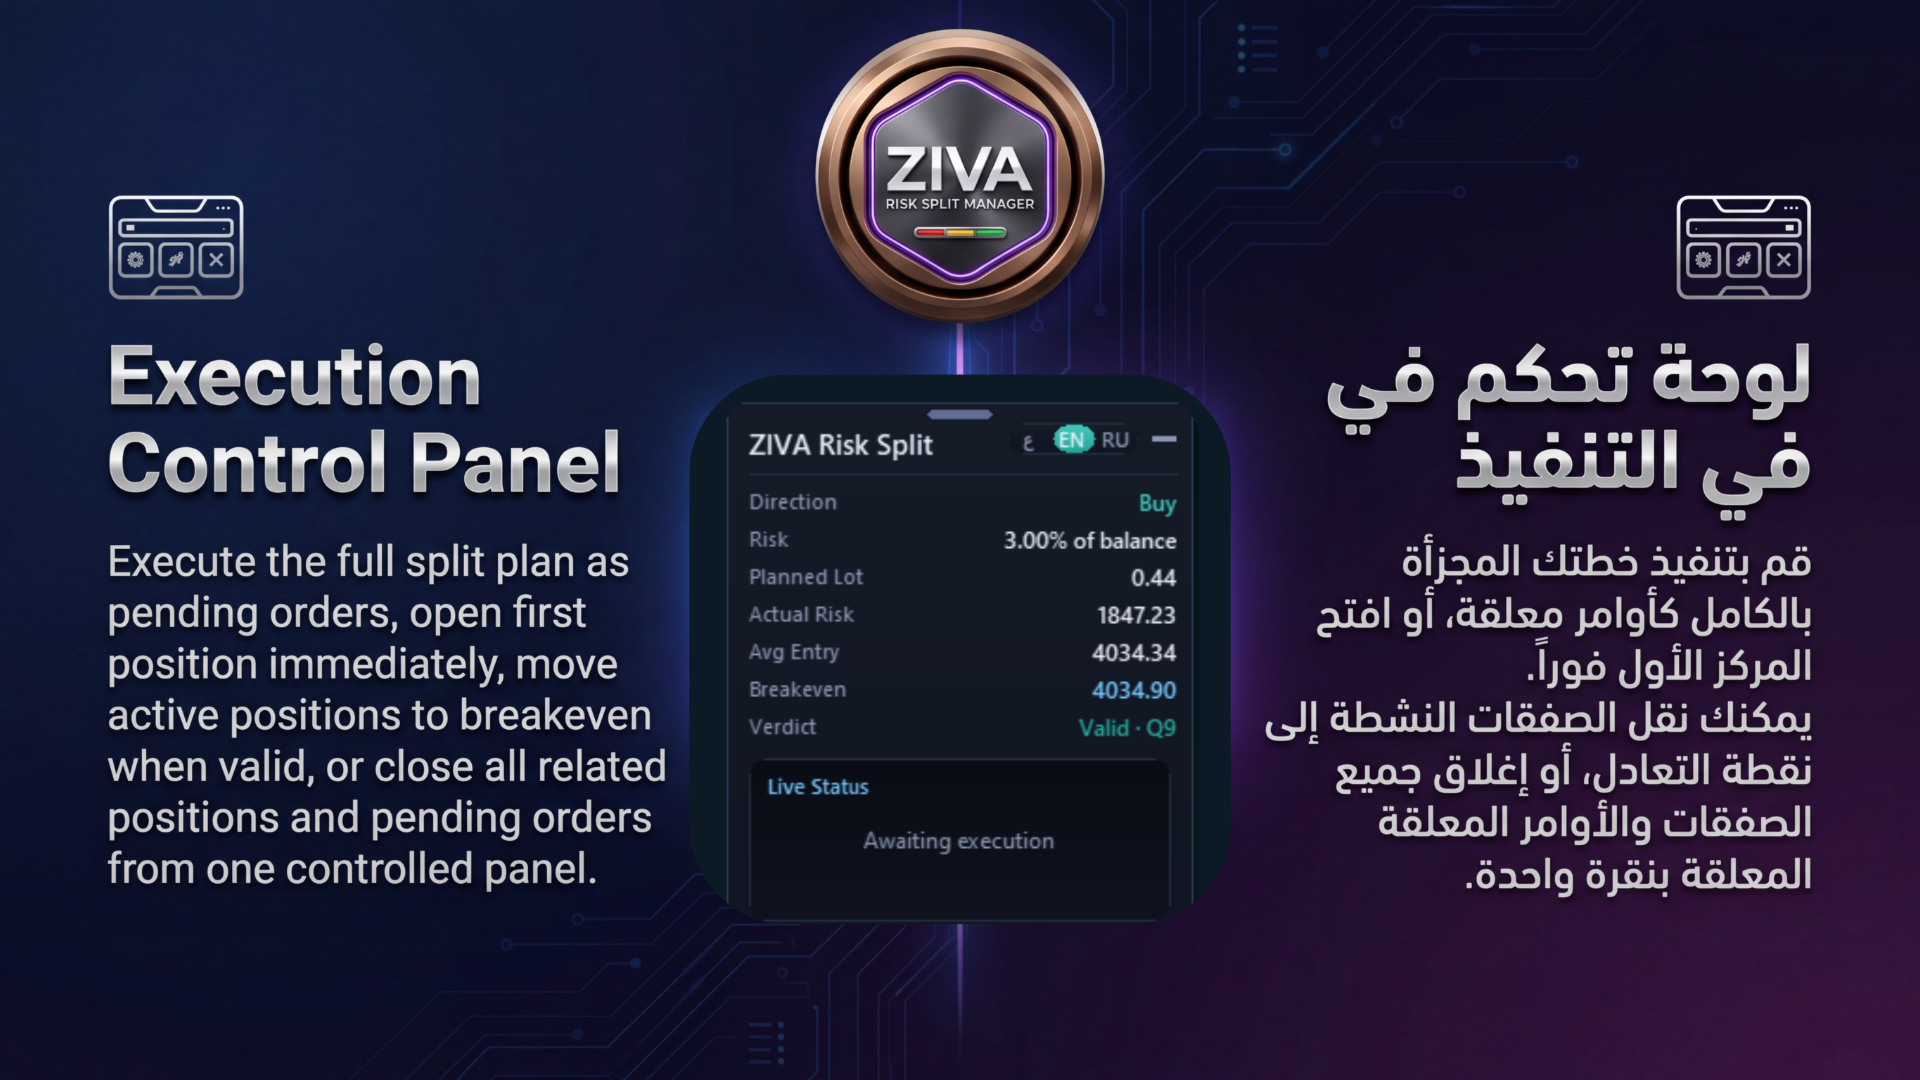
  • Execution Control Panel: Execute the full split plan as pending orders, open the first position immediately, move active positions to breakeven when valid, or close all related positions and pending orders from one controlled panel.

  • Live Position Tracking: Track filled volume, pending levels, weighted average entry, floating result, breakeven status, and reached target levels during the life of the plan.

  • Clean Multi-Language UI: The panel supports English, Arabic, and Russian, keeping input settings simple and focused.

 Who Is It For?

ZIVA Risk Split Manager is designed for manual traders who trade Gold, indices, forex, crypto CFDs, commodities, or other MT5 symbols and prefer structured zone-based entries instead of risking the entire position on one single entry price.

It is especially useful for traders who want to:

  • Build positions across multiple levels

  • Control risk before execution

  • Calculate lot distribution accurately

  • Manage entries visually from the chart

  • Reduce manual calculation errors

  • Keep execution disciplined and organized

 Important Notice

ZIVA Risk Split Manager is a risk-management and execution utility only. It does not generate buy or sell signals, does not predict market direction, and does not guarantee trading results. The user defines the trading setup; ZIVA provides the structured calculation and execution control.
推荐产品
Trade Manger
Israr Hussain Shah
Here   our more valuable tools SMC Trend Trading   ,  Easy SMC Trading  ,  Institutional SMC Architect Volume Analysis Tools  ,  Volume flow Profile  ,  Market volume profile  , FVG with Volume  , Liquidity Heatmap Profile  ,  Volume Spread Analysis You Give an Instruction: When you run the script, a window pops up with a dropdown menu. You choose exactly what you want it to do from the list (e.g., "Close Profit Only" or "Delete Pending Orders"). It Scans Your Positions: The script then reads
Volume flow Profile
Israr Hussain Shah
大师版是一款专业级的分析工具,旨在通过成交量和资金流向的视角来可视化市场结构。与标准的成交量指标不同,该工具直接在图表上显示每日成交量分布,让您准确看到价格发现发生的位置以及“聪明钱”的定位。 此大师版专为清晰度和速度而设计,具有独特的自动主题同步系统,加载后即刻美化您的图表布局。 主要特点: 真实资金流向计算: 超越标准的跳动量。启用“Use Money Flow”时,成交量按价格加权,揭示了特定价格水平的实际资金投入。 价值区域 (VA) 可视化: 自动计算价值区域(默认为成交量的70%)。 VA填充: 为价值区域背景着色,以便即时识别控制区域。 关键水平: 清晰标记控制点 (POC)、价值区域高点 (VAH) 和价值区域低点 (VAL)。 专业标记系统: 扫描概况结构以识别关键交易区域: HVN (高成交量节点): 接受和盘整区域(支撑/阻力)。 LVN (低成交量节点): 拒绝区域或“快速通过”区域。 所有标记均向右绘制延长线,便于监控。 Delta 背离(左侧直方图): 左侧直方图可视化每个级别的买卖压力对比。这有助于识别隐藏的背离——即价格可能上涨,但卖家在这些水平上激进打
Blahtech Market Profile MT5
Blahtech Limited
5 (10)
Was: $249  Now: $99   Market Profile defines a number of day types that can help the trader to determine market behaviour. A key feature is the Value Area, representing the range of price action where 70% of trading took place. Understanding the Value Area can give traders valuable insight into market direction and establish the higher odds trade. It is an excellent addition to any system you may be using. Inspired by Jim Dalton’s book “Mind Over Markets”, this indicator is designed to suit the
Volume Profile Utility
AL MOOSAWI ABDULLAH JAFFER BAQER
Volume Profile Discover where the market really trades. Make decisions based on volume, not guesswork. Volume Profile is a professional MetaTrader utility that analyzes trading activity across different price levels, allowing traders to identify where the highest concentration of market participation has occurred. Instead of focusing only on price movement over time, Volume Profile reveals the price levels where buyers and sellers have been most active, providing valuable insight into market str
Binary Rise Fall
Israr Hussain Shah
Here   our more valuable tools SMC Trend Trading   ,  Easy SMC Trading  ,  Institutional SMC Architect Volume Analysis Tools  ,  Volume flow Profile  ,  Market volume profile  , FVG with Volume  , Liquidity Heatmap Profile  ,  Volume Spread Analysis The Fractals_Price indicator is a technical analysis tool that identifies fractal patterns on price charts. Fractals are recurring patterns that signal potential trend reversals or continuation points. This indicator marks both upward and downward
Bastion is a monitor-and-close-only risk manager for prop-firm traders. It watches your account against your firm's daily-loss and maximum-drawdown limits in real time and force-closes your open positions BEFORE you cross a line. It never opens a trade of its own, so it stays fully within the tools allowed by FTMO, FundedNext, The5ers, FTUK and FXIFY. Why traders fail challenges A large share of failed evaluations end on a single daily-loss breach: a moment of inattention, a news spike, one tra
Here   our more valuable tools SMC Trend Trading   ,  Easy SMC Trading  ,  Institutional SMC Architect Volume Analysis Tools  ,  Volume flow Profile  ,  Market volume profile  , FVG with Volume  , Liquidity Heatmap Profile  ,  Volume Spread Analysis The    Liquidity Heatmap   is a sophisticated institutional trading tool designed to reveal where over-leveraged traders are trapped. By calculating estimated liquidation levels based on volume spikes and leverage, this indicator draws a dynamic "h
该指标建立当前报价,可以与历史报价进行比较,并在此基础上进行价格走势预测。指示器有一个文本字段,用于快速导航到所需日期。 选项: 符号 - 选择指标将显示的符号; SymbolPeriod - 选择指标从中获取数据的时段; IndicatorColor - 指示器颜色; HorisontalShift - 由指标绘制的报价移动指定的柱数; Inverse - true 反转引号,false - 原始视图; ChartVerticalShiftStep - 图表垂直移动(键盘上的向上/向下箭头); 接下来是文本字段的设置,您可以在其中输入日期,您可以通过按“回车”立即跳转到该日期。 接下来是文本字段的设置,您可以在其中输入日期,您可以通过按“回车”立即跳转到该日期。
Advanced Volume Profile Analysis Tool for MetaTrader 5 The Kecia Volume Profile Order Finder provides traders with volume profile analysis capabilities. This MT5 indicator combines volume profile visualization with statistical calculations to help identify potential trading opportunities and suggests entry, stop loss, and take profit levels based on market structure. Market Profile Visualization Transform your chart with customizable volume profile visualizations: Multiple visualization options
Cumulative Volume Delta MA-X MTF(带梯度动量) 该指标为 MetaTrader 5 提供多时区累积成交量德尔塔(CVD)分析。它通过分析报价成交量(Tick Volume)或真实成交量(Real Volume)数据,计算买盘与卖盘压力之间的净差值,从而直观地展示订单流(Order Flow)情绪。 指标逻辑与特性 本指标采用数学方法进行成交量分析: 数据来源 :支持交易所资产的 真实成交量 (Real Volume) ,以及针对外汇/CFD 市场的 OHLC 影线代理算法 (OHLC Wick Proxy) 。 梯度系统 :4 色移动平均线用于识别趋势阶段: 深天蓝 (DeepSkyBlue) :数值为正且正在上升。 橙色 (Orange) :数值为正但正在下降。 洋红色 (Magenta) :数值为负且正在下降。 紫色 (Purple) :数值为负但正在上升。 五层共振系统 (5-Layer Confluence System) 指标集成了五种不同的分析方法: 第一层:成交量德尔塔核心 (Volume Delta Core) —— 计算成交量德尔塔的
Here   our more valuable tools SMC Trend Trading   ,  Easy SMC Trading  ,  Institutional SMC Architect Volume Analysis Tools  ,  Volume flow Profile  ,  Market volume profile  , FVG with Volume  , Liquidity Heatmap Profile  ,  Volume Spread Analysis Key Features 1.  Total Immersion UI (The "Blackout") Chart Masking:   Upon loading, the tool turns the background, grid, and candles pitch black. This hides the noise of the market ticks, allowing you to focus purely on your performance data withou
Trading Utility for Forex Currency Pairs Only not for Gold  Functions Auto Lot Calculation based on Risk Auto stoploss  Auto TakeProfit Breakeven Auto Close Half % Close in percentage with respect to the PIPs Pending Orders BuyLimit Sell Limit with distances BuyStop Sell Stop    with distances Trading Informations Risk in percentage For Multiple trades Combine Takeprofit and Combine Stoplosses
PriceMagnet Volume Profile Stop guessing where the smart money is sitting. See it. PriceMagnet Volume Profile is a precision volume-analysis indicator built for MetaTrader 5 traders who want to trade with institutional context instead of guesswork. Rather than plotting volume as a flat bar under your chart, PriceMagnet reconstructs a full horizontal volume histogram directly on price — showing you exactly which price levels attracted the most trading activity over your selected lookback window,
FREE
Here   our more valuable tools SMC Trend Trading   ,  Easy SMC Trading  ,  Institutional SMC Architect Volume Analysis Tools  ,  Volume flow Profile  ,  Market volume profile  , FVG with Volume  , Liquidity Heatmap Profile  ,  Volume Spread Analysis Transform Your Trading with Intelligent Market Insights! The 2025 Spike Killer Dashboard is a powerful MQL5 indicator that combines cutting-edge signal generation with an intuitive crystal dashboard for real-time market analysis. Designed for tra
Arrow Micro Scalper 是一款专为剥头皮和短期交易而设计的指标,可集成到任何图表和金融工具(货币、加密货币、股票、金属)中。 在她的工作中,她使用波浪分析和趋势方向过滤器。建议在从 M1 到 H4 的时间范围内使用。 如何使用指标。 该指标包含 2 个用于更改设置的外部参数,其余参数已默认配置。 大箭头表示趋势方向的变化,蓝色箭头表示下降趋势的开始,粉红色箭头表示上升趋势的开始。 “ Only trending direction ”参数启用和禁用使用内部趋势的模式,提供使用您自己的趋势或不使用趋势的机会,并且还启用/禁用仅根据趋势显示趋势箭头和信号箭头。 小信号箭头,该指标最重要的对象,粉色代表“买入”交易,蓝色代表“卖出”交易。 “ Smoothing ”参数决定信号箭头出现的时间,操作范围为 7 到 25,为时间范围 M1-M5 选择大值,为 M15-H1 选择中值,为 H4 - D1 选择小值。 趋势箭头和开始信号箭头有警报。 指标不会重新绘制。
Smart DOM Tick Flow
Konstantin Chechnev
Smart DOM Tick Flow 是一款自主研发的日内交易指标,集自适应 SmartDOM、Tick Flow 分析、价格运动的频谱评估、市场活跃度价位以及多层交易信号确认于一体。 指标的核心是 SmartDOM:一张动态展示价格平衡变化与各价位活跃度分布的地图。 它不仅帮助观察价格运动方向,还能揭示当前市场竞价过程的内部结构:参与力量集中在哪里、运动阻力在哪里形成、活跃中心向何处迁移,以及当前买方或卖方压力是否稳定。指标将市场视为一个整体系统,价格、tick、成交量、运动速度、关键价位反应和动量质量必须相互确认。 SmartDOM — 智能市场深度模型 SmartDOM 不局限于经纪商提供的有限订单,而是将标准化的 Bid、Ask 和 Last 逐笔数据分配到自适应价位上,同时考虑可用成交量,并根据价格变化特征判定每个 tick 的方向。在此基础上,系统计算最大活跃度价位、价值区上边界与下边界、买卖双方 Delta、连续失衡序列、吸收迹象、失败拍卖、轮廓边界反应、活跃中心迁移,以及所形成结构的最终质量评估。 SmartDOM 采用交易所订单簿的视觉逻辑,但承担的是不同的分
Smart Imbalance Edge
Aleksandr Poluchin
Smart Imbalance Edge: Decode Institutional Footprints and Market Momentum The market doesn't move randomly. Its direction and structural shifts are driven by major players—institutional capital, banks, and hedge funds. Smart Imbalance Edge is an advanced, analytical MetaTrader 5 tool designed to help you spot these institutional footprints and measure the true force behind their actions. This isn't just another standard "ZigZag" indicator that blindly connects highs and lows. This algorithm sc
CoPilot dashboard MT5
Frederic Jacques Collomb
CoPilot — 每日交易仪表板 掌握你的数据。清晰地交易。 MT4 版本 什么是 CoPilot? CoPilot 是一款 专业级 交易助手,可将您每日的交易绩效统计数据 实时 显示在图表上——配备 实时权益曲线 ,逐笔更新。专为需要在不离开图表的情况下即时了解交易状态的活跃交易者而设计,CoPilot 汇总 当日所有交易品种的每笔已平仓交易 ,并以简洁、色码化的交互面板呈现。 无需再切换到终端历史选项卡,无需手动计算。CoPilot 就像您的 副驾驶 ——时刻守候,持续计算,始终在您眼前。 实时统计面板 CoPilot 显示完整的每日绩效指标,分为三个部分: 活动 — 今日总交易数、已平仓交易、持仓数量、盈利/亏损笔数、 胜率 (%) 及保本交易。胜率颜色动态调整:高于 50% 显示绿色,低于 50% 显示红色。 盈亏 — 净盈亏 、 盈利因子 、每笔平均盈利和平均亏损、 平均风险回报比 、当日最佳交易和最差交易。每个数值根据其含义以绿色或红色显示。 时间与点数 — 平均持仓时间、最短和最长持仓时间、所有交易品种累计 总点数 ,以及 最大连续盈利/亏损次数 。 所有统计数据均基于
Risk Control Tool
Israr Hussain Shah
Here   our more valuable tools SMC Trend Trading   ,  Easy SMC Trading  ,  Institutional SMC Architect Volume Analysis Tools  ,  Volume flow Profile  ,  Market volume profile  , FVG with Volume  , Liquidity Heatmap Profile  ,  Volume Spread Analysis Overview (Short Description) A professional risk management indicator that helps traders calculate lot size, risk percentage, and reward ratio in real time. Perfect for Forex, Indices, Gold, and Synthetic Indices traders who want precise control ov
Liquidity HeatMap Profile
Israr Hussain Shah
5 (1)
Here   our more valuable tools SMC Trend Trading   ,  Easy SMC Trading  ,  Institutional SMC Architect Volume Analysis Tools  ,  Volume flow Profile  ,  Market volume profile  , FVG with Volume  , Liquidity Heatmap Profile  ,  Volume Spread Analysis 2. Key Features Dynamic Filtering : The core feature. As soon as the current price crosses a historical liquidity level, that level disappears. This reduces chart clutter and prevents you from trading off "dead" support/resistance. Liquidity Heatma
Here   our more valuable tools SMC Trend Trading   ,  Easy SMC Trading  ,  Institutional SMC Architect Volume Analysis Tools  ,  Volume flow Profile  ,  Market volume profile  , FVG with Volume  , Liquidity Heatmap Profile  ,  Volume Spread Analysis   is a high-performance MT5 indicator engineered specifically for the Deriv synthetic indices market. Unlike standard indicators that lag, this tool uses a   Zero-Lag Persistent Level   algorithm to detect institutional support and resistance zones
Before installing the HeatMap indicator make sure you are using a broker that gives you access to the Depth of market (DOM) !! This indicator creates a heatmap on your chart allowing you to see the buy or sell limit orders easily and in real time. You have the possibility to change the setting and the colors of the HeatMap in order to adapt to all markets and all charts. Here is an example of a setting you can use with the NASDAQ100 on the AMPGlobal broker :  https://www.youtube.com/watch?v=x0Y
Volume Profile V6
Andrey Kolesnik
4.8 (5)
市场成交量分布(Volume Profile)指标 + 智能震荡器(Smart Oscillator)。适用于几乎所有交易品种——外汇、股票、期货、加密货币,支持真实成交量和Tick成交量。可以自动设置分析区间(例如一周、一个月等),也可以通过移动两条边界线(红色和蓝色两条垂直线)手动设置区间。指标以直方图形式显示。在某一价格水平上,直方图的宽度表示该价位的成交活跃程度(成交次数)。参数“Mode level line color”可用于自动显示最重要的成交量水平,这些位置价格有较大概率发生反应;参数“Maximum color (POC)”则单独标记整个区间内成交量最大的价格水平。 智能震荡器用于显示超买和超卖区域。它通过分析多个指标的数据,并基于处理后的信息,用不同颜色标识超买和超卖区域。 在 Volume every day 模块中,可以通过 Range period 参数设置构建成交量分布的时间周期,通过 Range count 参数设置区间数量。例如:Range period=1Day,Range count=10,表示指标将构建最近10天的日内成交量分布。需要注意的是,切换
Noize Absorption Index
Ekaterina Saltykova
Noize Absorption Index - is the manual trading system that measures the difference of pressure between bears forces and bulls forces. Green line - is a noize free index that showing curent situation. Zero value of index shows totally choppy/flat market.Values above zero level shows how powerfull bullish wave is and values below zero measures bearish forces.Up arrow appears on bearish market when it's ready to reverse, dn arrow appears on weak bullish market, as a result of reverse expectation.
What if you could finally SEE where the market really wants to go? Most traders watch price. Pros watch VOLUME — where the money was actually traded. Volume Profile Fibo Confluence puts that reading right in front of you, in plain language, no jargon. WHAT YOU SEE ON YOUR CHART • The POC, the most-traded price: the market's natural magnet • The value area (VAH / VAL): the "house" where price spends its time • Automatic Fibonacci retracement + the golden pocket • Low-volume nodes
"Impulses and Corrections 5" is created to help traders navigate the market situation. The indicator shows multi-time frame upward and downward "Impulses" of price movements. These impulses are the basis for determining the "Base" , which is composed of zones of corrections of price movements, as well as "Potential" zones for possible scenarios of price movement. Up and down impulses are determined based on a modified formula of Bill Williams' "Fractals" indicator. The last impulse is always "U
交易控制台:使您的交易体验更舒适 该应用无法在策略测试器中进行测试。 请从以下链接获取演示版本并进行测试。 Download DEMO ver. 这是用于演示帐户的。 1. 交易期间的功能: (1) 经济指标的显示和通知: 在经济指标发布前几分钟收到警报、推送通知和电子邮件。 在警报期间屏幕会闪烁,易于注意。 根据货币、关键词和指标重要性自定义通知。 指标按重要性进行颜色编码。 (2) 可视化的TP/SL订单: 在下单时以点数、pips和货币金额估算盈亏。 使用鼠标操作指定TP和SL值,可选择“固定RR值”或“单独更改”选项。 仅下TP、仅下SL或同时下单的选项。 支持市价订单(自动模式)、指定的止损订单和限价订单(手动模式)。 轻松修改多个仓位的TP和SL,显示盈亏估算。 (3) 自动手数(交易量)计算: 根据指定的保证金维持率计算最大手数。 以计算出的最大手数的分数或百分比计算单笔订单的手数。 也可以根据所需的保证金金额计算手数。 (4) 移动止损 (5) 止盈平仓: 通过添加指定的点数、pips或金额,在止盈值时接收通知或平仓。 (6) 结算时的批量操作: 无需等待服务器响应,
TradeAQ
Guo Sheng Zhao
这个量价结构指标是一款适用于   MetaTrader 4 和 MetaTrader 5   的图表分析指标,集量价结构、成交量分布、市场情绪、波动提示和关键价格区域展示于一体。指标直接运行在主图窗口,可帮助交易者快速观察市场的重要价格位置与活跃程度。 主要功能 1. 量价结构支撑与阻力 自动标记连续量价结构形成的潜在支撑位和阻力位,辅助识别价格可能出现停顿、反应或突破的位置。 支持两种分析模式: 成交量结构 价格结构 线条颜色、宽度和样式均可自定义。 2. 成交量尖峰提示 当市场成交量显著放大时,在图表中显示醒目标记,帮助发现异常活跃、加速、衰竭或可能发生方向变化的行情。 可选功能包括: 尖峰图标提示 尖峰价格水平线 高点、低点、收盘价或组合价位显示 自定义成交量阈值 3. 高波动行情提示 自动标记波动明显扩张的 K 线,方便交易者及时发现突破、加速和快速行情。 支持: 高波动图标 关键价格水平线 自定义检测周期与敏感度 自定义线条颜色、宽度和样式 4. 成交量分布 在图表右侧显示指定范围内的成交量分布,直观呈现不同价格区域的交易活跃程度。 主要显示内容包括: 高成交量节点 低成交量
NRP Risk Manager Pro Institutional-Grade Trade Management & Prop Firm Protection Get the MetaTrader 4 Version Here: https://www.mql5.com/en/market/product/179888 Get the MetaTrader 5 Version Here: https://www.mql5.com/en/market/product/179885 Trading isn't just about finding the right entry; it is about flawlessly executing your edge while fiercely protecting your capital. NRP Risk Manager Pro is not an automated trading robot—it is a comprehensive, institutional-grade trade terminal d
该产品的买家也购买
Trade Assistant MT5
Evgeniy Kravchenko
4.41 (216)
它有助于计算每笔交易的风险,容易安装新的订单,具有部分关闭功能的订单管理, 7 种类型的追踪止损和其他有用的功能。   附加材料和说明 安装说明   -   应用程序说明   -   模拟账户应用程序的试用版 线条功能  - 在图表上显示开仓线、止损线、止盈线。 有了这个功能,就可以很容易地设置一个新的订单,并在开仓前看到它的附加特性。   风险管理  - 风险计算功能在考虑到设定的风险和止损单的大小的情况下,计算新订单的成交量。它允许你设置任何大小的止损,同时观察设定的风险。 批量计算按钮 - 启用 / 禁用风险计算。 在 " 风险 " 一栏中设置必要的风险值,从 0 到 100 的百分比或存款的货币。 在 " 设置 " 选项卡上选择风险计算的变量: $ 货币, % 余额, % 资产, % 自由保证金, % 自定义, %AB 前一天, %AB 前一周, %AB 前一个月。   R/TP 和 R/SL - 设置止盈和止损的关系。 这允许你设置相对于损失的利润大小。 例如, 1 : 1 - 这决定了 TP = SL 的大小。 2 : 1 - 这意味着 TP 是 SL 的两倍。 RR -
欢迎来到 Trade Manager EA——这是一个终极风险管理工具,旨在使交易变得更直观、精准和高效。它不仅仅是一个下单工具,而是一个用于无缝交易计划、仓位管理和风险控制的全面解决方案。不论您是新手交易员、资深交易员,还是需要快速执行的剥头皮交易员,Trade Manager EA 都可以满足您的需求,适用于外汇、指数、大宗商品、加密货币等各种市场。 借助 Trade Manager EA,复杂的计算已成过去。只需分析市场,在图表上用水平线标记入场、止损和止盈,设置您的风险水平,Trade Manager 就会立即计算出理想的头寸规模,并实时显示以点、账户货币计价的止损和止盈。每笔交易都得以轻松管理。 主要功能: 头寸规模计算器 :根据定义的风险瞬间确定交易规模。 简单的交易计划 :在图表上用可拖动的水平线直接计划交易,设置入场、止损和止盈。 实时显示 SL 和 TP :以账户货币、点或分显示止损和止盈,便于分析。 高级保护工具 盈亏平衡选项 : 基本盈亏平衡 :当您的交易达到设定水平时自动保护利润。 多级盈亏平衡 :设置多达 4 个级别以逐步保护利润。 尾随止损选项 : 基本尾随
================================================================================ POC BREAKOUT - V20.72. Full Professional Grade Toolkit ================================================================================ POC Breakout is a full MetaTrader 5 trading dashboard for discretionary traders who want breakout signals, Point of Control (POC) context, volume profiles, order flow, market structure, news, alerts, and advanced trade planning in one professional workspace. Attached directly to you
TradePanel MT5
Alfiya Fazylova
4.88 (167)
交易面板是一款多功能交易助手。该应用包含超过50种手动交易功能,并允许您自动执行大多数交易任务。 应用程序说明 + 视频教程: https://www.mql5.com/zh/blogs/post/761102 用于模拟账户的应用程序试用版: https://www.mql5.com/zh/blogs/post/762579 如何安装应用程序: https://www.mql5.com/zh/blogs/post/762580 如何在可视化模式下测试应用程序: https://www.mql5.com/zh/blogs/post/770278 如何在VPS MetaTrader上安装应用程序: https://www.mql5.com/zh/blogs/post/770196 贸易. 只需单击一下即可执行交易操作: 打開掛單和頭寸,並自動計算風險。 一鍵打開多個訂單和頭寸。 打開訂單網格。 按組別關閉掛單和頭寸。 反轉頭寸方向(關閉買入>打開賣出,關閉賣出>打開買入)。 鎖定頭寸(通過開啟缺少的頭寸,使買入和賣出頭寸的數量相等)。 一鍵部分關閉所有頭寸。 將所有頭寸的止盈和止損設置在同
测试版发布 Telegram to MT5 Signal Trader 即将进入正式的 Alpha 版本。一些功能仍在开发中,您可能会遇到一些小错误。如果您遇到问题,请反馈,您的意见将帮助我们改进软件。 Telegram to MT5 Signal Trader 是一款强大的工具,能够将 Telegram 频道或群组的交易信号自动复制到您的 MetaTrader 5 账户。 支持公开和私人频道,可将多个信号提供者连接至一个或多个 MT5 账户。软件优化、高效、稳定,精准控制每笔复制交易。 界面简洁,仪表盘美观,图表交互性佳,导航直观。您可以管理多个信号账户,自定义每个提供者的设置,并实时监控所有操作。 系统需求 由于 MQL 限制,EA 需要配合 PC 端应用与 Telegram 通信。 安装程序可通过官方 安装指南 获取。 核心功能 多提供者支持: 从多渠道复制信号至多个 MT5 帐户 高级信号识别: 关键词、模式和标签全面自定义 逐提供者控制: 可启用/禁用特定信号类型、平仓策略等 灵活风险管理: 固定手数、固定金额、余额/权益百分比、部分平仓设置 可定制 SL/TP: 覆盖信号
Premium Trade Manager - 内置交易导师的图表面板 Premium Trade Manager 将一位交易导师嵌入您的图表,并在其下搭载完整的执行引擎。像往常一样建立交易,然后让您的 AI 交易导师 Max 读取这笔具体的交易,结合您的实时账户给出直接判断,再由您决定是否下单:止损是否符合纪律化交易的要求、风险规模是否合理、高影响新闻事件是否即将发布、您是否接近资金盘限额。其下是完整的执行引擎,负责点击之后的一切:一键按风险下单、您在图表上拖动规划且交易进行中仍可随时调整的计划、最多四个分批止盈级别、七种移动止损方式、实时资金盘合规检查、新闻屏蔽保护,以及对自身成本进行评级的点差功能。决策由您做出。Max 给出第二次审视。面板负责此后的一切。 购买前先亲手体验。 直接在浏览器中点击实时面板,这是在购买前感受其工作方式的最快途径。 stein.investments/products/premium-trade-manager Max 是您的一对一 AI 交易导师,他直接内置于面板之中。  他了解您的账户、您的设置和您的规则,用您自己的语言回答,并在每笔交易下单前进
Ultimate Extractor
Clifton Creath
5 (8)
Ultimate Extractor - Professional Trading Analytics for MT5 *****this is the local HTML version of Ultimate Extractor. !!!!!it is not compatible with Cloud!!!! For the online version please reach out to me directly****** Ultimate EA manager also now available when you use cloud pro and above for free!! Ultimate Extractor transforms your MetaTrader 5 trading history into actionable insights with comprehensive analytics, interactive charts, and real-time performance tracking. What It Does Automa
Timeless Charts
Samuel Manoel De Souza
5 (8)
Timeless Charts is an all-in-one trading utility for professional traders. It combines custom chart types such as Seconds Charts and Renko with advanced order flow analysis using Footprints , Clusters , Volume Profiles , VWAP studies, and anchored analysis tools for deeper market insight. Trading and position management are handled directly from the chart through an integrated trade management panel , while Market Replay and Virtual Accounts provide environments for practicing trading skills and
Farmed Hedge Yield Farming | All Markets (Manual - Hybrid - Semi/Automated EA) VERIFIED TRADING RESULTS - Farmed Hedge Yield Axi Copy:  https://www.mql5.com/en/signals/2356376 - Farmed Hedge Yield Exn Copy:   https://www.mql5.com/en/signals/2356404 - Farmed Hedge Yield V Copy:  https://www.mql5.com/en/signals/2357156 * Before purchasing, please feel free to send me a message if you have any questions about the product or setup. ** After purchase,  Contact me via private message to receive t
The product will copy all telegram signal to MT5 ( which you are member) , also it can work as remote copier.  Easy to set up, copy order instant, can work with almost signal formats, image signal,  s upport to translate other language to English Work with all type of channel or group, even channel have "Restrict Saving Content", work with  multi channel, multi MT5 Work as remote copier: with signal have ticket number, it will copy exactly via ticket number. Support to backtest signal. How to s
YuClusters
Yury Kulikov
4.93 (43)
Attention: You can view the program operation in the free version  YuClusters DEMO .  YuClusters is a professional market analysis system. The trader has unique opportunities to analyze the flow of orders, trade volumes, price movements using various charts, profiles, indicators, and graphical objects. YuClusters operates on data based on Time&Sales or ticks information, depending on what is available in the quotes of a financial instrument. YuClusters allows you to build graphs by combining da
Power Candles 策略扫描器——自优化多符号设置查找器 Power Candles策略扫描器 采用与Power Candles指标相同的自优化引擎,可同时扫描您“市场观察”中的所有交易品种。一个面板即可显示当前哪些品种在统计上具备交易价值、每种策略的最佳应用方向、最优止损/止盈组合,并在新信号触发时立即向您发送提醒。 本工具是 Stein Investments 生态系统的一部分 - 18+ 款工具,加上 Max,您的一对一 AI 交易导师。  随时在线,深入了解每一款指标,在您需要梳理思路的那一刻就在那里。  立即认识他: https://stein.investments 您的全面市场监控。每个交易品种超过3,000次自动优化。2种警报类型。一键切换图表并采取行动。 为何您需要此工具 大多数多标的扫描器仅展示价格 波动 。每只股票的波动率、百分比变化、RSI。您仍需自行摸索正确的策略、合适的止损位以及理想的入场阈值。Power Candles策略扫描器针对每只股票自动解答这些问题,仅在数学验证过的交易设置中触发实际入场信号时才会向您发出提示。这就是全部卖点。 自动
EA Overfitter
Stephen J Martret
回测看起来很漂亮。但它明天、下周、下个月还能继续赚钱吗? EA Overfitter 让您的 EA 在 100 段它从未见过的价格历史上重新运行。一个分数告诉您这个优势是否真实。 回测告诉您的,是 EA 在某一段价格历史上的表现——那段恰好发生过的历史。您无法从中判断,这个结果有多少来自策略本身,又有多少只是那一条特定路径带来的。 EA Overfitter 回答的正是这个问题。它构建最多 100 段您的 EA 从未交易过的合成价格历史,让策略在全部这些历史上重新运行,并展示它所产生的完整结果区间。您得到的不再是一条幸运或不幸路径上的单个数字,而是一幅真实的图景:策略在陌生数据上多久能赚钱、典型结果是什么样(而不是最好的那一次),以及您的回测离它有多远。 这些世界是由您自己的近期历史重建而成,因此这不是预测——任何从历史数据出发的检验都不可能是预测。它告诉您的是:这个优势是否依赖于价格的某一种特定排列,以及回测数字距离典型结果有多远。在投入资金之前,这才是值得回答的问题。 三个步骤 1. 构建。在图表上选择时间区间和世界数量,然后按 Build。EA Overfitter 会
Quant AI Agents
Ho Tuan Thang
5 (1)
Quant AI Agents are independent trading Expert Advisors. Instead of trading using a fixed strategy like other conventional EAs, Quant AI Agents   is a   multi-agent AI trading framework   that turns natural-language strategy prompts into live.  WANT THE SAME RESULTS AS MY LIVE SIGNAL?   Use the exact same brokers I do:   IC MARKETS , IC TRADING   .  Unlike the centralized stock market, Forex has no single, unified price feed.  Every broker sources liquidity from different providers, creating un
Footprint Chart Pro — Professional OrderFlow EA for MetaTrader 5 Version 6.34 | Professional tool for real traders | Institutional-Grade Visualization DEMO USERS - PLEASE SELECT EVERY TICK / REAL TICK WHEN TESTING AND YOU HAVE DOWNLOADED HISTORICAL DATA. IF YOU SEE A WAITING SCREEN AND IT IS NOT DOWNLOADING, IT MEANS YOU HAVE LOW HISTORICAL DATA. TRY 1 MIN AND 5 MIN FIRST ON 1 DAY DATA. ONE DAY DATA SHOULD BE THE NEWEST AND MOST CURRENT DATE. PLEASE WAIT UNTIL THE MARKET HAS ROLLED OVER PERIOD.
Bots Builder Pro MT5
Andrey Barinov
4.17 (6)
This is exactly what the name says. Visual strategy builder . One of a kind. Turn your trading strategies and ideas into Expert Advisors without writing single line of code. Generate mql source code files with a few clicks and get your fully functional Expert Advisors, which are ready for live execution, strategy tester and cloud optimization. There are very few options for those who have no programming skills and can not create their trading solutions in the MQL language. Now, with Bots Builde
Local Trade Copier EA 是针对需要从外部来源执行交易信号或需要同时管理多个账户的个人交易者或账户经理的解决方案,无需 MAM 或 PAMM 账户。它可以从多达 8 个主帐户复制到无限的从帐户 [ 安装指南 | 更新指南 | 故障排除 | 常见问题 | 所有产品 ] 100% 自托管 容易安装和使用 不使用安装程序、配置文件、服务器、内存管道或 DLL 1000 次激活可永久使用 EA 本地执行,无网络延迟 它实现了您需要的所有功能: 最多8个主账户和无限从属账户 适用于所有经纪人和 DD/NDD/ECN/STP 执行 适用于具有不同帐户货币的帐户 在真实账户和模拟账户之间工作不明显 支持主从账户中的符号名称后缀 按幻数和订单评论过滤 不会干扰其他交易 可选择复制 SL 和 TP 水平 可选择复制挂单 支持符号翻译 支持部分关闭 反向模式 灵活的交易规模: - 固定地段 - 乘数 - 成比例的 - 与乘数成比例 EA 可以使用投资者或任何账户的主密码复制交易。 如何将交易从一个主账户复制到一个或多个从账户 在源终端中安装 EA 将 EA 加载到任何图表并选择“MA
The real‑time view of what is happening inside the market. Footprint Secrets brings detailed analysis directly into MetaTrader 5. It shows where volume is trading, how buyers and sellers are interacting, and how liquidity shifts as the market evolves. Designed for traders who want a precise, real‑time understanding of market behavior. Check out the free preview version here:  https://www.mql5.com/en/market/product/172398 Benefits for the Trader See the real activity behind price . Footprint ch
Grid Manual MT5
Alfiya Fazylova
4.73 (22)
Grid Manual是一个交易面板,用于处理订单网格。 该实用程序是通用的,具有灵活的设置和直观的界面。 它不仅可以在亏损方向上设置订单网格,还可以在盈利方向上设置订单网格。 交易者不需要创建和维护订单网格,实用程序会这样做。 打开一个订单就足够了,Grid manual会自动为它创建一个订单网格,并伴随它直到非常关闭。 完整说明和演示版 此處 。 该实用程序的主要特性和功能: 伴隨以任何方式打開的訂單,包括從移動終端打開的訂單。 適用於兩種類型的網格:“限制”和“停止”。 使用兩種方法計算網格間距:固定和動態(基於 ATR 指標)。 允許您更改未結訂單網格的設置。 顯示圖表上每個網格的盈虧平衡水平。 顯示每個網格的利潤率。 允許您一鍵關閉網格中的盈利訂單。 讓您一鍵關閉每個訂單網格。 允許您對訂單網格應用追踪止損功能。 允許您在訂單網格上應用將訂單網格的止損轉移到盈虧平衡水平的功能。 相對於訂單網格的盈虧平衡水平自動重新排列止盈(僅在限價網格模式下,距離取決於所選的計算類型:“保守”或“激進”)。 最多可管理 20 個訂單網格,每個網格最多可包含 100 個訂單。 計算初始手數時,
The AZT Profit Locker is an advanced automated risk-management utility designed specifically for MetaTrader 5 (MT5) traders who want to remove emotional interference and protect their hard-earned profits. Traders aren't just fighting the Forex market, they're fighting their own biology. Fear, Greed and Anxiety lead to holding losers too long and cutting winners too early. The utility flips the script by removing emotion from risk management. Operating as a dedicated automated risk manager, this
AlgoRadar
Stephen J Martret
5 (4)
AlgoRadar is an on-chart analytics dashboard for MT5 that aggregates Expert Advisor performance across multiple accounts, brokers, and platforms, including both MT4 and MT5 data, into a single live view on your MT5 chart. All analysis runs from the chart interface, with no external applications or manual report processing required. EA Analysis and Ranking For traders running multiple Expert Advisors, AlgoRadar provides a consolidated view of each EA's performance across accounts. Active EAs a
Ultimate Trailing Stop EA MT5
BLAKE STEVEN RODGER
4.13 (8)
This EA Utility allows you to manage (with advanced filtering) unlimited open orders (manual or EA) with 16 trailing stop methods: fixed, percent, ATR Exit, Chandelier Exit, Moving Average, Candle High Low Exit, Bollinger Bands, Parabolic, Envelope, Fractal, Ichimoku Kijun-Sen, Alligator, Exit After X Minutes or Bars, RSI and Stochastic. The trailing stop can be either real or virtual, and you can exit fully or with a partial close percent on touch or bar close.  Moreover, you can add (override
Custom Alerts AIO:多市场智能监控,一键启动,无需设置 概述 Custom Alerts AIO 是一款“开箱即用”的高级市场扫描工具,无需额外安装任何其他指标或进行复杂设置。它内置了 Stein Investments 的所有核心指标(FX Power、FX Volume、FX Dynamic、FX Levels 和 IX Power),可帮助您轻松监控所有主要资产类别,如外汇、黄金、指数和加密货币。如果您的经纪商支持股票,您也可以手动添加个股进行监控。 1. 为什么选择 Custom Alerts AIO? 无需额外购买任何指标 • 所有关键指标均已内置,开箱即用。 • 专注于实时预警,不包含任何图形元素,性能高效,界面简洁。 全面覆盖所有主要市场 • 支持监控外汇、金属、加密货币和指数市场。 • 无需手动输入任何交易品种,只需在设置中勾选资产类别即可启用。 • 股票并不属于默认类别,如有需要可手动通过参数输入添加。 高效、专业、便捷 • 无需图表模板和手动加载,适合自动化或远程交易环境。 • 非常适合 VPS 上长期运行,或作为后台市场预警工具使用。 2
MT5 was never built to draw a footprint chart. Orderflow Atlas replaces the chart entirely. It blanks the native price display and renders everything itself on a canvas, owning its own coordinate system. Two things follow from that: you can zoom far past MT5's six native scale steps — the per-candle magnification a footprint actually needs — and the whole view repaints in about 10 milliseconds , because the chart is pixels rather than thousands of graphical objects. The footprint Three cell styl
AI Agent Supervisor is NOT an Expert Advisor. AI Agent Supervisor   is a   multi-agent AI risk & portfolio supervisor   that watches every EA on your account and intervenes in real time.  WANT AN AI PORTFOLIO MANAGER WATCHING YOUR FLEET 24/7?   Run your fleet on the same brokers I do:   IC MARKETS , IC TRADING   .  Unlike the centralized stock market, Forex has no single, unified price feed.  Every broker sources liquidity from different providers, creating unique data streams. The Supervisor r
Welcome to ENTRY IN THE ZONE WITH SMC MULTI TIMEFRAME Entry In The Zone and SMC Multi Timeframe is a real-time market analysis tool based on Smart Money Concepts (SMC), designed to analyze market structure, price direction, and key trading zones. It supports both Single-Timeframe Analysis and Multi-Timeframe Analysis, providing a clearer view of the overall market structure across multiple timeframes, with real-time BUY / SELL signals that do not repaint. It is designed to help filter trading op
EasyInsight AIO MT5
Alain Verleyen
4.92 (12)
EASY Insight AIO – 全能智能交易一站式解决方案 概述 想象一下,您可以在几秒钟内扫描整个市场——外汇、黄金、加密货币、指数,甚至股票——无需手动筛选图表、繁琐安装或配置指标。 EASY Insight AIO 是您专为 AI 交易打造的即装即用数据导出工具。它将整个市场快照一次性输出为简洁的 CSV 文件,直接支持 ChatGPT、Claude、Gemini、Perplexity 等各类 AI 平台的即时分析。 无需窗口切换,无需图表叠加,也没有任何杂乱。只需纯净、结构化的数据自动导出,让您专注于基于数据的高效决策,无需再盯盘耗时。 为什么选择 EASY Insight AIO? 真正的一体化 • 无需设置,无需安装指标,无图表叠加。只需安装、运行并导出——就是这么简单。 多资产全覆盖 • 扫描分析外汇、金属、加密货币、指数、股票——您的券商所能提供的一切市场。 AI 专属数据导出 • 高度结构化、针对 AI 优化的 CSV 文件,直接适配主流智能工具和平台。 完整导出内容: • 三个可选周期的货币强度分析 • 净多头头寸变化体现市场情绪 • 成交量变化、
The ultimate assistant to help you customize your risk per position, open multiple orders with different distance and sizes, manage and track your positions automatically with 5 types of Trailing Stops, Breakeven and Conditional Close functions, stop overtrading or exceeding various drawdown limits, stay safe from possible broker manipulation and many other easy-to-use functionalities. Suitable for both beginner and professional traders of all financial markets. NOTICE   Trade Guardian applic
VirtualTradePad PRO SE MT5 — MetaTrader 5 专业交易控制中心 VirtualTradePad PRO SE 是一款基于图表的高级交易面板,也是适用于 MetaTrader 5 的交易管理工作区。它专为希望获得更快执行、更清晰持仓控制、结构化交易管理、可视化价位规划,以及直接在图表上完成专业交易流程的交易者而设计。 这不仅仅是一个 BUY / SELL 面板。PRO SE 将手动交易、挂单、持仓管理、部分平仓、篮子利润/亏损控制、加仓均价层级、ATM 规则、信号监控、实时市场信息、策略测试器 (Strategy Tester) 流程以及面向 VPS 的运行方式整合到一个互相关联的界面中。 MT4 版本 | 完整说明和截图 | 如何购买 | 如何安装 | 如何获取日志文件 | 如何测试与优化 | Expforex 的所有产品 为什么交易者会选择这套面板 图表一键交易 ,并支持键盘快速操作 快速完成开仓、平仓、修改、反转、锁仓与部分平仓 深度控制仓位、挂单、总利润与风控逻辑 自动参数计算,减少手动输入与重复劳动 为什么 PRO SE 比标准手动交易更高
Global Investing FX Terminal
Santiago Nicolas Pla Casuriaga
Global Investing FX Terminal 是一款面向 MetaTrader 5 的一体化外汇仪表盘——涵盖央行政策利率、CFTC COT 持仓、利差排名、经济意外指数、期权偏斜、散户情绪与相关性,共十三个分析面板——以单一无闪烁画布呈现,每 10 秒从单个挂载 EA 刷新一次,无需任何外部软件。 专业外汇分析需要同时调取通常分散在不同平台的数据:利率衍生品、政府数据门户、券商掉期规格、期权台。此 EA 将所有这些整合到交易终端内的单一界面中,在您执行决策的地方完成分析。 仪表盘上显示的内容 市场概览 外汇对列表 — 所有 28 个 G10 货币对,加上当券商 Market Watch 中存在 NOK/SEK 交叉盘时显示的交叉盘——最多共 36 个货币对——的实时买卖价。每行显示点差、日度与周度变化、以点数表示的绝对区间,以及 ADR%——当前交易时段区间占 14 日平均日区间的百分比。ADR 达到 95% 的货币对已消耗其统计日内延伸空间;伦敦盘中场 ADR 仅 25% 的货币对仍有运行余地。颜色逐 Tick 实时更新。 货币对详情 — 点击列表中的任意行,即可打开该
作者的更多信息
Ziva LSE System
Hassan Abdullah Hassan Al Balushi
ZIVA LSE System A Professional Liquidity & Structure Execution Framework Executive Overview ZIVA LSE System is a professionally engineered analytical framework designed to interpret market behavior through structural logic and liquidity dynamics. It is not positioned as a conventional indicator. Rather, it functions as a structured execution environment that organizes price action into a clear, disciplined decision-making model. The system is built to deliver consistency, clarity, and controlled
Ziva LSE Pro
Hassan Abdullah Hassan Al Balushi
ZIVA LSE Pro: Trade the Flow, Not the Noise ZIVA LSE Pro was developed around a simple belief: professional traders do not need more random signals; they need better context. This workflow reflects the ZIVA approach to filtering market noise and focusing on the liquidity and structural mechanics that influence price behavior. Most indicators treat the market like a static picture. ZIVA LSE Pro is built to read it as a dynamic environment where liquidity, structure, volatility, and execution con
ZIVA Signal Intelligence
Hassan Abdullah Hassan Al Balushi
ZIVA Signal Intelligence An Adaptive, Modular Market Intelligence System ZIVA Signal Intelligence is not positioned as a conventional trading indicator. It is a fully integrated, proprietary market intelligence system engineered to deliver structured, high-precision interpretation of price behavior within a controlled analytical environment. Developed through an independent architectural approach, ZIVA does not rely on, derive from, or replicate existing indicators. It represents a standalone
Gold Crown Pro
Hassan Abdullah Hassan Al Balushi
4.33 (3)
Gold Crown Pro — Professional Gold Trading System for XAUUSD Precision. Control. Consistency. Gold Crown Pro is a professionally engineered Expert Advisor designed exclusively for trading XAUUSD (Gold) . It delivers a structured automated trading approach based on adaptive execution, controlled exposure, and disciplined risk management , tailored specifically for gold market conditions. A Structured Approach to Gold Trading Gold Crown Pro operates through a dynamic execution model that contin
AureX Indicator
Hassan Abdullah Hassan Al Balushi
AureX Indicator AureX Indicator is a technical analysis tool for MetaTrader 5. It is based on a momentum‑style oscillator that measures price accelerates and decelerates. The indicator is designed to: calculate a smoothed internal momentum curve from price data highlight regular, hidden and exaggerated divergence between price and the oscillator mark areas where price movement and internal momentum are not aligned AureX is intended to support your own market analysis and trading plan. It does no
ZIVA TrendX
Hassan Abdullah Hassan Al Balushi
ZIVA TrendX is a professional trend-oriented indicator engineered to provide a clear and structured assessment of market direction through a cloud-based analytical framework. The indicator analyzes price behavior relative to dynamically derived trend boundaries, forming a continuous cloud structure that visually represents the prevailing market bias. This structure enables traders to maintain alignment with dominant directional conditions while filtering short-term market noise. All internal ca
Ziva MMZ
Hassan Abdullah Hassan Al Balushi
ZIVA MMZ – Advanced Structural Pressure Analysis ZIVA MMZ is designed to identify high-impact market pressure areas that are often overlooked by conventional analysis tools and standard chart-reading methods. Built on a proprietary algorithm unique to ZIVA Trade , it is specifically engineered to detect hidden liquidity gaps and structural pressure points that standard indicators fail to identify. Instead of flooding your screen with irrelevant levels, ZIVA MMZ focuses on real-time structural z
ZIVA Kinetic Rail
Hassan Abdullah Hassan Al Balushi
ZIVA Kinetic Rail (ZKR) The Science of Price Equilibrium ZIVA Kinetic Rail (ZKR) is a professional visual indicator designed to display an adaptive price rail directly on the chart. The rail follows price movement and changes its visual state according to active market behavior, helping traders observe directional movement, price balance, and structural transitions with greater clarity. Instead of presenting market direction through a static line or a conventional trend filter, ZKR builds a resp
筛选:
无评论
回复评论