Racing Game 3D

# Racing Game 3D - 基于K线的3D赛车竞速游戏 🎮🏎️

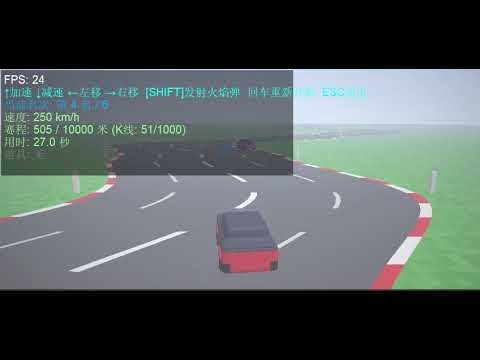
`Racing_Game_3D` 是一款创新的 3D 赛车竞速游戏脚本。它运行在 MetaTrader 5 (MT5) 终端中。该游戏的核心亮点在于**利用当前交易品种的真实 K 线数据(开收盘价格)构建蜿蜒曲折的 3D 赛道**,并且集成了 DirectX 3D 渲染、道具交互、与 5 辆 AI 赛车实时竞速等丰富的游戏元素。

---

## 🌟 核心创意与游戏特色

1. **K线驱动的 3D 蜿蜒赛道 (K-Line 3D Track)**
   * 游戏读取当前图表上的 K 线数据(排除了尚未走完的最新一根 K 线)。
   * 每一根 K 线的实体涨跌幅百分比会被转化为赛道的弯道偏移量。**行情波幅越剧烈,赛道弯道也就越急、越险峻**
   * 内置向心力拉回机制,既产生极具动感的蛇形左右大弯道,又防止赛道无限偏移。

2. **原生 DirectX 渲染引擎 (DirectX 3D Rendering)**
   * 游戏基于 MT5 的底层 `DXContext` 接口,配合顶点着色器(`Shaders/vertex.hlsl`)和像素着色器(`Shaders/pixel.hlsl`)进行高性能的 3D 着色渲染。
   * 通过传递包含玩家坐标、AI 车坐标、局部路面偏移数组、可用道具及飞弹等状态的结构体(`PSInputBuffer`),在 GPU 中完成道路视角拉伸与特效计算。

3. **道具与战斗系统 (Power-Ups & Combat)**
   * 赛道上每隔 30 米随机散落着三种不同属性的道具箱:
     * 🟦 **蓝色箱 (Speed Boost)**:氮气加速状态,速度大幅提升,持续 3.0 秒。
     * 🟥 **红色箱 (Trap)**:打滑陷阱,赛车打滑严重减速至 2 km/h 且方向失控,持续 1.5 秒。
     * 🟨 **黄色箱 (Flame Shot)**:获得火焰弹,按 **[SHIFT]** 键可发射。
   * 火焰弹会在轨道上自适应循迹飞行。一旦击中前方的车辆,会使其陷入 1.5 秒的失控减速状态。

4. **智能 AI 赛车竞速 (AI Competitors)**
   * 玩家将与 5 辆由电脑控制的 AI 赛车同台竞技。
   * AI 赛车拥有不同的基准速度,能自动在不同车道间规避和变道,去拾取有益的蓝色加速箱,甚至在与前车距离合适时,智能发射火焰弹袭击前车。

5. **真实的动态效果与物理限制 (Physics & Yaw Dynamics)**
   * **车身 3D 偏角 (Yaw Angle)**:根据方向盘转向的灵敏度,实时计算车辆的倾斜与偏转角度,车头转向极富动感。
   * **碰撞退回与摩擦**:车辆不能开出公路边界,撞到边界会受到摩擦阻力减速;如果与 AI 车辆发生碰撞,会产生推开效果并严重失控减速。
   * **半透明 HUD 保护底板**:防止游戏中的明亮天空或草地干扰文字辨识。

---

## 🕹️ 游戏操作指南

* **↑**:油门加速。
* **↓**:刹车减速 / 倒车。
* **←****→**:向左 / 向右转向变道。
* **SHIFT**:发射火焰弹(需要已吃黄色道具箱,屏幕下方会显示“持有道具:火焰弹”)。
* **Enter (回车)**:重置比赛,重新开始。
* **ESC**:安全退出游戏,重新恢复 MT5 原图表窗口。

---

## 🛠️ 代码核心架构解析

1. **`rates[]` 数据转化与赛道构建**
   * 从索引 1 开始通过 `CopyRates` 复制指定根数的 K 线数据。
   * 通过 `rates[i].close - rates[i].open` 计算涨跌幅,并正比放大作为赛道左右弯曲变量写入全局 `RoadOffsets[]` 数组。

2. **`PSInputBuffer` 着色器传参**
   * 将每帧的变量(如 resolution、时间、玩家车速/绝对位置、5辆AI车三维姿态、局部32组赛道偏移量、3组最近箱子数据、2组火焰弹位置)打包送入像素着色器。

3. **`UpdateGame(double dt)` 物理引擎**
   * 更新氮气加速及打滑的倒计时,处理油门自然摩擦阻力。
   * 计算玩家和 5 辆 AI 赛车最新的世界 X/Z 绝对位置。
   * 实时调用 `GetRoadXCPU(z)` 获取赛道在指定纵深处的绝对 X 中心,以此判断边界阻挡(公路半宽为 `ROAD_HALF_WIDTH` 6.0米)。
   * 处理玩家/AI 的火球射击判断,以及人车、车车碰撞体积判定。
   * 判断终点线胜负(`FinishLineDistance`)。

4. **图形更新 (`DXDrawIndexed` + 位图重置)**
   * 每帧清空深度缓存,更新像素着色器的时间轴输入,调用 `DXDrawIndexed` 完成底层 DirectX 渲染。
   *`DXContextGetColors` 把显存的渲染图导出到一维缓冲 `image[]`,并在 CPU 侧用 `TextOut` 叠写 HUD 赛程与状态,最后在图表生成位图标签。

---

## ⚙️ 参数配置

游戏在启动时提供了如下参数配置:

* **InputKLineCount** (`赛道K线数量`): 默认 `1000`。可自由增加或减少,代表了 3D 赛道的总长度。
* **CurveIntensity** (`弯道偏移强度`): 默认 `2.5`。数值越大,K 线涨跌引起的左右弯道越陡峭。
* **SegmentLength** (`段距`): 默认 `10.0`米。代表每根 K 线所延展的 3D Z 轴深度。

---

## 🚀 运行方法

1. 打开 MetaTrader 5。
2. 打开你想挑战的交易品种和周期(例如 GBPUSD, M15)。
3. 在左侧“导航”窗口中,找到 **脚本 (Scripts) -> My_Scripts -> 3D动画 -> Racing_Game_3D** 目录下的 `Racing_Game_3D`
4. 双击或将其拖拽到当前的交易图表上。
5. 在参数窗口中配置你需要的关卡长度与弯道难度,点击“确定”。
6. 图表窗口将被赛车游戏画面覆盖。开始享受极速竞技吧!需要退出时按 **ESC** 键即可。

---

推荐产品
King Trade Copier
Mohammed Maher Al-sayed Mohammed Ahmed Saleh
KingCopier – Lightning-Fast Local Trade Copier for MetaTrader (Master + Slave) KingCopier is a professional local trade copier that mirrors every trading action from one Master account to unlimited Slave accounts on the same PC or VPS — with an internal copy latency of just a few milliseconds. It was built by a real trader for daily real-money use, with one goal: whatever happens on the Master must happen on the Slave, instantly and without exceptions. Watch the demo video to see the real cop
PZ Mean Reversion MT5
PZ TRADING SLU
1 (1)
采用专业和量化方法进行均值回归交易的独特指标。它利用了价格以可预测和可衡量的方式转移并返回均值这一事实,这允许明确的进入和退出规则大大优于非量化交易策略。 [ Installation Guide | Update Guide | Troubleshooting | FAQ | All Products ] 清晰的交易信号 非常容易交易 可定制的颜色和尺寸 实现性能统计 优于大多数交易策略 显示合适的止损和止盈水平 它实现了电子邮件/声音/视觉警报 这个怎么运作 该指标从更高的时间范围测量完全可定制的移动平均线的标准偏差,并使用趋势跟踪方法精确地找到交易。交易是通过深入当前图表的价格行为发现的,并在价格返回到平均价格区间时关闭,根据您选择的更高时间范围计算。由于其编码方式,该指标将远离高波动性和强劲趋势市场,并且仅在可预测的情况下进行交易,在可接受的波动性与方向性比率范围内,回归均值是可行的。 指标剖析 绿线是更高时间范围内的移动平均线(也就是平均值) 虚线区域是移动平均线周围的典型价格区间 蓝线是看涨交易的突破价格 红线是看跌交易的突破价格 交易是针对均值进行的,并在典型的价格
Trading Utility for Forex Currency Pairs Only not for Gold  Functions Auto Lot Calculation based on Risk Auto stoploss  Auto TakeProfit Breakeven Auto Close Half % Close in percentage with respect to the PIPs Pending Orders BuyLimit Sell Limit with distances BuyStop Sell Stop    with distances Trading Informations Risk in percentage For Multiple trades Combine Takeprofit and Combine Stoplosses
ChangePeriod MT5
Kazuya Yamaoka
You can change the time period of the chart at the touch of a button. You can also change multiple charts at the touch of a button. You can also change multiple charts at the touch of a button,   saving you the trouble of changing time periods. We are live-streaming the actual operation of the system. Please check for yourself if it is usable. Please check it out for yourself. https://www.youtube.com/@ganesha_forex We do not guarantee your investment results. Investments should be made at you
VWAP Analytics Advanced Suite for MetaTrader 5 Gain institutional-grade market insight with the VWAP Analytics Advanced Suite , a professional Volume Weighted Average Price indicator built exclusively for MetaTrader 5. This tool goes beyond a simple VWAP line; it is a complete analytical ecosystem designed to identify trend bias, measure market deviation, and provide high-probability entry and exit signals with precision timing. Whether you are a day trader, scalper, or swing trader, this su
Risk Ruler
AL MOOSAWI ABDULLAH JAFFER BAQER
Risk Ruler Plan every trade with precision before you enter the market. Risk Ruler is a professional on-chart position sizing and risk management tool for MetaTrader that helps traders calculate the optimal trade size based on their predefined risk. By simply dragging the Entry, Stop Loss, and Take Profit lines directly on the chart, all essential trading calculations update instantly, allowing you to make informed decisions before placing a trade. Designed for both manual and professional trade
Modern Dark Chart Theme for MT5 Upgrade your MetaTrader 5 chart into a clean, dark, professional trading workspace. Your chart is your trading office. It is where you analyze the market, test Expert Advisors, review setups, record videos, share screenshots, and make trading decisions. If your MT5 chart looks old, bright, noisy, or unprofessional, your trading environment can feel distracted before you even start your analysis. Modern Dark Chart Theme for MT5 helps you create a cleaner, darker,
FREE
Easy Trade Copy Client MT5
Krutik Piyushkumar Parekh
Easy Trade Copy (Client / Receiver) The easiest and most reliable way to copy trades to your account without missing a beat. If you want to copy trades from a master account to your own account, you need a tool you can trust. Most copiers glitch, miss trades, or accidentally open duplicates when your internet drops or your computer restarts. The Easy Trade Copy is built differently. It is a "smart" copier that double-checks every single trade to make sure your account perfectly matches the mast
Auto Trade Copier 被设计成多的MT5账户/端子,绝对精度之间复制交易。 有了这个工具,你可以充当要么提供商(源)或接收(目的地) 。每一个交易行为将由提供商克隆到接收器,没有延迟。 以下是亮点功能:     在一个工具提供商或接收器之间转换角色。     一个供应商可以交易复制到多个接收者的账户。     绝对兼容MT5的顺序/位置管理规则,该规则允许与调整容积为每个符号只有一个位置。     自动识别和同步代理之间的符号后缀。     允许高达5特殊符号的设置(即: GOLD - > XAUUSD ,等等) 。     多lotsize设置选项。     允许过滤的订单类型将被复制。     关断端子或电源关闭后恢复以前的设置和状态。     实时控制面板。     使用方便,界面友好。 用法: - 安装工具提供的MT5终端,并选择角色“提供者” ,然后启用它。 - 安装工具接收的MT5终端,并选择角色的“接收器” ,输入提供商的帐号,然后启用它(你可以有很多接收者的帐户,只要你想) 。 设置和参数:      特殊符号设置(菜单) : 配置高达5对特殊
Noize Absorption Index
Ekaterina Saltykova
Noize Absorption Index - is the manual trading system that measures the difference of pressure between bears forces and bulls forces. Green line - is a noize free index that showing curent situation. Zero value of index shows totally choppy/flat market.Values above zero level shows how powerfull bullish wave is and values below zero measures bearish forces.Up arrow appears on bearish market when it's ready to reverse, dn arrow appears on weak bullish market, as a result of reverse expectation.
TradeGuard Capital Protection Professional Risk, Exposure & Trade Manager for MetaTrader 5 This utility acts as a professional insurance system for your trading account. TradeGuard Capital Protection is a professional-grade risk & money management utility designed to protect your trading account from excessive losses, emotional trading, and uncontrolled exposure. This tool does NOT open trades . It strictly manages risk, drawdown, exposure, and safety protections . Perfect for manual traders, EA
Chinese (Simplified) 代码优势解释(不涉及具体代码) 1. 更精细的市场状态区分(三维) 大多数工具只显示“涨”或“跌”,但该工具特别分离出了**“盘整”(Sideways)**力量。交易者可以清晰看到: 买方主导时(多头)。 卖方主导时(空头)。 最重要的是: 市场无方向或休息时(盘整),有效减少震荡期的操作失误。 2. 强度量化震荡指标 (0-100) 将价格波动标准化为 0 到 100 的范围: 极端区域: 设定超买/超卖阈值(如高于80或低于20)。 区域填充: 对关键区域进行着色,一眼就能识别市场是否处于“峰值”。 3. 灵活的噪音过滤(平滑与加权) 设计用于自定义信号的“平滑度”: 减少误导信号: 提供多种平均算法(RMA, EMA, SMA 等)以过滤市场噪音。 成交量加权: 可选择加入**成交量(Volume)**进行计算,比单纯看价格更可靠。 4. 清晰的趋势提示 交叉箭头: 当买卖力量发生转换时显示箭头,明确入场时机。 可定制显示: 用户可开关线条、填充或箭头,保持图表整洁。 5. 性能与稳定性 优化了资源占用,修复了高 CPU 使用率问题,多开
CRYPTO ZEUS DUAL-CORE PROTOCOL  Advanced Crypto Matrix: Supertrend AI + External Sync Module - [NEW] 24/7 Crypto Unlock: The EA now fully supports weekend trading by auto-detecting Crypto assets. - [NEW] Continuous Trend Rider: Re-enters trades continuously on pullbacks if the macro-trend remains strong, maximizing profit on long runs. - [NEW] Ghost Trailing Stop: Added a virtual trailing stop to fully ride breakouts instead of exiting at fixed Fibo targets. - [NEW] Preset System: Added a buil
指标 WPRV2 的完整描述 指标 WPRV2 是经典技术分析工具威廉斯百分比范围(%R)的改进版本。它主要用于金融市场,包括股票交易所、外汇和加密货币平台,以帮助分析市场趋势并确定最佳入场和出场点。 指标用途 WPRV2 指标的主要目的是测量当前价格相对于最近高低点的位置。通过这种方式,可以了解: 当前价格是否接近历史高位? 当前价格是否接近历史低位? 这有助于交易者及时响应价格反转或现有趋势持续的信号。 WPRV2 指标特点 1. 图形表示法 该指标在主资产图表之外单独显示,并由两条线组成: 主线 ( WPR ):展示给定周期内 %R 满足值的变化情况。 附加红色线 ( Current ):仅显示当前指标值及前一个数据点,可视化跟踪移动方向。 2. 水平水平线与通知功能 用户可以设置三个水平水平线(默认为 -20%、-50% 和 -80%),当价格达到这些极限区域时会发出警报。当主线向上或向下穿越水平线时,指标将生成可视化和声音提示,便于立即决策。 3. 时间参数调节 主要配置项是计算期间长度 ( WPRPeriod ),决定考虑价格极值的时间段。较短的周期使得指标对短期价格波动
Ultimate Pro Trading Panel — All-In-One Manual & Grid Trading Dashboard Pro Trading Panel   is an all-in-one on-chart control panel that gives discretionary and semi-automated traders a complete toolkit for entries, exits, risk management, and grid trading — without leaving the chart. Every function is visual, draggable, and updates in real time. If you want to test this utility feel free to download the basic preview version of this tool here:  https://www.mql5.com/en/market/product/181435 Who
CoPilot dashboard MT5
Frederic Jacques Collomb
CoPilot — 每日交易仪表板 掌握你的数据。清晰地交易。 MT4 版本 什么是 CoPilot? CoPilot 是一款 专业级 交易助手,可将您每日的交易绩效统计数据 实时 显示在图表上——配备 实时权益曲线 ,逐笔更新。专为需要在不离开图表的情况下即时了解交易状态的活跃交易者而设计,CoPilot 汇总 当日所有交易品种的每笔已平仓交易 ,并以简洁、色码化的交互面板呈现。 无需再切换到终端历史选项卡,无需手动计算。CoPilot 就像您的 副驾驶 ——时刻守候,持续计算,始终在您眼前。 实时统计面板 CoPilot 显示完整的每日绩效指标,分为三个部分: 活动 — 今日总交易数、已平仓交易、持仓数量、盈利/亏损笔数、 胜率 (%) 及保本交易。胜率颜色动态调整:高于 50% 显示绿色,低于 50% 显示红色。 盈亏 — 净盈亏 、 盈利因子 、每笔平均盈利和平均亏损、 平均风险回报比 、当日最佳交易和最差交易。每个数值根据其含义以绿色或红色显示。 时间与点数 — 平均持仓时间、最短和最长持仓时间、所有交易品种累计 总点数 ,以及 最大连续盈利/亏损次数 。 所有统计数据均基于
按价格设置TP和SL – MT5自动订单修改器 自动为任意交易设置精确的TP和SL价格 ️ 适用于所有货币对和EA,可按符号或魔术号筛选 此EA允许您通过直接价格值(例如EURUSD的1.12345)来设置和应用精确的止盈(TP)和止损(SL)水平。无需点数或Pips。为所有订单或按图表/魔术号筛选实现干净、精准的交易管理。 主要功能: 通过精确价格即时修改TP和SL 应用于所有订单、当前图表或特定魔术号 ️ 输入0以移除TP或SL 连接到任意图表后自动运行 兼容所有交易品种 适用于: 想快速控制TP/SL的手动交易者 需要覆盖默认退出逻辑的EA用户 管理多订单或复杂头寸的交易者 有问题或建议吗? 请留言提出您的问题或功能想法。 您的反馈将帮助我们改进未来版本。 Keywords: 按价格设置TP SL, MT5 TP SL管理, 自动SL TP MT5, 修改SL TP MT5, 交易管理EA, 专家顾问SL TP, 设置止盈价格, 设置止损价格, 应用TP SL MT5, MT5工具EA, SL TP覆盖,
SPECIAL LAUNCH OFFER: $30 (1-Month Rent) Limited time offer to build our community and gather feedback! AmbM GOLD Institutional Scalper A high-precision M5 algorithm for XAUUSD (Gold) , engineered to trade exclusively at Institutional Liquidity Levels ($5/$10 psychological marks). PERFORMANCE DATA (BUY ONLY) • Win Rate: 87.09%. • Safe Growth: +$4,113 profit on $10k (13.75% Max Drawdown). • Extreme Stress Test: Successfully generated +$22,997 in a 5-year stress test (2020-2026), proving
RBreaker
Zhong Long Wu
RBreaker Gold Indicators 是黄金期货一种短线日内交易策略,它结合了趋势跟踪和日内反转两种交易方式,既能捕捉趋势行情的利润,又能在行情反转时及时止盈并顺势反手。 该策略曾连续15年被美国《Futures Truth》杂志评选为前十大最赚钱的交易策略之一,具有很长的生命周期,至今仍在国内外普遍使用与研究。 本指标结合了2026年期货黄金的走势,依据14日ATR指标,分别定义了突破系数A,观察系数B,反转系数R更合理的数值,非常不错的指标,已实现年稳定盈利,值得推荐~ 以上指标适合高波动品种,参数适合期货黄金,股指期货等,如果需要其他品种行情,需要单独设定 突破系数A,观察系数B,反转系数R,进行回测才能使用。 欢迎指标售后有问题可以加+V:504282029
Arrow Micro Scalper 是一款专为剥头皮和短期交易而设计的指标,可集成到任何图表和金融工具(货币、加密货币、股票、金属)中。 在她的工作中,她使用波浪分析和趋势方向过滤器。建议在从 M1 到 H4 的时间范围内使用。 如何使用指标。 该指标包含 2 个用于更改设置的外部参数,其余参数已默认配置。 大箭头表示趋势方向的变化,蓝色箭头表示下降趋势的开始,粉红色箭头表示上升趋势的开始。 “ Only trending direction ”参数启用和禁用使用内部趋势的模式,提供使用您自己的趋势或不使用趋势的机会,并且还启用/禁用仅根据趋势显示趋势箭头和信号箭头。 小信号箭头,该指标最重要的对象,粉色代表“买入”交易,蓝色代表“卖出”交易。 “ Smoothing ”参数决定信号箭头出现的时间,操作范围为 7 到 25,为时间范围 M1-M5 选择大值,为 M15-H1 选择中值,为 H4 - D1 选择小值。 趋势箭头和开始信号箭头有警报。 指标不会重新绘制。
Trade copier MT5
Alfiya Fazylova
4.6 (55)
Trade Copier 是一种专业实用程序,旨在复制和同步交易账户之间的交易。 复制发生从供应商的帐户/终端到收件人的帐户/终端,安装在同一台计算机或 vps 上。 促销活动 - 如果您已经购买了“Trade copier MT5”,您可以免费获取“Trade copier MT4”(用于 MT4 > MT5 和 MT4 < MT5 的复制)。欲了解更多详细条款,请通过私人消息与我们联系! 在购买之前,您可以在演示帐户上测试演示版本。 演示 这里 。 完整说明 这里 。 主要功能和优点: 支持复制MT5>MT5、MT4>MT5、MT5>MT4,包括МТ5 netting账户。 供应商和收件人模式在同一产品中实现。 简单直观的界面,允许您直接从图表中实时控制复制。 连接中断或终端重新启动时不会丢失设置和位置。 允许您选择要复制的符号,也可以替换接收者的符号,例如 EURUSD> USDJPY。 允许为每个符号设置个性化的复制设置。 支持回拷贝。 能够仅复制某些订单。 允许您设置开仓交易价格的最大差异和最大时间延迟。 正确复制部分订单关闭的执行。 计算复制手数的几种方法。 同步止盈和止损
BeansAssist
Ivanvielle Bonifacio Dupaya
BeansAssist *Major update 3.00 released. Kindly update your copy of BeansAssist Gives you fruitful information of the price of the symbol that you are trading. Improve your trades simply by following the suggestion that it gives you. Tracks deal stats daily so you keep track of your performance. Don't let emotions take control, be a better and profitable trader with BeansAssist to guide you. *Note: This utility is not for free 
GDS Renko Pip ST - Fixed Brick Renko Chart Tool for MetaTrader 5 GDS Renko Pip ST is a Renko chart tool for MetaTrader 5 designed for traders who want to build and study fixed brick Renko movement using a practical pip or point-based setup. The purpose of this tool is simple: create a cleaner Renko structure so the trader can observe direction, brick runs, pullbacks, support and resistance behavior without normal candle noise. This is not a signal indicator and it does not predict the market. It
ABQ Visual Risk Sizer
Cristian David Castillo Arrieta
ABQ Visual Risk Sizer - 机构级风险管理与交易执行工具 类别:实用工具 / 风险管理 手动计算手数既耗时又费钱。 在现代交易中,特别是在操作自营交易账户(Prop Firms)时,手数计算错误或下单延迟5秒都可能意味着违反每日回撤规则,或错过完美的入场价格。 ABQ Visual Risk Sizer 是一款专为彻底解决这一问题而设计的机构级工具。它将复杂的风险数学计算转化为直观、快速且100%准确的视觉体验,直接在您的 MetaTrader 5 图表上运行。 忘记外部计算器或 Excel 表格吧。只需在图表上拖动线条,即可实现一键交易。 为什么您需要 ABQ Visual Risk Sizer 为自营交易公司提供全面保护: 确保每笔交易的风险完全符合您设定的百分比(或金额)。在黄金或纳斯达克等高波动性资产中,再也不会开错手数。 反应速度: 当您用鼠标移动止损位时,毫秒级计算风险、所需保证金和风险回报比。 通用资产计算: 内部算法自动读取交易商的报价步长(Tick Size)和报价价值(Tick Value)。完美适用于外汇、指数、大宗商品、股票和加密货币。 主要
AlgoDevMT5 Trade Manager Pro AlgoDevMT5 Trade Manager Pro is a professional trade management and risk control utility for MetaTrader 5. Designed for discretionary traders and funded account traders, this utility helps traders plan trades visually, calculate position size instantly, and manage risk with precision. Trade Manager Pro does not generate trading signals, open trades automatically, or provide investment advice. It is a trader-assistance utility designed to improve consistency and risk
Manus Pro
Itumeleng Mohlouwa Kgotso Tladi
MANUS PRO EA The Trading Revolution You've Been Waiting For Are you TIRED of watching other traders make consistent profits while your account bleeds red?   The financial markets don't wait for anyone – and neither should you. MANUS PRO isn't just another Expert Advisor... it's your   TICKET TO FINANCIAL FREEDOM . Why MANUS PRO is Different (And Why Everyone's Talking About It) FOR BEGINNERS: Your Trading Mentor That Never Sleeps Zero Learning Curve   – Install, activate, and watch it wo
GDS Renko Pip ST Chart - Pip-Based Renko Chart Indicator for MetaTrader 5 GDS Renko Pip ST Chart is a pip-based Renko chart indicator for MetaTrader 5. It helps traders build and study cleaner Renko price movement using a practical fixed pip or point-based brick structure. This tool is designed as a Renko chart foundation for manual analysis. It does not predict the market, does not generate buy or sell signals and does not decide whether a trade should be opened. Renko EDGE EA Golden Delta | A
This is my first ExpertAdvisor, but it came along with more than 7 years in experience trading Forex , Crypto and Index.                                                                                SHEERAN: The Advanced Multi-Timeframe EA for Dynamic and Adaptive Trading   EA SHEERAN, is designed for traders who demand precision, flexibility, and reliability across multiple timeframes. Whether you’re targeting short-term gains on the M30 chart or looking for sustained moves on the H4, this E
Inverted_Chart_EA Utility Expert Advisor Inverted_Chart_EA creates and maintains a mirror-inverted chart of any symbol and timeframe. It automatically generates a custom instrument (e.g. US30_INV ) and keeps its price history updated in real time, with bars mirrored around a chosen pivot. This utility gives traders a new way to analyze the market from a different perspective by flipping the chart upside down. Why use an inverted chart? Highlight hidden patterns – price formations that look ordin
Mine Farm
Maryna Kauzova
Mine Farm is one of the most classic and time-tested scalping strategies based on the breakdown of strong price levels. Mine Farm is the author's modification of the system for determining entry and exit points into the market... Mine Farm - is the combination of great potential with reliability and safety. Why Mine Farm?! - each order has a short dynamic Stop Loss - the advisor does not use any risky methods (averaging, martingale, grid, locking, etc.) - the advisor tries to get the most
该产品的买家也购买
Trade Assistant MT5
Evgeniy Kravchenko
4.43 (215)
它有助于计算每笔交易的风险,容易安装新的订单,具有部分关闭功能的订单管理, 7 种类型的追踪止损和其他有用的功能。   附加材料和说明 安装说明   -   应用程序说明   -   模拟账户应用程序的试用版 线条功能  - 在图表上显示开仓线、止损线、止盈线。 有了这个功能,就可以很容易地设置一个新的订单,并在开仓前看到它的附加特性。   风险管理  - 风险计算功能在考虑到设定的风险和止损单的大小的情况下,计算新订单的成交量。它允许你设置任何大小的止损,同时观察设定的风险。 批量计算按钮 - 启用 / 禁用风险计算。 在 " 风险 " 一栏中设置必要的风险值,从 0 到 100 的百分比或存款的货币。 在 " 设置 " 选项卡上选择风险计算的变量: $ 货币, % 余额, % 资产, % 自由保证金, % 自定义, %AB 前一天, %AB 前一周, %AB 前一个月。   R/TP 和 R/SL - 设置止盈和止损的关系。 这允许你设置相对于损失的利润大小。 例如, 1 : 1 - 这决定了 TP = SL 的大小。 2 : 1 - 这意味着 TP 是 SL 的两倍。 RR -
欢迎来到 Trade Manager EA——这是一个终极风险管理工具,旨在使交易变得更直观、精准和高效。它不仅仅是一个下单工具,而是一个用于无缝交易计划、仓位管理和风险控制的全面解决方案。不论您是新手交易员、资深交易员,还是需要快速执行的剥头皮交易员,Trade Manager EA 都可以满足您的需求,适用于外汇、指数、大宗商品、加密货币等各种市场。 借助 Trade Manager EA,复杂的计算已成过去。只需分析市场,在图表上用水平线标记入场、止损和止盈,设置您的风险水平,Trade Manager 就会立即计算出理想的头寸规模,并实时显示以点、账户货币计价的止损和止盈。每笔交易都得以轻松管理。 主要功能: 头寸规模计算器 :根据定义的风险瞬间确定交易规模。 简单的交易计划 :在图表上用可拖动的水平线直接计划交易,设置入场、止损和止盈。 实时显示 SL 和 TP :以账户货币、点或分显示止损和止盈,便于分析。 高级保护工具 盈亏平衡选项 : 基本盈亏平衡 :当您的交易达到设定水平时自动保护利润。 多级盈亏平衡 :设置多达 4 个级别以逐步保护利润。 尾随止损选项 : 基本尾随
Local Trade Copier EA MT5
Juvenille Emperor Limited
4.94 (148)
Local Trade Copier EA MT5 是一款快速、灵活的交易复制工具,用于在同一台 Windows 电脑或 Windows VPS 上的多个 MetaTrader 5 账户之间复制和管理交易。 它将本地交易同步与 Receiver 端的手数管理、风险管理、交易过滤、品种映射、交易管理和账户保护功能结合在一起。 只需约 1 分钟 即可完成 Transmitter 和 Receiver 终端的设置,并可在同一经纪商或不同经纪商的账户之间复制手动交易或 EA 交易。在合适的条件下,本地 MetaTrader 终端之间的交易信息可以在 0.5 秒以内 完成同步。实际交易执行速度取决于经纪商延迟、网络状况、电脑/VPS 性能以及终端负载。 购买前先试用免费演示版 您可以在 MT5 模拟账户上测试 功能完整的 Local Trade Copier EA MT5 免费演示版 ,每次可使用 4 小时 : 下载 Local Trade Copier EA MT5 免费演示版 将下载的文件放入: MT5 → 文件 → 打开数据文件夹 → MQL5 → Experts 然后重新启动 MT
================================================================================ POC BREAKOUT - V20.72. Full Professional Grade Toolkit ================================================================================ POC Breakout is a full MetaTrader 5 trading dashboard for discretionary traders who want breakout signals, Point of Control (POC) context, volume profiles, order flow, market structure, news, alerts, and advanced trade planning in one professional workspace. Attached directly to you
TradePanel MT5
Alfiya Fazylova
4.88 (167)
交易面板是一款多功能交易助手。该应用包含超过50种手动交易功能,并允许您自动执行大多数交易任务。 应用程序说明 + 视频教程: https://www.mql5.com/zh/blogs/post/772452 用于模拟账户的应用程序试用版: https://www.mql5.com/zh/blogs/post/762579 如何安装应用程序: https://www.mql5.com/zh/blogs/post/762580 如何在可视化模式下测试应用程序: https://www.mql5.com/zh/blogs/post/770278 如何在VPS MetaTrader上安装应用程序: https://www.mql5.com/zh/blogs/post/770196 贸易. 只需单击一下即可执行交易操作: 打開掛單和頭寸,並自動計算風險。 一鍵打開多個訂單和頭寸。 打開訂單網格。 按組別關閉掛單和頭寸。 反轉頭寸方向(關閉買入>打開賣出,關閉賣出>打開買入)。 鎖定頭寸(通過開啟缺少的頭寸,使買入和賣出頭寸的數量相等)。 一鍵部分關閉所有頭寸。 將所有頭寸的止盈和止損設置在同
Telegram to MT5 Multi-Channel Copier   可将您 Telegram 频道中的交易信号自动复制到 MetaTrader 5。无需机器人、无需浏览器扩展、无需手动复制。信号一到 Telegram,EA 几秒内就在您的终端开仓。 在复制某个频道之前,内置回测器还能告诉您该频道在您的账户上会有怎样的表现。 产品包含两个组件:一个监听您 Telegram 频道的 Windows 应用程序,以及在 MT5 终端执行信号的本 EA。同时提供 MT4 版本   点此 . 设置指南与应用下载:   https://www.mql5.com/en/blogs/post/768988 当前价格将来会上调。 工作原理 Windows 应用通过您自己的 API 凭据连接 Telegram——不是机器人。这意味着它可以读取您订阅的任何频道、群组或话题,包括私有和 VIP 频道。您还可以把直接给您发消息的信号机器人、私聊,甚至自己的"收藏夹"(Saved Messages)用作信号来源。检测到信号后,应用会解析并交给 EA。EA 按您的经纪商解析品种名称,按您的风险设置计算手数并
按照自己的交易规则复制 Telegram 信号 Telegram to MT5 Signal Trader 可将 Telegram 公开及私密频道和群组中的文字交易信号自动复制到 MetaTrader 5。通过一个桌面应用管理多个信号提供者和 MT5 账户,并为 每个提供者单独设置风险和交易参数 。 复制信号无需 Telegram 机器人,也无需配置 API。 只需通过手机号或二维码登录您自己的 Telegram 账户,然后选择您已加入的频道或群组。您无需创建机器人,也无需提供 Telegram API 令牌、API ID 或 API hash。 自行选择仓位大小,将平仓分配到多个止盈价位,并自动执行保本止损和移动止损。在跟随信号提供者的同时,掌握信号的实际交易方式。 本产品由这款 MT5 EA 和必须配合使用的 Windows 桌面应用组成。请参阅 安装指南及应用下载 。 管理多个信号提供者和账户 为每个提供者单独设置: 为每个频道设置专属的仓位计算方式、入场规则、止损、止盈和交易管理参数。 灵活分配至不同账户: 将同一提供者的信号复制到多个已连接的 MT5 账户,并为每个账户使用不
Farmed Hedge Yield Farming | All Markets (Manual - Hybrid - Semi/Automated EA) VERIFIED TRADING RESULTS - Farmed Hedge Yield Axi Copy:  https://www.mql5.com/en/signals/2356376 - Farmed Hedge Yield Exn Copy:   https://www.mql5.com/en/signals/2356404 - Farmed Hedge Yield V Copy:  https://www.mql5.com/en/signals/2357156 IMPORTANT NOTICE: FarmedHedge is a MANUAL-FOCUSED TRADING UTILITY ,not a fully automated EA. Results shown on this Signal include manual trades and overall strategic management.
Strategy Ledger Pro
Abdullah Uygar Tuna
5 (2)
Strategy Ledger Pro 是一个面向 MetaTrader 5 的只读账户分析面板。它按 EA、策略、品种和魔术号分别呈现账户结果。 详细 手册 ,逐项说明每个功能。 MetaTrader 只显示整个账户的一个余额。当多个 EA 同时交易时,这个余额无法显示各自的贡献。Strategy Ledger Pro 读取账户历史,重建已平仓的持仓,将它们归属到各个策略,并在一个面板中呈现结果。 本产品不会开仓、修改或平仓。它不包含任何交易策略,不创建指标,也不读取图表价格。 主要功能 按 EA、单个策略、品种或魔术号统计结果。 预设周期和自定义日期范围。 已实现与浮动结果、持仓敞口、交易统计、点数、回撤和净值曲线。 佣金、隔夜利息、成本占比,以及入场和出场滑点估算与合计。 基于固定规则的表现评级、文字总结和状态标记。 交易组:同时开立的持仓在置信指标中算作一次决策。 账户和每一行的实时净值回撤跟踪。 交互式命名、分组、移动、隐藏、恢复、展开和排序。 身份:将一个魔术号声明为一个或多个策略;把魔术号或手数从面板上移除,并报告它们的价值。 固定手数模式:以统一手数回放每一笔交易,
Telegram To MT5 Ultra
Mirel Daniel Gheonu
5 (5)
Telegram To MT5 — 信号复制器 将您的 Telegram 频道中的交易信号变成真实的 MT5 订单 — 自动执行,可用于任意数量的账户,风险与规则完全由您掌控。 Telegram To MT5 将您已在 Telegram 关注的 VIP / 信号频道连接到您的 MetaTrader 5 终端。一个免费的配套桌面应用读取消息(即使是禁止机器人的频道),而本 EA 在您的账户上执行这些信号 — 应用您自己的风险设置、品种映射、止盈处理、交易时段与新闻过滤。 它是一个信号复制器,而非黑箱策略:由您决定信任哪些频道,以及每笔交易如何计算手数和管理。 分步设置与配套应用安装指南 工作原理 [您的 Telegram 频道] -> [配套桌面应用] -> [MT5 + 本 EA] -> 订单 配套桌面应用(免费,已包含)使用您的 Telegram 账户登录并监视您所选择的频道。即使是禁止机器人的 VIP 频道也能正常工作,它通过一个私有、加密的本地桥接转发每条消息。 本 EA 挂在一个图表上,在 MT5 接收这些信号,并按照您的规则开仓 / 管理交易。 应用与 EA 之间的连接是位于
Astro Trade MT5
Indra Maulana
5 (7)
25% discount on the release of the tool: only for the next 3 buyers Send a message to receive a demo version. AstroTrade Trading Assistant AstroTrade is a comprehensive multi-functional trading utility developed for the MetaTrader 5 platform. It integrates essential tools for trade execution, risk management, and technical monitoring into a single unified interface. The application is designed to assist traders in managing their daily operations through a visual and structured environment. Vi
Premium Trade Manager - 内置交易导师的图表面板 Premium Trade Manager 将一位交易导师嵌入您的图表,并在其下搭载完整的执行引擎。像往常一样建立交易,然后让您的 AI 交易导师 Max 读取这笔具体的交易,结合您的实时账户给出直接判断,再由您决定是否下单:止损是否符合纪律化交易的要求、风险规模是否合理、高影响新闻事件是否即将发布、您是否接近资金盘限额。其下是完整的执行引擎,负责点击之后的一切:一键按风险下单、您在图表上拖动规划且交易进行中仍可随时调整的计划、最多四个分批止盈级别、七种移动止损方式、实时资金盘合规检查、新闻屏蔽保护,以及对自身成本进行评级的点差功能。决策由您做出。Max 给出第二次审视。面板负责此后的一切。 购买前先亲手体验。 直接在浏览器中点击实时面板,这是在购买前感受其工作方式的最快途径。 stein.investments/products/premium-trade-manager Max 是您的一对一 AI 交易导师,他直接内置于面板之中。  他了解您的账户、您的设置和您的规则,用您自己的语言回答,并在每笔交易下单前进
EA Overfitter
Stephen J Martret
5 (1)
回测看起来很漂亮。但它明天、下周、下个月还能继续赚钱吗? EA Overfitter 让您的 EA 在 100 段它从未见过的价格历史上重新运行。一个分数告诉您这个优势是否真实。 回测告诉您的,是 EA 在某一段价格历史上的表现——那段恰好发生过的历史。您无法从中判断,这个结果有多少来自策略本身,又有多少只是那一条特定路径带来的。 EA Overfitter 回答的正是这个问题。它构建最多 100 段您的 EA 从未交易过的合成价格历史,让策略在全部这些历史上重新运行,并展示它所产生的完整结果区间。您得到的不再是一条幸运或不幸路径上的单个数字,而是一幅真实的图景:策略在陌生数据上多久能赚钱、典型结果是什么样(而不是最好的那一次),以及您的回测离它有多远。 这些世界是由您自己的近期历史重建而成,因此这不是预测——任何从历史数据出发的检验都不可能是预测。它告诉您的是:这个优势是否依赖于价格的某一种特定排列,以及回测数字距离典型结果有多远。在投入资金之前,这才是值得回答的问题。 三个步骤 1. 构建。在图表上选择时间区间和世界数量,然后按 Build。EA Overfitter 会
Exp COPYLOT CLIENT for MT5
Vladislav Andruschenko
3.97 (35)
适用于 MetaTrader 5 的专业交易复制器 快速、专业、稳定可靠的 交易复制器 ,适用于 MetaTrader 。 COPYLOT 可在 MT4 和 MT5 终端之间复制 Forex 交易,并支持 Hedge 和 Netting 账户。 COPYLOT 的 MT5 版本支持: - MT5 Hedge → MT5 Hedge - MT5 Hedge → MT5 Netting - MT5 Netting → MT5 Hedge - MT5 Netting → MT5 Netting - MT4 → MT5 Hedge - MT4 → MT5 Netting MT4 版本 完整说明 + DEMO + PDF 如何购买 如何安装 如何获取日志文件 如何测试和优化 Expforex 的所有产品 您也可以将交易复制到 MT4 终端(MT4 → MT4,MT5 → MT4): COPYLOT CLIENT for MT4 COPYLOT 是一款专业的交易和持仓复制器,可同时与 2、3 甚至 10 个终端协同工作。 支持从 模拟账户和投资者账户 复制,也支持同时在多个终端上运行。 您可以使
HINN MagicEntry Extra
ALGOFLOW OÜ
4.74 (19)
HINN MAGIC ENTRY – the ultimate tool for entry and position management! SIMPLE. FASTEST. INTUITIVE. MAX AUTOMATED. Place orders by selecting a level directly on the chart! full description   ::  demo-version  :: 60-sec-video-description Key features: - Market, limit, and pending orders - Automatic lot size calculation - Automatic spread and commission accounting - Unlimited partitial take-profits  - Breakeven and trailing stop-loss and take-profit  functions - Invalidation leves - Intuitive, a
Welcome to ENTRY IN THE ZONE WITH SMC MULTI TIMEFRAME Entry In The Zone and SMC Multi Timeframe is a real-time market analysis tool based on Smart Money Concepts (SMC), designed to analyze market structure, price direction, and key trading zones. It supports both Single-Timeframe Analysis and Multi-Timeframe Analysis, providing a clearer view of the overall market structure across multiple timeframes, with real-time BUY / SELL signals that do not repaint. It is designed to help filter trading op
Grid Manual MT5
Alfiya Fazylova
4.73 (22)
Grid Manual是一个交易面板,用于处理订单网格。 该实用程序是通用的,具有灵活的设置和直观的界面。 它不仅可以在亏损方向上设置订单网格,还可以在盈利方向上设置订单网格。 交易者不需要创建和维护订单网格,实用程序会这样做。 打开一个订单就足够了,Grid manual会自动为它创建一个订单网格,并伴随它直到非常关闭。 完整说明和演示版 此處 。 该实用程序的主要特性和功能: 伴隨以任何方式打開的訂單,包括從移動終端打開的訂單。 適用於兩種類型的網格:“限制”和“停止”。 使用兩種方法計算網格間距:固定和動態(基於 ATR 指標)。 允許您更改未結訂單網格的設置。 顯示圖表上每個網格的盈虧平衡水平。 顯示每個網格的利潤率。 允許您一鍵關閉網格中的盈利訂單。 讓您一鍵關閉每個訂單網格。 允許您對訂單網格應用追踪止損功能。 允許您在訂單網格上應用將訂單網格的止損轉移到盈虧平衡水平的功能。 相對於訂單網格的盈虧平衡水平自動重新排列止盈(僅在限價網格模式下,距離取決於所選的計算類型:“保守”或“激進”)。 最多可管理 20 個訂單網格,每個網格最多可包含 100 個訂單。 計算初始手數時,
Seconds Chart MT5
Boris Sedov
4.61 (18)
秒级图表 (Seconds Chart) - 一款专为 MetaTrader 5 设计的独特工具,用于创建秒级时间框架的图表。 通过 秒级图表 ,您可以构建以秒为单位的时间框架图表,获得标准分钟或小时图表无法提供的极致灵活性和分析精度。例如,时间框架 S15 表示每根蜡烛图持续15秒。您可以使用任何支持自定义交易品种的指标和EA交易系统。操作它们就像在标准图表上交易一样方便。 与标准工具不同, 秒级图表 让您能够在超短时间框架下进行高精度交易,无延迟干扰。 免费演示版: Seconds Chart v2.29 Demo.ex5 下载免费演示版,亲自体验: 功能齐全 - 所有功能均可使用 24小时测试 - 足够评估准确性和便利性 仅限模拟账户 - 大多数经纪商均可轻松开立 仅限GBPCAD图表 - 大多数终端均可使用 这些限制仅适用于演示版。完整版适用于任何账户类型(真实、演示、竞赛)和任何图表(XAUUSD、EURUSD 等),无任何限制。 如何安装演示版 通过上方链接下载演示文件 打开MetaTrader -> 文件 -> 打开数据文件夹 -> MQL5 -> Experts 将下
The product will copy all telegram signal to MT5 ( which you are member) , also it can work as remote copier.  Easy to set up, copy order instant, can work with almost signal formats, image signal,  s upport to translate other language to English Work with all type of channel or group, even channel have "Restrict Saving Content", work with  multi channel, multi MT5 Work as remote copier: with signal have ticket number, it will copy exactly via ticket number. Support to backtest signal. How to s
Signal TradingView to MT5 Pro Automator TradingView 与 MetaTrader 5 之间的即时专业执行 使用最强大的桥梁,将 TradingView 警报与 MT5 中的实际执行连接起来,实现交易策略的自动化。这款 Expert Advisor 专为要求速度、灵活性和完美风险管理的交易者设计,可将任何警报消息转化为精确的市价或限价订单。 优势与特点 通用解析引擎(专有): 先进技术,能够自动识别并提取任何警报格式中的数据。您不再受限于单一的死板格式;系统会自动理解交易品种(Symbol)、操作(Action)、价格(Price)、止损(SL)和止盈(TP)。 实时执行: 极速轮询技术(低于 1 秒),经过优化可将延迟降至最低。接收到信号后,订单将在毫秒内执行。 机构级风险管理: 基于以下方式自动精确计算手数: 净值/余额百分比(% of Equity/Balance): 每笔交易承担固定账户百分比的风险。 风险金额(Risk Amount): 设定在触发止损时损失的固定货币金额(例如:100 美元)。 固定手数(Static Lots)
Trade Dashboard MT5
Fatemeh Ameri
4.95 (132)
疲于复杂的订单下达和手动计算?Trade Dashboard 是您的解决方案。凭借其用户友好的界面,订单下达变得轻而易举,只需点击一下,您就可以开设交易、设置止损和止盈水平、管理交易手数,并计算风险回报比,让您只需专注于您的策略。告别手动计算,使用 Trade Dashboard 简化您的交易体验。 立即下载演示版本 。 您可以在这里找到仪表盘功能和特性的详细信息 。 加入 Telegram 频道 。 购买后请给我发消息以获取支持。如果您需要添加更多功能,可以在产品的评论区留下您的想法,我愿意听取任何建议,希望您能在使用我的产品时获得最佳体验 。 这是 MT4 版本。 风险管理:使用 Trade Dashboard,可以将您的风险设置为账户余额或权益的百分比,或将风险设置为总金额。在图表上直观地定义您的止损,让工具准确计算每个货币对的适当手数。该工具还可以根据您期望的风险回报比自动设置止盈水平。它甚至可以在手数计算中涵盖佣金和点差费用。此外,您的止损和止盈可以转变为虚拟水平,隐藏于经纪商。通过 Trade Dashboard 的高级风险管理功能,掌控风险,保护您的资本。 交易线
FUTURES ORDERFLOW FOOTPRINT CHART Professional OrderFlow EA for MetaTrader 5 Version 1.01| Professional tool for real traders | Institutional-Grade Visualization STRATEGY TESTER USERS - PLEASE SELECT EVERY REAL TICK WHEN TESTING AND YOU HAVE DOWNLOADED HISTORICAL DATA. IF YOU SEE A WAITING SCREEN AND IT IS NOT DOWNLOADING, IT MEANS YOU HAVE LOW HISTORICAL DATA. TRY 1 MIN AND 5 MIN FIRST ON 1 DAY DATA. ONE DAY DATA SHOULD BE THE NEWEST AND MOST CURRENT DATE. PLEASE WAIT UNTIL THE MARKET HAS ROL
Footprint Chart Pro — Professional OrderFlow EA for MetaTrader 5 Version 6.34 | Professional tool for real traders | Institutional-Grade Visualization DEMO USERS - PLEASE SELECT EVERY TICK / REAL TICK WHEN TESTING AND YOU HAVE DOWNLOADED HISTORICAL DATA. IF YOU SEE A WAITING SCREEN AND IT IS NOT DOWNLOADING, IT MEANS YOU HAVE LOW HISTORICAL DATA. TRY 1 MIN AND 5 MIN FIRST ON 1 DAY DATA. ONE DAY DATA SHOULD BE THE NEWEST AND MOST CURRENT DATE. PLEASE WAIT UNTIL THE MARKET HAS ROLLED OVER PERIOD.
Trade Copier Ultimate
Janitha Sandaruwan Amaradasa Wickramasingha Arachchilage
5 (5)
Trade Copier Ultimate - Telegram 到 MT5 信号复制器 Trade Copier Ultimate 可将 Telegram 交易信号自动复制到 MetaTrader 5。EA 能读取信号消息,识别交易品种、订单类型、入场价格、止损、止盈目标以及部分更新指令,然后根据您设置的手数和风险参数,在 MT5 中执行或管理交易。 它不只是一款基础的 Telegram 到 MT5 跟单工具。TCU 还支持 Telegram Bot API 和用户账户 Bridge 工作流程、Discord 信号路由、本地 MT5 到 MT5 跟单、将 MT5 交易广播到 Telegram 或 Discord、图片信号识别、最多 TP5 的多止盈执行、TP OPEN 跑单仓位、虚拟多止盈模式、入场区间处理、挂单、经纪商交易品种匹配以及 Prop Firm 风险控制。 其他资料与使用说明 下载免费演示版  -  快速设置与使用手册  -  下载 NTS Bridge    点击这里测试您的信号格式 --->>> 免费演示版:   购买前可在模拟账户上测试完整的 EA 和 Brid
Timeless Charts
Samuel Manoel De Souza
5 (8)
Timeless Charts is an all-in-one trading utility for professional traders. It combines custom chart types such as Seconds Charts and Renko with advanced order flow analysis using Footprints , Clusters , Volume Profiles , VWAP studies, and anchored analysis tools for deeper market insight. Trading and position management are handled directly from the chart through an integrated trade management panel , while Market Replay and Virtual Accounts provide environments for practicing trading skills and
MT5 to Telegram Signal Provider 是一个易于使用且完全可自定义的工具,它允许向 Telegram 的聊天室、频道或群组发送 指定 的信号,将您的账户变为一个 信号提供商 。 与大多数竞争产品不同,它不使用 DLL 导入。 [ 演示 ] [ 手册 ] [ MT4 版本 ] [ Discord 版本 ] [ Telegram 频道 ]  New: [ Telegram To MT5 ] 设置 提供了逐步的 用户指南 。 不需要了解 Telegram API;开发者提供了您所需的一切。 关键特性 能够自定义发送给订阅者的订单详情 您可以创建分层的订阅模型,例如铜、银、金。其中金订阅获得所有信号等。 通过 id、符号或评论过滤订单 包括执行订单的图表截图 在发送的截图上绘制已关闭的订单,以便额外核实 延迟发送新订单消息的可能性,以便在发送前对位置进行调整 订单详情完全透明: 新的市场订单*带截图 订单修改(止损、获利) 已关闭的订单*带截图 部分关闭的订单** 新的挂单 修改的挂单(进场价格) 挂单激活(作为新的市场订单附加) 已删除的挂单 历史订单报告
Trade Indicator Assistant   is a powerful MT5 utility designed to turn indicators into automated trading systems. Its main feature is the ability to automatically detect an indicator’s   BUY and SELL signal buffers , without requiring you to know the buffer numbers, search through indicator settings, or modify the indicator source code. Bonus Indicator:   After purchasing Trade Indicator Assistant, contact me to receive   Trade Signal Pro   completely free as a bonus indicator. [Download Demo V
MetaTrader 5 专业交易面板 —— 图表与键盘一键交易的高效控制中心 一款面向主动交易者的专业 Trading Panel,可让您比标准 MetaTrader 操作方式更快、更直观地完成开仓、平仓、修改、管理与控制。 这不是一个普通的小工具,而是一个为高频手动操作、仓位管理、挂单控制与利润管理而设计的完整交易工作台。 通过这套面板,您可以直接在图表上一键执行交易,通过键盘快速触发核心操作,并借助自动参数计算、图形提示、信息标签以及可视化管理功能,大幅减少重复性操作,让整个交易流程更加流畅、高效且专业。 使用我们的交易面板,您可以直接从图表上一键下单,执行交易操作的速度可比标准 MetaTrader 控件快约 30 倍。 全新高级版本现已推出: 使用 VirtualTradePad PRO SE 升级您的交易流程 — 适用于 MetaTrader 5 和 MetaTrader 4 的新一代专业交易面板。 MT4 版本 | 完整说明 + DEMO + PDF | 如何购买 | 如何安装 | 如何获取日志文件 | 如何测试与优化 | Expforex 的所有产品 为什么交易者会
Anchor Trade Manager
Kalinskie Gilliam
5 (9)
Your EAs cannot see each other, but Anchor can. Anchor gives you one place to coordinate your EAs, manage risk, and decide when trading is allowed. It works alongside the trading bots you already use without any changes to them. The Problem One EA opens a trade. Then another starts trading. The next thing you know, you wake up to multiple grids built across your account. Each EA may be doing exactly what it was designed to do, but together they can place far more risk on your account than you in
Trade Manager DashPlus
Henry Lyubomir Wallace
4.85 (13)
DashPlus 是一款先进的交易管理工具,旨在提升您在 MetaTrader 5 平台上的交易效率和效果。它提供一整套功能,包括风险计算、订单管理、先进的网格系统、基于图表的工具和绩效分析。 主要功能 1. 恢复网格 实施一个平均和灵活的网格系统,以在不利的市场条件下管理交易。 允许设置战略性进出点,以优化交易恢复。 2. 叠加网格 通过在强劲的市场波动中增加仓位,最大化有利交易的潜在回报。 帮助您通过扩展获利交易来利用趋势市场。 3. 盈亏线 在图表上直接提供潜在利润和损失场景的可视化表示。 调整设置并拖动盈亏线,以在执行之前评估各种交易结果。 4. 篮子模式 简化同一交易品种的多仓位管理,将它们合并为一个聚合仓位。 基于平均价格,便于监控和应用止损、止盈以及其他订单修改。 5. 图表上的新闻 将预定的经济新闻事件整合到您的交易图表中。 帮助您随时掌握可能影响市场波动的即将发生的事件,从而更好地规划交易。 6. 警报 设置基于时间或价格的警报,通知会显示在 MT5 中,或通过 MT5 应用发送到您的移动设备。 对监控关键价格水平或重要的交易时段非常有用。 7. 绩效统计 提供详细的
作者的更多信息
This product can be used to synchronize multiple Charts, and each Chart can be set to a different sync mode. With this product you can better view and manipulate charts: different time frames for a single Symbol, the same time frame for multiple Symbols... and more. PS: The link below is the FreeDemo product, you can use it on EURUSD/XUAUSD/USDCNH symbol: https://www.mql5.com/en/market/product/38557 Feature: Chart settings  can be synchronized, including : background, indentation, size, etc. M
Do you think it's a bit cumbersome when you need to switch symbols or timeframes with mouse click? 1. What is this? This is a program that can switch symbols and timeframes with direction keys. Fast switching, very convenient, no mouse click required. For traders, one symbol with multi-timeframe charts are usually added,  you can change symbol on those charts easily. For multi-currency traders, different symbol charts are usually added, you can also change those timeframes easily. I wrote this p
1.这是什么         上涨波动和下降波动是不一样的,无论是学术研究还是实际检验都说明了这一点。         原始的ATR指标是把上涨波动和下降波动放在一起进行计算。本指标则是把上涨波动和下降波动分开进行计算,这样能更好的帮助你研究市场。 2.指标说明         本指标的计算有两种模式,如下表所示: 0 1 2 3 4 5 波动方向 + - + + - + TR 15 20 17 5 16 8 原始ATR (15+20+17+5+16+8)/6=13.5 模式1 不以0填充位置,周期数改变 模式1上涨TR 15 17 5 8 模式1下跌TR 20 16 模式1上涨ATR (15+17+5+8)/4=11.25 模式1下跌ATR (20+16)/2=18 模式2 以0填充位置,周期数不变 模式2上涨TR 15 0 17 5 0 8 模式2下跌TR 0 20 0 0 16 0 模式2上涨ATR (15+0+17+5+0+8)/6=7.5 模式2下跌ATR (0+20+0+0+16+0)/6=6         如上表。比如周期为6的序列中,有4个上涨2个下跌。模式1不
1.这是什么: 下载Market Watch中所有的Symbol数据到系统。PS:不是把数据输出到文档。 2.为什么要用这个: 如果系统中没有数据:网络链接不好的时候,用MT5看一个Symbol需要等待很长时间;在不同Symbol或不同TimeFrame切换,如果系统没有数据也需要等待很久;如果进行长时间回测,系统没有数据,需要下载很长时间。 所以提前把历史数据下载到系统中,能提高工作效率。 3.怎么使用: parameters: input bool bool_usualtimeframe=true; //true-系统默认TimeFrames; || false-所有的TimeFrames. input bool bool_allSymbol=true; //true-Market Watch中所有品种; || false-根据你的输入 input string input_Symbol=NULL; //上面参数为false时,输入你的Symbol名称 input datetime time_Start=D'2017.01.01'; //默认数据下载开始时间 input int s
Do you think it's a bit cumbersome when you need to switch symbols or timeframes with mouse click? 1. What is this? This is a program that can switch symbols and timeframes with direction keys. Fast switching, very convenient, no mouse click required. For traders, one symbol with multi-timeframe charts are usually added,  you can change symbol on those charts  easily . For multi-currency traders, different symbol charts are usually added, you can also change those timeframes easily. I wrote thi
According to trading experience: Some symbols are easy to reverse on certain days, such as Monday, or afternoon, and so on. So comparing the current price with the corresponding historical moment price is valuable. If the price coordinate system uses a logarithmic price, you will get a lot of valuable information. 1. What is this? This program can convert the symbol price and add it to your Chart. You can compare it with your major chart. The DEMO version Link: https://www.mql5.com/en/market/pr
What is this: Violent trading: means sending a large number of orders to your brokerage server,  it can conduct a stress test of the trading. In this program you can run a variety of trading tests.  Now you can trade at high speed, For example 1000 orders in an instant. The Demo version's link:  https://www.mql5.com/en/market/product/38431/ Why to use: Whether manual trading or EA trading,  the status of the broker server is very important. So it is beneficial to conduct a trading stress test on
1. Why did I develop this series of indicators I found that most traders need to use multiple time frame indicators. They usually switch time frame to see indicators. However, once the timeframe is switched, you cannot see the  corresponding relationship  between  the price in the smaller timeframe  and  the indicator in the larger timeframe . For example: if your price chart is in H1 timeframe, you can see H4, D1 and W1 indicators in H1 timeframe Chart. This is more helpful for you to find th
筛选:
无评论
回复评论