Racing Game 3D

# Racing Game 3D - Candlestick-Driven 3D Racing Game 🎮🏎️

`Racing_Game_3D` is an innovative 3D racing game script running inside the MetaTrader 5 (MT5) platform. the game's core highlights include **generating highly winding 3D tracks from the real-time candlestick data (OHLC) of the current chart**, rendering with native DirectX 3D APIs, implementing interactive item boxes, and racing head-to-head against 5 CPU opponents.

---

## 🌟 Key Concepts & Features

1. **K-Line Driven 3D Winding Track**
   * The script queries historical candlesticks from the active symbol (skipping the uncompleted newest bar).
   * The body size of each candlestick (Close - Open) determines the lateral curve offset of that road segment. **The more volatile the market, the twistier and more challenging the race track becomes**.
   * A built-in centering pull calculation creates dynamic slalom-style curves while preventing the track from drifting away infinitely.

2. **Native DirectX Rendering Engine**
   * Operates via MetaTrader 5's internal `DXContext` interface, combined with a custom vertex shader (`Shaders/vertex.hlsl`) and pixel shader (`Shaders/pixel.hlsl`) for GPU-accelerated 3D projection.
   * Feeds the pixel shader with a `PSInputBuffer` struct, conveying resolution, time, player coordinates, 5 AI competitor coordinates, local track curvature arrays, active item boxes, and flying projectiles.

3. **Power-Ups & Combat System**
   * Item boxes are distributed every 30 meters along the road, containing three distinct abilities:
     * 🟦 **Blue Box (Speed Boost)**: Grants nitro acceleration, significantly boosting top speed for 3.0 seconds.
     * 🟥 **Red Box (Trap)**: Triggers a spin-out trap, slowing down the car to 2 km/h and disabling steering for 1.5 seconds.
     * 🟨 **Yellow Box (Flame Shot)**: Awards a fireball. Press **[SHIFT]** to fire it forward.
   * Fireballs follow the curved track lines. Colliding with a vehicle disables them for 1.5 seconds.

4. **Intelligent AI Competitors**
   * Race against 5 computer-controlled CPU cars.
   * AI vehicles possess different baseline speeds, shift lanes to dodge obstacles, seek blue speed boxes, and fire fireballs when they get close behind the player or other opponents.

5. **Realistic Physics & Visual Polish**
   * **3D Yaw Angle**: Computes real-time tilt/yaw angle of the cars based on steering velocity, delivering immersive steering animations.
   * **Wall Collisions & friction**: Staying outside the track boundaries (`ROAD_HALF_WIDTH` = 6.0m) slows down the vehicle. Colliding with other racers slows down the car and triggers push-back physics.
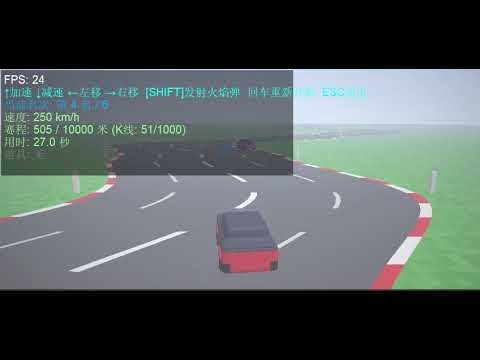
   * **Translucent HUD Backdrop**: Ensures HUD texts are readable against bright skies or green grass fields.

---

## 🕹️ Controls Guide

* **↑**: Accelerate.
* **↓**: Decelerate / Reverse.
* **←** and **→**: Steer left and right.
* **SHIFT**: Launch Fireball (Requires holding a yellow fireball power-up).
* **Enter**: Reset/Restart the race.
* **ESC**: Exit the game and restore the default chart view.

---

## 🛠️ Code Architecture

1. **`rates[]` Copy & Track Construction**
   * Copy candlestick data from index 1 using `CopyRates`.
   * Calculates `rates[i].close - rates[i].open` to define curvature offsets and saves them into the global `RoadOffsets[]` array.

2. **`PSInputBuffer` Shader Buffer**
   * Packs active render inputs (resolutions, absolute coordinates, AI vehicle vectors, 32 local road offsets, nearest box objects, projectile lists) and registers it to the pixel shader.

3. **`UpdateGame(double dt)` Physics Loop**
   * Manages speeds, cooldowns, natural deceleration, and drag.
   * Computes absolute 3D world coordinates for all cars.
   * Interpolates road centers with `GetRoadXCPU(z)` to enforce boundaries.
   * Runs projectile trajectories, hitboxes, and car-to-car collision logic.
   * Defines win/loss triggers based on the finish line (`FinishLineDistance`).

4. **Frame Rendering (`DXDrawIndexed` + Bitmaps)**
   * Flushes depth, increments shader timelines, and calls `DXDrawIndexed`.
   * Exports framebuffers to the CPU `image[]` array via `DXContextGetColors`.
   * Overlays HUD texts (race stats, speeds, timings, and item active durations) before updating the chart graphical object.

---

## ⚙️ Configuration Parameters

Adjust these inputs when launching the script:

* **InputKLineCount** (`Track Candlesticks`): Default `1000`. Sets the level's length.
* **CurveIntensity** (`Curvature Intensity`): Default `2.5`. Higher coefficients result in tighter and sharper corners.
* **SegmentLength** (`Segment Depth`): Default `10.0` meters. Represents the physical length of each candlestick segment in 3D space.

---

## 🚀 How to Run

1. Open MetaTrader 5.
2. Select your desired symbol and timeframe (e.g., GBPUSD, M15).
3. Browse the "Navigator" tree: **Scripts -> My_Scripts -> 3D动画 -> Racing_Game_3D**.
4. Double-click or drag `Racing_Game_3D` onto the chart.
5. Set parameters in the dialog window, then click "OK".
6. The trading chart will hide, and the race will start. Press **ESC** at any time to exit.

---


제작자의 제품 더 보기
1. Why did I develop this series of indicators I found that most traders need to use multiple time frame indicators. They usually switch time frame to see indicators. However, once the timeframe is switched, you cannot see the  corresponding relationship  between  the price in the smaller timeframe  and  the indicator in the larger timeframe . For example: if your price chart is in H1 timeframe, you can see H4, D1 and W1 indicators in H1 timeframe Chart. This is more helpful for you to find th
This product can be used to synchronize multiple Charts, and each Chart can be set to a different sync mode. With this product you can better view and manipulate charts: different time frames for a single Symbol, the same time frame for multiple Symbols... and more. PS: The link below is the FreeDemo product, you can use it on EURUSD/XUAUSD/USDCNH symbol: https://www.mql5.com/en/market/product/38557 Feature: Chart settings  can be synchronized, including : background, indentation, size, etc. M
Do you think it's a bit cumbersome when you need to switch symbols or timeframes with mouse click? 1. What is this? This is a program that can switch symbols and timeframes with direction keys. Fast switching, very convenient, no mouse click required. For traders, one symbol with multi-timeframe charts are usually added,  you can change symbol on those charts easily. For multi-currency traders, different symbol charts are usually added, you can also change those timeframes easily. I wrote this p
1. What is this         Rising volatility and falling volatility are not the same, whether it is academic research or actual testing has shown this point.         The original ATR indicator is calculated by putting up and down fluctuations together. This indicator is to calculate separately the upward volatility and the downward volatility, which can better help you study the market. 2. Indicator description          There are two modes for the calculation of this indicator, as shown in the fo
Have you ever take a long time to watch a Symbol when the network link is not good ? Have you ever wait for a long time when you switch chart between different Symbols or different TimeFrames ? If you do long-term backtesting , Have you ever to be downloaded datas for a long time ? Yes, If there is no data in the system, those will happen.  1. What is this: Download all the Symbol data in Market Watch to the system. PS: This is not outputting data to Files. This Link go to Demo version: https:/
This product can be used to synchronize multiple Charts, and each Chart can be set to a different sync mode. With this product you can better view and manipulate charts: different time frames for a single Symbol, the same time frame for multiple Symbols, system indicators for single/multiple Symbols... and more. Feature: Chart settings can be synchronized, including : background, indentation, size, etc. Multiple Chart window start times  or end times can be synchronized. Multiple Chart time fr
I see that many tools in the market deal with Position and Order in the form of operation panels. Which is loaded into a Chart in the form of an EA. However, once the operator panel EA is loaded, no other EAs can be loaded. So, I wrote the one-click operation of Position and Order as a script, so you can load other EAs and easily complete one-click operation of Trade. 1. What is this: This is a one-click script to close position order. Now you can close position tickets at high speed, for examp
I see that many tools in the market deal with Position and Order in the form of operation panels. Which is loaded into a Chart in the form of an EA. However, once the operator panel EA is loaded, no other EAs can be loaded. So, I wrote the one-click operation of Position and Order as a script, so you can load other EAs and easily complete one-click operation of Trade. 1. What is this: This is a one-click script to delete the pending order . Now you can delete pending tickets at high speed, for
Do you think it's a bit cumbersome when you need to switch symbols or timeframes with mouse click? 1. What is this? This is a program that can switch symbols and timeframes with direction keys. Fast switching, very convenient, no mouse click required. For traders, one symbol with multi-timeframe charts are usually added,  you can change symbol on those charts  easily . For multi-currency traders, different symbol charts are usually added, you can also change those timeframes easily. I wrote thi
According to trading experience: Some symbols are easy to reverse on certain days, such as Monday, or afternoon, and so on. So comparing the current price with the corresponding historical moment price is valuable. If the price coordinate system uses a logarithmic price, you will get a lot of valuable information. 1. What is this? This program can convert the symbol price and add it to your Chart. You can compare it with your major chart. The DEMO version Link: https://www.mql5.com/en/market/pr
What is this: Violent trading: means sending a large number of orders to your brokerage server,  it can conduct a stress test of the trading. In this program you can run a variety of trading tests.  Now you can trade at high speed, For example 1000 orders in an instant. The Demo version's link:  https://www.mql5.com/en/market/product/38431/ Why to use: Whether manual trading or EA trading,  the status of the broker server is very important. So it is beneficial to conduct a trading stress test on
1. Why did I develop this series of indicators I found that most traders need to use multiple time frame indicators. They usually switch time frame to see indicators. However, once the timeframe is switched, you cannot see the  corresponding relationship  between  the price in the smaller timeframe  and  the indicator in the larger timeframe . For example: if your price chart is in H1 timeframe, you can see H4, D1 and W1 indicators in H1 timeframe Chart. This is more helpful for you to find th
필터:
리뷰 없음
리뷰 답변