Candle Pivot Points Control Et

Candle Pivot Points v8.3 — Impulse Detector Through Sequential Pivot Points

This price

momentum indicator visualizes directional movement through a sequence of control points (pivots) with a customizable step size. Point color shows the direction of the impulse, count shows its strength and length.

---

DESCRIPTION

CandlePivotPoints builds an adaptive pivot point grid from the candle open. When price consistently passes a defined number of points in one direction, the indicator confirms a linearity (impulse sequence). Confirmed linearity is displayed as colored dots on the chart: green for upward movement (BUY), red for downward movement (SELL), gray for rollback or noise points.

The indicator includes a built-in legend with detailed statistics for the current candle and historical analysis over the last N bars (200 by default). Closed candles display markers showing the direction and length of the best impulse sequence per candle — making it easy to visually assess the quality of past movements and identify recurring patterns. This makes CandlePivotPoints a practical candle analysis tool for any trading style.

---

MODES OF OPERATION

1. Base Mode
Fixed grid step. The indicator works fully standalone without additional tools. Simply configure three parameters: step size, minimum linearity length, and maximum rollback. Ideal for quick testing and getting familiar with the impulse sequence concept.

INTERACTION WITH THE CVET SYSTEM
The indicator operates independently. When used in conjunction with other CVET System tools, its capabilities are expanded:

Candle Volatility ET Classifier — filter by candle size class (Small → XL). Statistics and signals are calculated only for candles of the desired volatility.

Candle Time Phases — a filter based on candle development phase. Allows you to analyze only mature, confirmed movements of the desired phase.

Candle Body Power - indicator classifies the strength of each candlestick's body in real time, measuring the body's ratio to the full High-Low range.

2. ET Adaptive Step Mode

In this mode the grid step automatically adjusts to current candle volatility based on candle classification. This turns CandlePivotPoints into a true volatility adaptive indicator that responds to changing market conditions.

To use this mode you must additionally install the Candle Volatility ET Classifier indicator (available for free) on the same chart and the same timeframe, and configure it to match your working period.

 IMPORTANT: If you already have the Candle Volatility ET Classifier installed, please download and install its latest updated version before using CandlePivotPoints in ET Adaptive mode. The updated version includes improvements required for correct communication between the two indicators.

Two sub-modes are available:
— CURRENT: step updates in real time as the candle class changes
— PREDICTION: step is fixed at candle open based on the predicted class and does not change until the candle closes

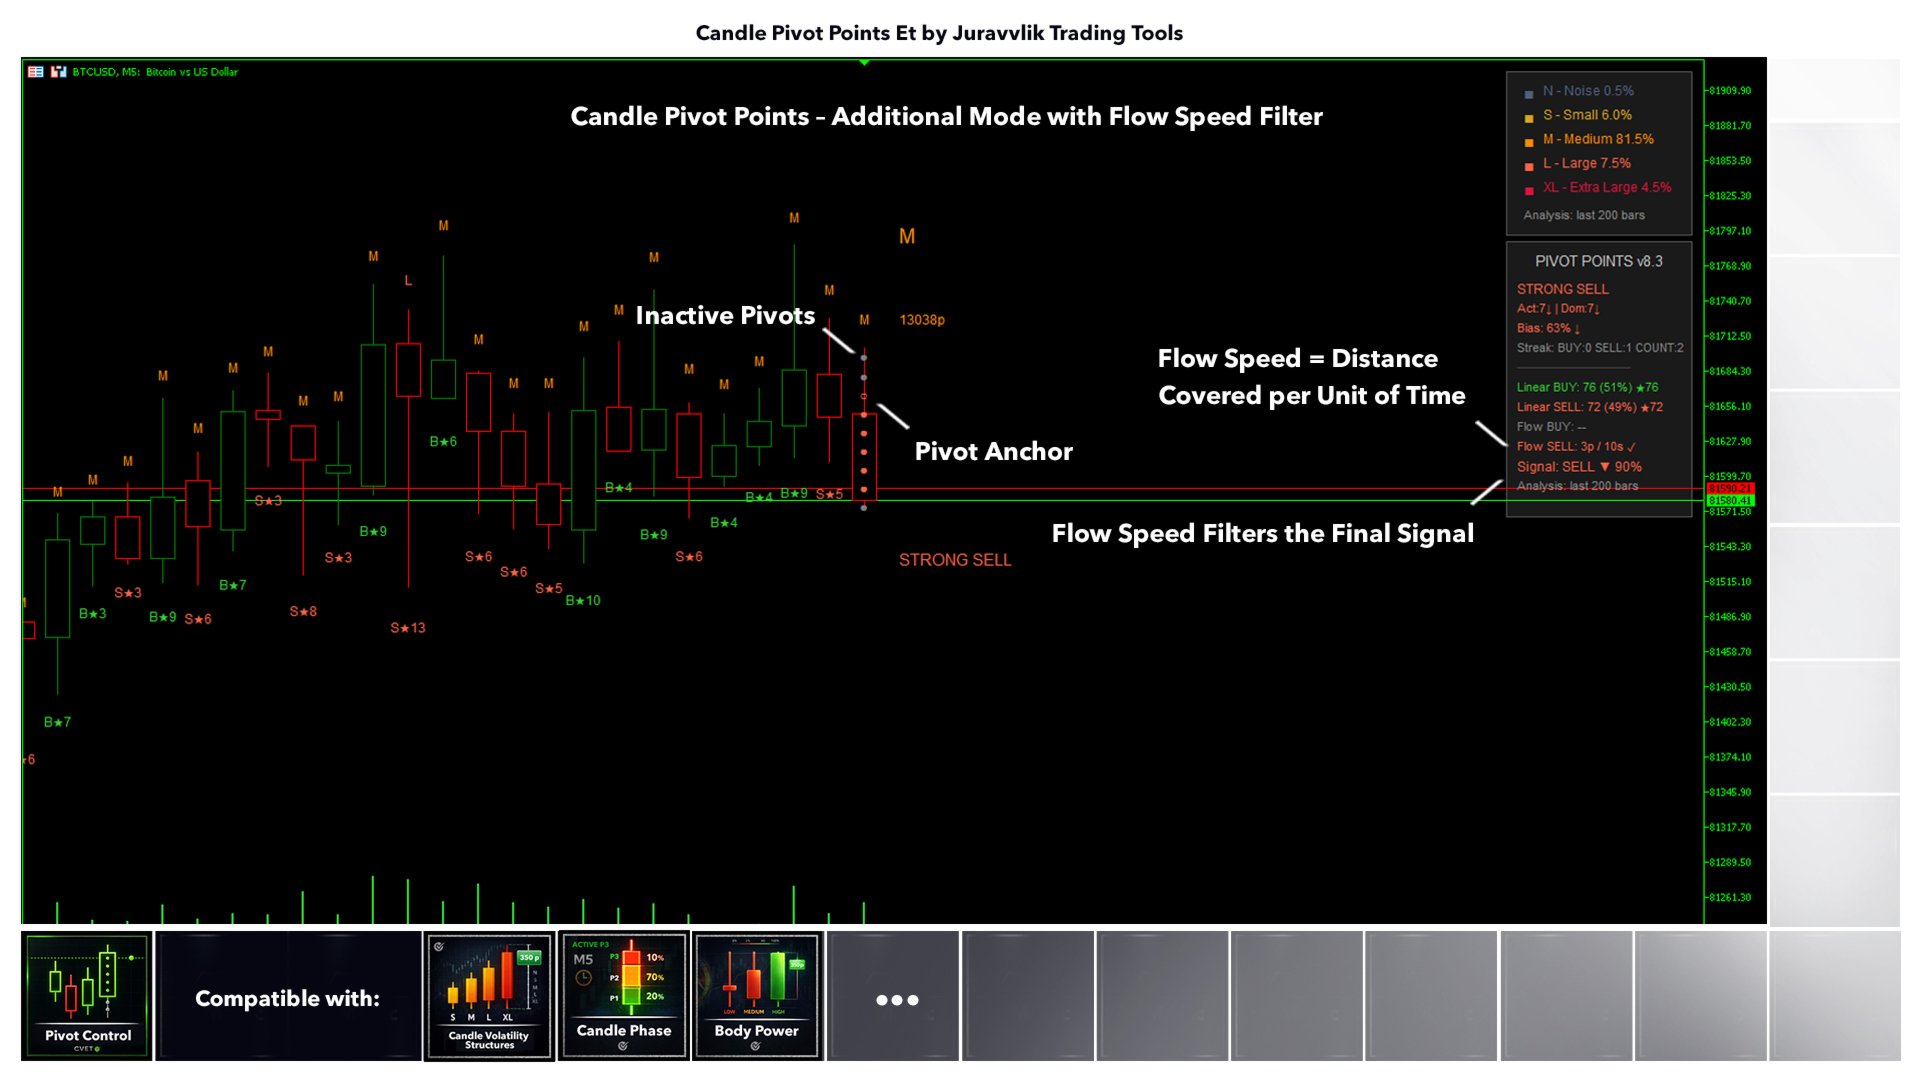
3. Flow Speed Filter
An additional noise filter that analyzes the speed at which control points are passed. A signal is only issued when a defined number of points is completed within an allowed time window. This helps filter out slow and choppy price action, leaving only genuine trend strength signals.

---

INPUT PARAMETERS

=== Timeframe ===
Target Period — working timeframe of the indicator. Must match the chart timeframe.

=== Pivot Points ===
Step Size (points) — grid step in points. The primary parameter to calibrate for your instrument and timeframe. This defines the sensitivity of the pivot point grid.
Hysteresis Ratio — hysteresis coefficient (0.0–1.0). Defines the insensitivity zone when transitioning between grid levels. Helps avoid false switches on market noise.

=== Linearity ===
Min Points to Confirm Linearity — minimum number of control points required to confirm a linearity (impulse sequence). Higher values result in stricter filtering and fewer but stronger signals.
Max Rollback — maximum allowed rollback in points within a linearity. If exceeded, the linearity is considered broken. Acts as an internal noise filter for the sequence.

=== ET Signal Filter ===
Use ET Class Filter for Signal — enable signal filtering by candle class. Signal is only issued if the current candle meets the minimum class requirement.
Min ET Class for Signal — minimum candle class required to allow a signal (Noise / Small / Medium / Large / XL).

=== ET Adaptive Step ===
Enable ET Adaptive Step — enable adaptive step through the candle classifier.
Step Mode — step update mode: CURRENT (real-time updates) or PREDICTION (fixed at candle open).
Step for Noise / Small / Medium / Large / XL (points) — grid step in points for each candle volatility class.

=== Flow Speed Filter ===
Enable Flow Speed Filter — enable the flow speed filter.
Number of Peaks per Cycle — number of control points in one measurement cycle.
Max Seconds for Cycle — maximum time in seconds for a cycle to complete. If completed faster, the movement is considered a valid impulse.

=== Signal ===
Enable Signal — enable the signal line in the legend showing direction and linearity quality as a percentage.
Popup Alert — popup alert when a signal appears.
Push Notification — push notification to mobile device.

=== Display ===
Show Pivots — display control points on the chart.
Show Markers — display markers on closed candles.
Show Live Label — display a text label of the current state on the chart.
Show Legend — display the statistics legend.
Legend Mode — legend display mode: SIMPLE (compact) or FULL (detailed with full statistics).
Legend Top Offset — vertical offset of the legend in pixels.

=== Statistics ===
Analysis Bars — historical analysis depth in bars for linearity statistics.

---

WHY THIS INDICATOR IS USEFUL

CandlePivotPoints helps you visually identify the presence and quality of directional price movement in real time — directly inside the current candle. It is designed for traders who work with impulse movements and want to see not just direction, but the strength, purity, and speed of the current move.

As a trend strength indicator it gives you an objective measure of how consistently price is moving in one direction. The built-in historical statistics let you evaluate how often clean directional sequences occur on a given instrument and timeframe, and which direction tends to dominate. This makes it useful both as a standalone analysis tool and as an entry filter combined with other strategies.

Whether you are looking for a reliable noise filter indicator to avoid choppy markets or a tool to confirm genuine momentum before entering a trade, CandlePivotPoints provides a clear and structured view of price behavior at the candle level.

---

QUICK START (author's tip)

For your first experience with the indicator, start with base mode — no ET adaptive step, no Flow filter. You only need to configure three parameters:

1. Step Size — calibrate the step for your instrument and timeframe. For BTCUSD on M5 a good starting point is 1500–2000 points. For other instruments adjust empirically by observing how the pivot points track price movement.

2. Min Points to Confirm Linearity (impulse sequence) — recommended starting value: 3–4. This is the minimum number of points price must pass consecutively for a linearity to be confirmed.

3. Max Rollback — recommended starting value: 1–2. The allowed rollback within a linearity before it breaks. At value 2 the linearity tolerates up to two points of pullback without breaking.

All other parameters can be left at their defaults. ET Adaptive Step and Flow Filter modes are disabled by default and can be activated separately when you are ready for more advanced configuration.


Stay tuned for updates, new tools and application ideas

Telegram: cvet_system


For an additional fee, I can modify (personalize) it to suit your needs.

If you found this tool useful, please don't forget to leave a review.


Author profile: [ juravvlik ]


If you find this tool useful, you can support the author:

USDT TRC20: TJXEz5BZZCJabuV6x5Ytx4nuLE2oV7V9a8

USDT BNB (BEP 20): 0x7Ee318aCD53cFC290541C9964fC437cE597169BF

推荐产品
Uno Quant Trader
Mark Joseph Borromeo Juan
UNO Quant Trader UNO Quant Trader is a premium market-bias and trade-planning indicator built for traders who want cleaner decisions, faster chart reading, and a professional dashboard view. This indicator uses a multi-layer mathematical market model designed to analyze price behavior, momentum pressure, imbalance zones, trend strength, market exhaustion, and high-probability trade areas. Instead of relying on emotion or random entries, UNO Quant Trader helps you read the market using structured
CRT Candle Range Theory HTF MT5.   Ultimate CRT Indicator: Advanced ICT Concepts and Malaysian SnR Trading System Master the Market Maker's Footprints with the Most Advanced Candle Range Theory Indicator Discounted   Price $50  !!     Secure your lifetime access now before it switches to subscription-only ! Unlock the true power of Smart Money Concepts (SMC) and trade precisely like the institutions with the Ultimate CRT Indicator . Built exclusively for serious traders, this indicator automate
这是一个mt5版本的强大的多周期、多货币对、多指标监控指标工具,主要功能包括: 1.监控多种指标实时情况,可监控的指标包括RSI、MACD、MA和STO。 2.监控多种货币对, 可 自定义 添加或者删除货币对,指标自动更新。 3.监控各货币对多个周期。 4.点击后可直接切换到需要查看的图表和周期。 5.点击监控模式按钮可自由切换需要监控的指标类型:包括RSI模式,MACD模式,MA模式和STO模式。 1)RSI模式:RSI数值超过60显示红色,低于40显色蓝色;超过70和低于30显色超买超卖颜色。 2) MACD模式: DIF> DEA时,显示上涨趋势; DIF<   DEA时,显示下跌趋势。 3)   MA模式: MA小周期 >   MA大周期时,显示上涨趋势;  MA小周期<   MA大周期时, 显示下跌趋势。 4)STO模式: %D>K线时, 显示上涨趋势; %D<K线时,   显示下跌趋势。
Acceleration Force Meter Indicator - is a trend system that join market in trend phase and after trend pull-back. AFM indicator - is the system that watchs market phases from flat to extreme volatility and prefers to enter in market when it's active, more volatility, ignoring most flat places. This is 100% complete trading system including enter and exit points. It works well with profitable trades - maximizing take profit targets(analysis of recent market volatility, its pips range to adapt cur
Kingtrend
Antonio Blazquez
KingTrend — Price Action Trend Analysis Tool KingTrend is a trend-following indicator based on long-standing price action principles involving Highs, Lows, Open, and Close. The logic behind this tool comes from concepts passed on to me by my mentor and translated into code for consistent structure recognition. Features: Identifies market structure using price action logic Detects trend direction and key turning points Marks Higher Highs, Lower Lows, and extensions Suitable for discretionary or
Volume flow Profile
Israr Hussain Shah
大师版是一款专业级的分析工具,旨在通过成交量和资金流向的视角来可视化市场结构。与标准的成交量指标不同,该工具直接在图表上显示每日成交量分布,让您准确看到价格发现发生的位置以及“聪明钱”的定位。 此大师版专为清晰度和速度而设计,具有独特的自动主题同步系统,加载后即刻美化您的图表布局。 主要特点: 真实资金流向计算: 超越标准的跳动量。启用“Use Money Flow”时,成交量按价格加权,揭示了特定价格水平的实际资金投入。 价值区域 (VA) 可视化: 自动计算价值区域(默认为成交量的70%)。 VA填充: 为价值区域背景着色,以便即时识别控制区域。 关键水平: 清晰标记控制点 (POC)、价值区域高点 (VAH) 和价值区域低点 (VAL)。 专业标记系统: 扫描概况结构以识别关键交易区域: HVN (高成交量节点): 接受和盘整区域(支撑/阻力)。 LVN (低成交量节点): 拒绝区域或“快速通过”区域。 所有标记均向右绘制延长线,便于监控。 Delta 背离(左侧直方图): 左侧直方图可视化每个级别的买卖压力对比。这有助于识别隐藏的背离——即价格可能上涨,但卖家在这些水平上激进打
The set of most common indicators for day trading and long-term trading. MAs Cross (Global Trend) ADX Based Candle Color (Local Trend) Pivot Points (Entry Levels) Kijun-Sen You can use this indicator in different ways, one of it is opening positions in trend direction on pivot points levels. Contact  If you have some questions or if you need help, contact me via Private Message.
Frontier Pivots
Nestor Jose Mendez Boza
FRONTIER PIVOTS - Geometric Levels Indicator This indicator plots support and resistance levels/ranges on the chart using mathematical calculations. It helps traders identify potential price reaction zones based on geometric patterns. Main Features: Automatically calculates and displays key price levels Plots both support and resistance lines Uses daily price data for level calculation Clean visual presentation with different colors for different level types No repainting - levels remain static
MetaHelper
Volodymyr Tseibei
This indicator automatically calculates and displays classic pivot points on your chart, helping identify key support and resistance levels for the current trading session. Features: · Plots Pivot (PP), Resistance 1-2 (R1, R2), and Support 1-2 (S1, S2) levels · Includes current close price line for reference · Color-coded lines: Blue for pivot, Red for resistances, Green for supports · Automatic calculation based on previous day's high, low, and close · Continuous lines across the chart for e
Short Description Swing Timing Breakout EA is a smart Expert Advisor for MetaTrader 5 that combines trend filtering, momentum timing, and dynamic risk management to capture high-probability swing and breakout opportunities. Full Description Swing Timing Breakout EA is a professional trading robot designed for MetaTrader 5, suitable for traders who want a balance between automation, control, and disciplined risk management. This EA uses a trend-following and momentum confirmation approach ,
Heiken Ashi Supertrend Combine
Tri Yasin Satrio Adji Pranoto
Headline: Stop Guessing, Start Winning. Unleash the Power of the Heiken Ashi Supertrend Indicator. Body: Are you tired of market noise, confusing charts, and missed opportunities? The Heiken Ashi Supertrend Indicator is the ultimate tool designed to bring clarity and confidence to your trading, once and for all. We've combined two of the most powerful concepts in technical analysis into one seamless, easy-to-use indicator: Crystal-Clear Trends with Heiken Ashi: Say goodbye to choppy price action
Bar Strength Divergence indicator for MT5
Renaud Herve Francois Candel
5 (1)
Bar Strength Divergence Indicator BarStrength Indicator is an exclusive indicator to trade Forex, Stocks, Indices, Futures, Commodities and Cryptos. BarStrength Indicator shows the strength of each candle. The indicator shows in a separate windows candles relatively to 2 price levels representing resistance and support in the market. Once candle is near resistance it is highly probable that price movement will change direction and will go down in the next candles. Once candle is near support
Engulfing with EMAs Indicator Unlock the power of advanced candlestick pattern detection with the Engulfing with EMAs Indicator , a cutting-edge tool designed for MetaTrader 5. This futuristic indicator combines the precision of engulfing pattern analysis with the trend-following strength of Exponential Moving Averages (EMA 21 and EMA 50), empowering traders to identify high-probability setups across all currency pairs and timeframes. Key Features: Comprehensive Engulfing Detection : Detects b
Gann Zone Pro MT5
Kirill Borovskii
This indicator identifies and displays zones, as it were areas of strength, where the price will unfold. The indicator can work on any chart, any instrument, at any timeframe. The indicator has two modes. The indicator is equipped with a control panel with buttons for convenience and split into two modes. Manual mode: To work with manual mode, you need to press the NEW button, a segment will appear. This segment is stretched over the movement and the LVL button is pressed. The level is displayed
MySNR - Precision Support & Resistance Line Indicator Discounted   Price   $35  !!     Secure your lifetime access   now   before it switches to   subscription-only ! Tired of drawing levels manually or guessing where the price will react inside a thick, messy zone? Now you can save time and trade with absolute confidence using the MySNR Indicator . Unlike traditional tools that plot broad and ambiguous zones, MySNR is engineered to automatically plot exact, pinpoint Support and Resistance lines
Right hand
Rukhzoramo Qurbonnazarova
Right hand очень точно воспроизводит колебания цены. Когда рынок растет, кривая   Right hand идет вверх. Хотя иногда бывает так, что кривая идет вверх, в то время как цена консолидируется и нет тренда вверх. Аналогично, когда рынок падает, кривая тоже убивает, исключения возникают так же в зоне консолидация рынка. Анализ большого количества графиков Индекса Направленнрго Тренда ( DTI )позволяет выявить его специальные характеристики, полезные при отслеживании тренда. В положительной области т.е
Gecko EA MT5
Profalgo Limited
5 (1)
NEW PROMO: Only a few copies copies available at 349$ Next price: 449$ Make sure to check out our " Ultimate EA combo package " in our   promo blog ! Gecko runs a simple, yet very effective, proven strategy.  It looks for important recent support and resistance levels and will trade the breakouts.  This is a "real" trading system, which means it will use a SL to protect the account.  It also means it will not use any dangerous techniques like martingale, grid or averaging down. The EA shows its
Классификатор силы тренда. Показания на истории не меняет. Изменяется классификация только незакрытого бара. По идее подобен полной системе ASCTrend, сигнальный модуль которой, точнее его аппроксимация в несколько "урезанном" виде, есть в свободном доступе, а также в терминале как сигнальный индикатор SilverTrend . Точной копией системы ASCTrend не является. Работает на всех инструментах и всех временных диапазонах. Индикатор использует несколько некоррелируемых между собой алгоритмов для класси
##   ONLY GOLD ##   Тiльки Золото ## **Mercaria Professional Trading Zones - Complete Guide** ## **Mercaria Professional Trading Zones - Повний посібник** ### **How Mercaria Zones Work / Як працюють зони Mercaria** **English:** Mercaria Zones is an advanced trading indicator that identifies high-probability support and resistance areas using ZigZag extremes combined with mathematical zone calculations. The indicator works on multiple timeframes simultaneously, providing a comprehensive view
FX Levels MT5
Daniel Stein
5 (14)
FX Levels:适用于所有市场的高精度支撑与阻力 快速概览 想要精准确定适用于任何市场(外汇、指数、股票或大宗商品)的支撑与阻力吗? FX Levels 将传统的“Lighthouse”方法与前沿的动态分析相结合,实现近乎通用的准确性。依托真实经纪商经验和自动化的每日与实时更新, FX Levels 帮助您捕捉价格反转点、设置合理的盈利目标,并自信地管理交易。立即使用,体验更准确的支撑/阻力分析如何助力您的交易更上层楼! 1. 为什么 FX Levels 对交易者非常有利 极度精准的支撑 & 阻力区 • FX Levels 专为不同经纪商提供的行情源和时间设置而设计,可生成几乎相同的价位区,解决数据不一致的常见问题。 • 这意味着无论您在哪里交易,都能获得稳定一致的水平线,为策略打下更加牢固的基础。 结合传统与先进技术 • 通过将久经考验的“Lighthouse”方法与动态分析相融合, FX Levels 不仅限于每日刷新,还可针对新的价格波动进行即时更新。 • 您可以选择经典的静态方式,或实时捕捉新出现的水平,以贴近最新的市场行为。 识别清晰的反转点 • FX Lev
Naked Forex Big Shadow indicator for MT5
Renaud Herve Francois Candel
5 (1)
Naked Forex Big Shadow Indicator Big Shadow Indicator is a pattern recognition indicator for Forex, Stocks, Indices, Futures, Commodities and Cryptos. When you have a Big Shadow on your chart then this is a strong signal meaning that you might be ahead of a reversal. You can take other elements (momentum, trend, volatility, price action, fundamentals) to build a complete strategy and confirm your entries. Beware that you might not make money just following the arrows generated by the pattern re
The indicator is designed to work on any trading platform. The program is based on proprietary algorithms and W.D.Ganna's mathematics, allowing you to calculate target levels of price movement based on three points with the highest degree of certainty. It is a great tool for stock trading. The indicator has three buttons: NEW - call up a triangle for calculation. DEL - delete the selected triangle. DELS - completely remove all constructions. The probability of achieving the goals is more than 80
Road Map
Evgeniy Inkov
Safe travel is possible only on a road with good markings and correct road signs . Due to the very active use of my indicator on MT4 , I decided to switch it to MT5 . The indicator shows : - pulse waves ( bold sloping lines ) ; - corrective waves ( thin inclined waves ) ; - Series of waves up ( blue ) ; - wave series down ( purple ) ; - wave series lengths ( numbers near the zigzag vertices ) ; - breakdown levels of a series of waves ( short green and red lines ) ; - profit targets ( Fibonacci g
The Hybrid Trend Impulse indicator is an advanced tool that combines modern approaches to trend and impulse analysis, offering unique capabilities for effective deposit management. Key advantages of the HybridTrendImpulse_indicator: Nonlinear dynamics: The method of interaction between opening prices forms a unique nonlinear model that is particularly sensitive to significant price fluctuations, increasing their significance and making the indicator ideal for working in high volatility conditio
Looking for reliable levels on a price chart? Already tired of searching for similar indicators? Are the levels not working out as they should? Then this is the indicator for you. Volume Prices Universal is a reliable indicator of horizontal volumes. What does it show? First of all, the main idea of ​​the indicator is to display at which price mark the price has been for the longest time. Thus, the display of price volumes on the price chart is formed. With the help of which you can very simpl
Pullbacks on Trend 5
Svetoslav Boyadzhiev
"Pullbacks on Trend 5" is designed to help traders navigate the market situation. The indicator displays three multi-time frame moving averages that describe the "Trend" of price movements of financial instruments. Depending on the time frame you choose to display the trend, you can automatically see the structure of the trend on a lower time frame from its price movements and pullbacks using the histogram between two additional moving averages. Additionally, filters have been added to show the
ZigZag3LZZ
Igor Nagorniuk
ZigZag_3LZZ — 三级之字转向指标 ZigZag_3LZZ指标专为金融市场技术分析设计。它在图表上显示三条不同颜色的之字转向线,周期分别为5、13和34,帮助交易者:     直观识别关键价格反转水平     过滤 insignificant 价格波动和市场噪音     根据最新极值点绘制趋势线     自动计算斐波那契水平(0.24、0.382、0.5、0.618、0.76)     确定当前支撑位和阻力位     在新极值点出现时即时获得反转信号     在单一图表上直观比较三个时间周期      应用场景      该指标适用于多种交易策略:     趋势交易 — 通过三条不同方向的之字转向线判断趋势方向     水平位交易 — 在支撑/阻力位入场交易     寻找反转点 — 新极值点形成时的信号     斐波那契交易 — 自动构建回调与扩展水平     多时间框架分析 — 比较三级之字转向线以确认信号     超短线交易 — 使用周期5之字转向线的快速信号     波段交易 — 依据周期34之字转向线的趋势线操作      适用市
VOLUME PROFILE SAF-XII 专业级 MT5 市场轮廓(成交量概况)分析仪 —— 网格交易者的梦幻指标 什么是成交量概况 (Volume Profile)? 成交量概况是一种专业的机构级工具。与传统的随时间显示成交量的指标不同,它显示的是 特定价格水平 上的交易活动。它揭示了交易发生在 哪里 ,帮助您识别: 价值区 (VAH/VAL) :大部分交易发生的价格区间。 控制点 (POC) :成交量最高的核心价格水平。 流动性失衡 :每个层级的多空主导力量对比。 支撑/阻力 :基于实际交易活动形成的天然价格位。 三种操作模式 —— 真正的“设置后即忘” VP_MANUAL(波段交易与关键位分析) 用户通过拖动垂直线自定义分析范围。 仅在移动线条时重新计算。 适用场景 :新闻前夕分析、财报发布、特定日期范围。 VP_AUTO(头寸与动量交易) 随新柱线自动向后滚动。 使用自定义回溯周期(默认 100 根柱线)。 适用场景 :动量策略、突破交易。 VP_SESSION(日内交易与机构流向) 锚定逻辑交易时段(伦敦、纽约、亚洲盘开盘)。 适用场景 :日内交易、基于时段的机构化策略
Has rsi signal
Evgenii Savinov
HAS RSI Signal — 带有止损/止盈计算的专业趋势指标 HAS RSI Signal 是一款强大的交易工具,结合了经典指标与现代噪声过滤算法。该指标通过 Heiken Ashi Smoothed (HAS) 平滑蜡烛图和 RSI 震荡指标进行市场分析,在趋势反转或价格退出超买/超卖区域时,为交易者提供清晰的人场信号。 主要优势: 双重过滤: 使用 Heiken Ashi Smoothed 算法消除市场“噪音”,同时通过 RSI 确认动能强度。 自动计算点位: 指标不仅提供信号,还会根据当前市场波动率 (ATR) 自动计算 止损 (Stop Loss) 和 止盈 (Take Profit) 点位。 视觉直观: 信号以彩色蜡烛图的形式直接显示在主图表上,保持交易界面的整洁有序。 多维度通知: 内置终端弹窗警报、声音提示以及手机推送通知 (Push),确保您不会错过任何交易机会。 核心原理: 指标持续监控 RSI 的极端区域。当价格离开临界区且 HAS 算法确认方向转变时,即生成交易信号。ATR 参数允许止损和止盈根据市场当前的波动性进行动态调整。 核心参数设置: InpPeri
Nrha
Ratna Purwantari
This indicator uses Fibonacci to determine your trading levels precisely and measurably. It helps you to earn big profits. This indicator can also be used for various currency charts. You can also combine it with other indicators that you like so that the profits you get are also even greater. I hope you give me input so that this indicator can be better. We recommend using for the period M1 to M15. feel free to discuss with me. Thanks. 
该产品的买家也购买
Neuro Poseidon MT5
Daria Rezueva
4.85 (48)
Neuro Poseidon is a new indicator by Daria Rezueva. It combines precise trading signals with adaptive TP/SL levels - creating best possible trades as a result! Message me and get  Neuro Poseidon Assistant  as a gift to automize your trading process! What makes it stand out? 1. Proven profitability on all assets and timeframes 2. Only confirmed BUY and SELL signals present on the chart 3. Adaptive TP & SL levels generated by the software for each trade 4. Easy to understand - suitable for al
PrimeScalping
Temirlan Kdyrkhan
PrimeScalping is a powerful trading companion designed to generate high-probability entry signals with dynamic TP/SL/DP levels based on volatility. Built-in performance tracking shows win/loss stats, PP1/PP2 hits, and success rates — all updated live. Key Features: Buy/Sell signals with adaptive volatility bands Real-time TP/SL/DP levels based on ATR Built-in MA Filter with optional ATR/StdDev volatility Performance stats panel (Success, Profit/Loss, PP1/PP2) Alerts via popup, sound, push, or e
The Oracle Pro
Ottaviano De Cicco
The Oracle Pro:用于 MT5 的合成多周期偏向引擎 ️ 夏季上市优惠 — 早期买家可以 199 USD 获得 The Oracle Pro。价格将随关注度上升;最终价格 399 USD。 The Oracle Pro 是一款面向高要求与专业交易者的 MetaTrader 5 高级多周期 偏向引擎 。它以纪律回答一个问题:当前每个周期的方向偏向是什么、强度如何、各周期之间的一致程度如何?一切仅在已收盘的 K 线上计算——绝不重绘。 The Oracle Pro 是一套多因子共识系统。它将专有指标与优化算法整合为单一而精密的共识向量,并在单个指标实例内,跨当前周期与更高周期的堆栈进行读取——而不是在多个图表上堆叠互不相关的工具。 它是 Oracle 共识方法的专业进化版:完整重建为高级操作控制台,面向希望在一个纪律化工作流中获得深度、多周期背景与背离洞察的交易者。 是偏向引擎,而非信号生成器 The Oracle Pro 明确自身定位。它是一款提供纪律化方向背景的 多周期多因子偏向指标 。它 不是 信号生成器:不承诺入场、出场或盈利。偏向是背景——你在其方向上交易自己的设置
本产品已针对 2026 年市场进行更新,并针对最新 MT5 版本进行了优化。 价格更新通知: Smart Price Action Concepts 目前价格为 $200 。 接下来的 30 次购买 后,价格将上涨至 $299 。 特别优惠: 购买后,请发送私信给我,即可领取 免费赠品 + 礼物 。 首先需要强调的是,这款交易工具是不重绘、不回绘、不延迟的指标,因此非常适合专业交易使用。 Online course , and manual Smart Price Action Concepts 指标是一款非常强大的工具,适合新手和有经验的交易者使用。它将 20 多个实用指标整合到一个系统中,结合了 Inner Circle Trader Analysis 和 Smart Money Concepts Trading Strategies 等高级交易理念。该指标专注于 Smart Money Concepts,帮助交易者理解大型机构如何交易,并辅助预测其市场行为。 它特别擅长流动性分析,使交易者更容易理解机构交易逻辑。它也非常适合预测市场趋势并仔细分析价格走势。通过让交易与机构策略保
ARIPoint
Temirlan Kdyrkhan
1 (1)
ARIPoint is a powerful trading companion designed to generate high-probability entry signals with dynamic TP/SL/DP levels based on volatility. Built-in performance tracking shows win/loss stats, PP1/PP2 hits, and success rates all updated live. Key Features: Buy/Sell signals with adaptive volatility bands Real-time TP/SL/DP levels based on ATR Built-in MA Filter with optional ATR/StdDev volatility Performance stats panel (Success, Profit/Loss, PP1/PP2) Alerts via popup, sound, push, or email Cu
Valtor Edge Pro
Torben Petersen
5 (1)
Valtor Edge Pro – Precision Gold Signal Indicator with 3-Level Take-Profit, Session Filter & Live Stats Dashboard Valtor Edge Pro   is a   non-repaint   MetaTrader 5 indicator built exclusively for   XAUUSD (Gold) . It marks high-probability buy/sell signals directly on your chart — each one with a defined stop-loss and a complete three-level take-profit map (TP1 / TP2 / TP3). Designed for disciplined traders, it pairs a clean trend-following signal engine with a professional sidebar dashboard,
ScalpPoint
Temirlan Kdyrkhan
ScalpPoint is a powerful trading companion designed to generate high-probability entry signals with dynamic TP/SL/DP levels based on volatility. Built-in performance tracking shows win/loss stats, PP1/PP2 hits, and success rates — all updated live. Key Features: Buy/Sell signals with adaptive volatility bands Real-time TP/SL/DP levels based on ATR Built-in MA Filter with optional ATR/StdDev volatility Performance stats panel (Success, Profit/Loss, PP1/PP2) Alerts via popup, sound, push, or emai
您好,交易员! 大多数散户交易者依赖于滞后的网页脚本。真正具有交易优势需要机构化的架构。 Astro AI 指标并非标准的图表叠加层。它是一个编译后的神经网络,包含两个代理,直接运行在您的终端上。 以下是该系统背后的具体技术: 1. 代理 1:分析师(图神经网络 - GNN) 市场并非孤立的价格柱;它们是相互关联的数据网络。 功能:代理 1 使用图神经网络来映射这些复杂的非线性关系。 优势:标准指标仅考虑单一的历史移动平均线,而我们的 GNN 可以实时处理深层的市场结构关系,在散户交易量发挥作用之前揭示隐藏的相关性。 2. 代理 2:执行器(近端策略优化 - PPO) 模式识别只是成功的一半。基于当前市场波动做出正确的决策,才是预测模型与滞后模型之间的区别所在。 功能:代理 2 使用 PPO(一种先进的强化学习算法)来确定最佳入场点。 优势:它持续调整交易策略,而非使用静态的“超买”或“超卖”线。它会分析当前市场状况并计算最可能的成交点。 执行桥接:通过 ONNX 集成到交易终端 如果执行速度慢,模式识别就毫无用处。我们已通过 ONNX(开放神经网络交换平台
Azimuth Pro
Ottaviano De Cicco
5 (7)
Azimuth Pro V2:MT5合成分形结构分析与确认入场 概述 Azimuth Pro 是 Merkava Labs 推出的多层级波段结构指标。四层嵌套波段层级、锚定波段的VWAP、ABC形态识别、三时间框架结构过滤以及收盘确认入场——一个图表,一个从微观波段到宏观周期的完整工作流程。 这不是盲目的信号产品。它是一个以结构为先的工作流程,专为重视位置、背景和时机的交易者打造。 ️ 夏季促销 — 庆祝夏至与 The Oracle Pro 上市:Azimuth Pro 七折优惠,现价 279 美元(原价 399 美元)。限时夏季优惠。 1. V2的变化 合成多时间框架引擎 高时间框架分析从零开始重建,采用与Meridian Pro相同的专有合成架构。更清晰的HTF背景、稳定的实时行为、无经典MTF同步问题。合成引擎还解锁了 固定比率时间框架级联 (x2、x3、x4、x6)——不再在经纪商的固定时间框架之间任意跳转,您可以按图表时间框架的固定倍数分析结构,在每个尺度上保持相同的分形关系。 确认入场箭头 作为稳定且可恢复的执行层而设计的收盘确认箭头。当ABC设置形成且自适应确认逻辑
SmartScalping
Temirlan Kdyrkhan
SmartScalping is a powerful trading companion designed to generate high-probability entry signals with dynamic TP/SL/DP levels based on volatility. Built-in performance tracking shows win/loss stats, PP1/PP2 hits, and success rates — all updated live. Key Features: Buy/Sell signals with adaptive volatility bands Real-time TP/SL/DP levels based on ATR Built-in MA Filter with optional ATR/StdDev volatility Performance stats panel (Success, Profit/Loss, PP1/PP2) Alerts via popup, sound, push, or e
TrendProMaster
Temirlan Kdyrkhan
MasterTrend Indicator for MT5 A powerful trend-following and signal-evaluation tool MasterTrend   is a custom MT5 indicator that combines Moving Averages and ATR-based risk/reward logic to generate clear buy/sell signals. It visualizes dynamic SL/TP levels, evaluates past trade outcomes, and displays win/loss statistics in a clean on-chart panel. Key features include: Buy/Sell signals based on MA crossovers ATR-based SL/TP1/TP2/TP3 levels with visual lines and labels Signal outcome tracking wit
Flag Pattern Angelo
Brighton Mufaro Mudzingwa
Brandon Angelo Flag Pattern — how it works This indicator automatically detects classic bull and bear flag chart patterns in real time. The detection happens in three stages for each bar. First it looks for a flagpole — a sharp, strong directional move over a configurable number of bars ( FlagpoleBars , default 5) that must exceed a minimum percentage size ( FlagpoleMinPct ). For a bullish flag the pole must close net higher than it opened; for a bearish flag, net lower. Second it identifies th
RelicusRoad Pro MT5
Relicus LLC
4.96 (24)
RelicusRoad Pro: 量化市场操作系统 终身访问限时 70% 折扣 - 加入 2,000+ 交易员社区 为什么大多数交易者即使拥有“完美”指标也会失败? 因为他们在真空中交易 单一概念 。没有背景的信号是赌博。要持续获胜,您需要 共振 (CONFLUENCE) 。 RelicusRoad Pro 不是一个简单的箭头指标。它是一个完整的 量化市场生态系统 。它描绘价格运行的“公允价值之路”,区分市场噪音和真实的结构性突破。 停止猜测。开始用机构级“路”逻辑进行交易。 核心引擎:“Road” (路) 算法 系统的核心是 Road Algo ,一个实时适应市场条件的动态波动率通道。它投射出 安全线 (平衡) 和价格可能反转的 扩展水平 。 Simple Road: 典型市场的标准结构映射。 Smooth Road: 针对震荡盘整的降噪计算。 Breakout Road: 专为识别波动率扩张和爆发性走势而调整。 1. 算法动量与确认 我们的“剥头皮箭头”不只是简单的交叉。它们利用 高阶多项式逻辑 过滤噪音,确保信号与主周期一致。我们检测动量、价格行为和 Road 结构汇聚的精确入场
MasterTrend
Temirlan Kdyrkhan
MasterTrend Indicator for MT5 A powerful trend-following and signal-evaluation tool MasterTrend   is a custom MT5 indicator that combines Moving Averages and ATR-based risk/reward logic to generate clear buy/sell signals. It visualizes dynamic SL/TP levels, evaluates past trade outcomes, and displays win/loss statistics in a clean on-chart panel. Key features include: Buy/Sell signals based on MA crossovers ATR-based SL/TP1/TP2/TP3 levels with visual lines and labels Signal outcome tracking wit
Meravith MT5
Ivan Stefanov
5 (1)
做市商工具。 Meravith 将: 分析所有时间周期并显示当前正在运行的趋势。 标注流动性区域(成交量均衡区),即多头与空头成交量相等的位置。 在您的图表上直接显示来自不同时间周期的所有流动性水平。 生成并展示基于文本的市场分析供您参考。 根据当前趋势计算目标位、支撑位和止损位。 计算交易的风险回报比。 根据您的账户余额计算仓位大小,并估算潜在利润。 在市场出现重大变化时,Meravith 还会发出警告。 指标的主要线条: 多头/空头成交量衰竭线 —— 作为目标位使用。 趋势线 —— 指示市场趋势方向。根据市场是多头还是空头而改变颜色,并作为趋势支撑。其颜色主要反映市场情绪。 成交量均衡线(Eq)—— Eq(Volume Equilibrium)是系统的核心。它表示买卖双方成交量的平衡点,即市场流动性所在位置。向上突破 Eq 表示多头倾向,向下突破 Eq 表示空头倾向。突破后,应等待回调——当价格回到相反趋势的偏离线或衰竭线附近时。 使用方法:只需将其添加到图表中。 Meravith 可以分析一切——趋势和回调。 趋势线与某条成交量衰竭线之间的距离越大,说明该方向的成交量越高。 趋势
UZFX {SSS} 短线智能信号 MT5 是一款无重绘的高性能交易指标,专为在快速波动的市场中需要精准、实时信号的短线交易者、日内交易者和波段交易者设计。该指标由 (UZFX-LABS) 开发,融合了价格行为分析、趋势确认和智能过滤技术,可在所有货币对和时间周期内生成高概率的买入和卖出信号。 我推荐*的最佳时间周期:15分钟及以上。 {1小时}是我的首选。效果令人惊叹……! 注意:与{ LTL 164343 }指标结合使用,可提高获胜信号率。 使用 LTL 信号判断趋势,利用 SSS 信号确定入场时机。 这种方法将最大化您的胜率,并有效规避虚假信号。 核心功能 智能信号检测——精准识别强劲的趋势反转与延续形态。 多周期短线交易——在所有时间周期内运行流畅。 可自定义提醒——针对每个信号接收弹出窗口、电子邮件及手机通知(可配置)。 清晰可视箭头——图表上醒目的蓝色(买入)和红色(卖出)箭头。 自适应信号强度——可调节信号强度,适用于短期、中期或长期交易。 用户友好界面——简洁的图表显示,无重绘或信号延迟。 工作原理 UZFX SSS指标通过扫描价格走势来检测: 看涨反转——价格
Gem SIGNAL
Shengzu Zhong
5 (1)
GEM Signal Pro GEM Signal Pro 是一款適用於 MetaTrader 5 的趨勢跟隨指標,專為希望在圖表上獲得更清晰訊號、更有結構的交易設定,以及更實用風險管理的交易者而設計。 它不僅僅顯示一個簡單的箭頭,GEM Signal Pro 還能以更清晰、更易讀的方式呈現完整的交易思路。當條件確認完成後,指標可在圖表上顯示進場價、止損價與止盈目標,幫助交易者更有效率地評估交易設定。 運作方式 該指標首先根據其內部邏輯識別有效的初始訊號。 當確認條件滿足後,GEM Signal Pro 會在圖表上顯示完整的交易設定。這讓交易者可以更清楚地看到交易結構,並減少手動分析與計算的工作量。 圖表上的交易價位 對於已確認的訊號,GEM Signal Pro 可顯示: 進場價 止損價 止盈 1 止盈 2 止盈 3 風險報酬比 這讓交易設定更容易理解,也有助於讓圖表分析更有條理。 內建風險管理 風險管理是此指標設計的重要部分。 止損位基於近期市場結構,結合附近的擺動高低點與可選的 ATR 緩衝距離。這能讓交易價位更貼近當前市場條件,而不只是依賴固定距離。 圖表資訊面板 GEM Si
OmniSync Projection
Antonio-alin Teculescu
5 (1)
Chronos Fractal Engine is an innovative price projection indicator for MetaTrader 5, designed to transform your technical analysis by intelligently identifying and projecting historical price patterns. Built upon an advanced correlation algorithm and the fractal principles of the market, this powerful tool visualizes potential future price movements, giving you a unique edge in your trading decisions. What is Chronos Fractal Engine? At its core, the Chronos Fractal Engine employs a sophisticat
KT Alpha Hunter Arrows MT5
KEENBASE SOFTWARE SOLUTIONS
大多数箭头指标只给你一个信号,然后让你自己去判断剩下的一切。KT Alpha Hunter Arrows 为你提供完整的交易计划。 每一个信号箭头出现时,都会同时绘制一套完整计划:入场线、止损位、四个止盈目标,以及实时优势判断,告诉你当前这个交易品种和时间周期是否值得交易。随附的 Trade Manager EA 会在你手动入场后负责后续执行,让你在市场波动剧烈、情绪干扰明显时也能保持交易纪律。不重绘。仅在K线收盘后确认信号。适用于 Forex、黄金、指数以及任何你在 MT5 上交易的品种。 核心功能 不重绘买入和卖出箭头,只在K线收盘后生成。 每个信号都会显示入场线、结构性止损位和四个止盈目标。 Edge Dashboard 会分别评估当前图表上的买入和卖出机会。 判断系统包括:No Edge、Marginal、Tradeable、Good 或 Strong。 一键 Auto Optimize 按钮可根据当前品种和时间周期自动优化设置。 完整套装包含 Trade Manager EA,并提供五种专为本指标设计的预设交易管理方案。 Prop Firm Risk Panel 可在图表上
Gladiator pro
Ben Buni
5 (1)
Gladiator Indicator: Conquer the Markets Step into the trading arena with the Gladiator Indicator, a robust and highly effective trading tool designed exclusively for MQL5. Built for traders who want clear, actionable insights, Gladiator cuts through market noise to deliver precise Buy and Sell signals right on your charts. Whether you are a beginner looking for guidance or an experienced trader seeking a reliable confirmation tool, Gladiator provides the edge you need to battle the markets wi
Quant Direction MT5
Georgios Kalomoiropoulos
Quant Direction 是一款三维市场分析工具。它通过同时计算多个维度上的精确百分比偏差,提供完全客观的、基于算法的市场分析视角。该算法采用先进的人工智能建模工具开发,并经过全面测试,旨在以独特的精准度解读市场。它可以分析您平台上的任何货币对或金融工具。 无论您是短线 交易者、日内 交易者还是波段交易者,Quant Direction 都是您的理想之选。 交易者的真正优势 Quant Direction 的真正优势在于彻底消除情绪、屏幕疲劳和过度思考。它无需手动点击十几个图表来寻找方向并反复质疑自己的偏好,引擎即可在几毫秒内即时处理 8 个时间周期(从 5 个月到月线)。它能准确告诉你任何时刻谁在掌控市场,确保你始终朝着概率最高的方向进行交易。 市场分析的三个维度 该算法将市场分为三个不同的交易维度,为您提供完整的宏观和微观视角: 超短线交易分析: 捕捉即时、快速的动量变化和较低时间框架的执行点。 日内分析: 识别真实的、潜在的每日方向性偏差。 波动分析: 专注于宏观趋势,确保您不会与大盘机构的走势背道而驰。 独家评分引擎 Quant Direction 的底层采用了一套
Ziva LSE System
Hassan Abdullah Hassan Al Balushi
ZIVA LSE System A Professional Liquidity & Structure Execution Framework Executive Overview ZIVA LSE System is a professionally engineered analytical framework designed to interpret market behavior through structural logic and liquidity dynamics. It is not positioned as a conventional indicator. Rather, it functions as a structured execution environment that organizes price action into a clear, disciplined decision-making model. The system is built to deliver consistency, clarity, and controlled
This indicator automatically detects  internal & swing market structure, Breaker block, Strong Imbalance, Liquidity Void, Volume imbalance. Features Full internal & swing market structure labeling in real-time Breaker block Strong Imbalance Liquidity Void volume imbalance After purchasing the indicator, the full source code is provided, and via indicator buffers it can be easily integrated into your Expert Advisors (EAs) for automated trading strategies.
MetaForecast M5
Vahidreza Heidar Gholami
5 (3)
MetaForecast能够根据价格数据中的谐波来预测和可视化任何市场的未来走势。虽然市场不总是可预测的,但如果价格中存在模式,MetaForecast可以尽可能准确地预测未来。与其他类似产品相比,MetaForecast通过分析市场趋势可以生成更精确的结果。 输入参数 Past size (过去的尺寸) 指定MetaForecast用于创建生成未来预测模型的柱数量。该模型以一条黄色线绘制在所选柱上。 Future size (未来的尺寸) 指定应预测的未来柱数量。预测的未来以粉色线表示,并在其上绘制了蓝色回归线。 Degree (程度) 此输入确定了MetaForecast将在市场上进行的分析级别。 Degree 描述  0 对于程度0,建议使用较大的值来设置“过去的尺寸”输入,以覆盖价格中的所有高峰、低谷和细节。  1 (建议的) 对于程度1,MetaForecast可以理解趋势,并通过较小的“过去的尺寸”生成更好的结果。  2 对于程度2,除了趋势,MetaForecast还可以识别反转点。对于大于1的程度,必须使用较高的“细节”和“噪音减少”输入值。  大于2 不建议使用大于
CGE Trading Suite
Carl Gustav Johan Ekstrom
5 (2)
Institutional-Grade Analytics for MT5 One indicator. The full analytical edge of a professional trading desk, built into your MT5 chart. CGE Trading Suite unifies everything a serious trader reads in a market — structure, momentum, timing, and capital flow — into one seamless MT5 workspace. 16 integrated modules act as a single system: ICT sessions and killzones, order-block and liquidity mapping, MIDAS volume curves, automated trend lines and channels, the Economic Confidence Model, and a live
Presenting one-of-a-kind Gann Indicator for XAUUSD IQ Gold Gann Levels is a non-repainting, precision tool designed exclusively for XAUUSD intraday trading. It uses W.D. Gann’s square root method to plot real-time support and resistance levels, helping traders spot high-probability entries with confidence and clarity. William Delbert Gann (W.D. Gann) was an exceptional market analyst whose trading technique was based on a complex blend of mathematics, geometry, astrology, and ancient calculation
LTL Long Trend Locator
Muhammad Usman Siddique
LTL长趋势定位器v2.0 - 专业趋势交易指标 LTL长趋势定位器通过识别强劲持久的趋势,帮助交易者把握最佳进场与离场时机。当趋势启动或终结时,它会发出清晰信号,助您在正确时机顺势而为。该工具不仅能发现强劲市场趋势,更精准标注交易位置,明确显示入场点、止损位及止盈位。 核心功能: 清晰买卖信号:市场即将上涨或下跌时显示箭头提示 交易线标注:在图表绘制完整交易布局,所有关键位清晰标注 趋势区域:通过图表配色区分看涨(绿色)与看跌(粉色)周期 统计显示:呈现每段趋势持续的K线数量与点数 信息面板:实时更新趋势状态与最新信号时间 警报系统: 新信号出现时触发弹窗/邮件/声音提醒 单一信号仅触发一次警报(杜绝重复骚扰) 操作便捷: 信号以彩色箭头呈现(蓝箭买入/红箭卖出) 背景色标识活跃趋势区域 垂直线标记精确信号点 所有设置均可适配您的交易风格 适用人群: 新手交易者:简洁视觉信号助决策更轻松 资深交易者:高级过滤机制减少虚假信号 全周期适用:1分钟至月线图均可运行 全市场覆盖:适用于外汇、股票、指数、加密货币及大宗商品 核心优势: 节省时间:快速识别趋势行情 减少
ARICoins
Temirlan Kdyrkhan
ARICoin is a powerful trading companion designed to generate high-probability entry signals with dynamic TP/SL/DP levels based on volatility. Built-in performance tracking shows win/loss stats, PP1/PP2 hits, and success rates all updated live. Key Features: Buy/Sell signals with adaptive volatility bands Real-time TP/SL/DP levels based on ATR Built-in MA Filter with optional ATR/StdDev volatility Performance stats panel (Success, Profit/Loss, PP1/PP2) Alerts via popup, sound, push, or email Cust
Account flip MT5 scalper
Presley Annais Tatenda Meck
Important: whether you rent or purchase,  contact the seller via the MQL5 private messaging system and  get the  Key Level Trade Manager  as a bonus gift for the best manual scalping experience. Account Flip MT5 Scalper Welcome to a 5 indicators in 1 scalping workstation. Rapidly growing a small account or passing a prop-firm challenge requires three things: high-probability setups, strict filtering, and explosive momentum. The   Acc
ZIVA Signal Intelligence
Hassan Abdullah Hassan Al Balushi
ZIVA Signal Intelligence An Adaptive, Modular Market Intelligence System ZIVA Signal Intelligence is not positioned as a conventional trading indicator. It is a fully integrated, proprietary market intelligence system engineered to deliver structured, high-precision interpretation of price behavior within a controlled analytical environment. Developed through an independent architectural approach, ZIVA does not rely on, derive from, or replicate existing indicators. It represents a standalone
作者的更多信息
Candle Density Series Et
Alexandru Gisca
5 (1)
Candle Density Series - Detecting Density and Streaks of Consecutive Candles Candle Density Series is a powerful indicator from the CVET System that identifies zones of high candle density — sequences of consecutive bullish or bearish candles. It tracks and visualizes series of same-direction candles, helping traders understand the strength and persistence of the current market impulse. This is the first (free) version of the indicator, laying the foundation for more advanced density analysis
FREE
Candle Body Power — Real-Time Candle Body Strength Classifier | Juravvlik Trading Tools | CVET System Candle Body Power is a price action quality indicator that measures the body-to-range ratio of each candle and classifies its strength into three power levels in real time. Instead of just showing direction, it reveals how clean and dominant the current candle movement really is — giving you an instant read on candle body strength before the bar closes. CLASSIFICATION — THREE POWER LEVELS The
FREE
Candle Time Phases Et Indicator - Split any candle into three time-based phases and control the sequential development of the candle in real time. Candle Time Phases is a precision timing indicator that divides the current candle into three time-based phases as a percentage of its total duration. The indicator determines and clearly separates the initial uncertainty phase, the main movement, and the completion phase, while also analyzing the structure and sequential development of the candle in
FREE
Candle Volatility ET Classifier Indicator  A candle volatility indicator, candle classifier, and ET classification tool for MT5 that transforms raw price action into a structured market model through volatility classification.   Overview Candle Volatility Structures (CVET) is a custom candle classifier and volatility indicator designed to help traders understand market behavior through structure, volatility, and price action. This indicator provides real-time candle size measurement and candl
FREE
Pending Stop Order Trailing Et   -  is a utility for automatic trailing of pending orders (Buy Stop and Sell Stop) in MetaTrader 5. It dynamically adjusts pending order prices following the market until activation, helping to achieve better entry levels and reduce poor entries. The tool is designed for both manual and semi-automated trading workflows. STANDALONE & INTEGRATION The utility works fully in standalone mode and performs its core trailing function on any symbol without additiona
FREE
Stop Loss Magic Number  Description All offsets in this utility are calculated in USD. A reliable Stop Loss manager for loss protection, auto trailing and profit locking. Suitable for both beginners and advanced traders thanks to simple and extended modes. Fully automates trade management and helps eliminate emotional decision-making. Utility Features   Default Mode — simple mode Designed for quick and easy use. Includes basic trade management logic: • loss protection (Loss Protection Offset)
FREE
Stop Loss Basic Et for MT5 — a simple and adaptive Stop Loss utility with automatic trailing.   Core Logic Stop Loss performs two key functions: • protects the position from loss • trails and protects profit The utility automatically sets a Stop Loss and manages it as the price moves. Offset values are calculated in currency units.   Candle Classification (ET) The utility can work independently or together with the Candle Volatility ET Classifier indicator (free). ET classification is a s
FREE
Limit Order Trailing Et  —  is a utility for trailing limit orders (Buy Limit and Sell Limit) in MetaTrader 5. It automatically adjusts limit order prices following the market while maintaining a defined offset, allowing entries on pullbacks after price movement. This tool is designed for working with limit orders in MT5 and can be used in both manual trading and semi-automated trading systems. Unlike stop orders, limit orders are designed for price retracements (pullbacks) rather than brea
FREE
Stop Loss Manager 4 Step — DESCRIPTION A flexible Stop Loss (SL) manager designed for automated risk management, trade management, and full stop loss control. Fully automates Stop Loss, trailing stop, and break-even (breakeven) handling, helping eliminate emotional decision-making in trading. ⸻   4-Step Risk Control Logic Risk management is built on a structured sequence: Loss Protection → Activation → Break-Even → Trailing Stop The system gradually transitions a position: from risk → to safety
Adaptive Stop Loss Manager Multi-Lot for MT5 Adaptive Stop Loss Manager Multi-Lot for MT5 — adaptive, multi-lot, and volatility-based trailing system. Core Logic Stop Loss performs two key functions: • protects the position from loss • trails and locks in profit Offset values are calculated in currency units. The utility automatically sets and adjusts Stop Loss as the price moves. Multi-Lot Mode (Advanced Control) The utility supports working with multiple positions using lot size as an id
XL Impulse Capture EA - MT5 Expert Advisor for impulse trading using pending orders, trailing stop and breakout/pullback logic. Designed to capture strong XL candle movements with flexible entry and risk management. --- Strategy Idea The core idea of the strategy is to work with XL impulse candles. The system is designed to capture price movement after a strong impulse has already formed. Entries are executed during the final phase of a candle, when the movement is already developed and mo
Candle Phase Control EA — Phase Based Entry & Trailing Stop Short Description: Expert Advisor for precise candle phase trading. Opens trades only in the selected candle phase with flexible entry timing (phase start or phase end), candle linearity filter and advanced position management: Stop Loss, Breakeven and Trailing Stop. Full Description: Candle Phase Control EA is a mechanical Expert Advisor based on the Candle Phases indicator. It divides each candle into three time phases and allows t
Candle Class Ea
Alexandru Gisca
Candle ET Volatility EA -  A candle classification-based EA that enters trades when a target volatility class is reached and manages the full position lifecycle (SL, TP, trailing).   Description Candle ET Volatility EA   is an automated trading strategy that opens trades when the current candle reaches a specified volatility level (class). It works together with the   Candle Volatility ET Classifier Indicator   (must be downloaded and installed separately). Candle Volatility ET Classifier Indic
Body Power Class EA — Candle Body Strength Trading Strategy | Juravvlik Trading Tools | CVET System Body Power Class EA is a price action EA that enters trades based on real-time candle body strength classification. Instead of lagging indicators or complex mathematical models, the strategy uses live candle analysis to identify high-quality candle movements and enter at the right moment — when the candle body demonstrates the required power level. Recommended timeframes: H1 and H4. On these per
筛选:
无评论
回复评论