适用于MetaTrader 5的EA交易和指标 - 47

Harmonic Pattern Suite Pro Introduction Harmonic Pattern Suite Pro is an indicator designed to identify and display harmonic structures on the chart based on X-A-B-C-D sequences. Its purpose is to present pattern formations that meet geometric and proportional criteria, providing a clear visual representation directly on the chart. The indicator automates the detection process, removing the need for manual measurement of ratios and allowing the user to review the structural configuration withou
FREE

Volume Calculator
This indicator shows the volume to be used in an operation based on the maximum acceptable stop value and the size of the stop. That way you will not use a calculator to calculate the volume you are going to use every time. This indicator makes your life much easier and faster. Suitable for any type of trader: Scalper, DayTrader, SwingTrader.
FREE

Automatic Trend Line Fit. This indicator automatically plots the straight line and parabolic (curved) trend to any symbol at any timeframe. The plotted straight line is a good indication of the current trend and the curved line is an indication of a change momentum or change in the current trend. Plotting the straight line over about 2/3 the number of candles as the curved line is usually a good way to determine entry and exit points as it shows the current trend and momentum of the market. This
FREE

Cloud DCA Pro EA - 高级Ichimoku DCA交易系统 产品概述 Cloud DCA Pro是一款复杂的智能交易顾问,结合了Ichimoku Kinko Hyo分析与智能美元成本平均法(DCA)策略。专为寻求系统化、无情绪交易且不使用传统止损的交易者设计。 主要功能 无止损策略 - 使用智能DCA级别代替硬止损 Ichimoku云图分析 - 专业趋势检测和过滤 智能DCA系统 - 使用乘数进行渐进式仓位平均 双向交易 - 管理买入和卖出DCA序列 智能状态管理 - 基于趋势变化暂停和恢复 可视化盈利跟踪 - 图表上的标签监控表现 Ichimoku设置 Tenkan-sen周期 (默认: 9) - 用于短期趋势检测的转换线 Kijun-sen周期 (默认: 26) - 用于中期趋势分析的基准线 Senkou Span B周期 (默认: 52) - 控制云图形成宽度 启用详细日志 (默认: 是) - 交易决策的全面日志 DCA设置 初始手数 (默认: 0.01) - 第一笔交易的起始仓位大小 DCA手数乘数 (默认: 1.5) - 在每个DCA级别乘以手数 最大DCA级

For those who love to follow Volume behavior here it is a little indicator that could be used as a replacement for the old and standard MT5 built-in volume indicator. The trick here is that this indicator paints the volume histogram based on the direction of the candle giving to the trader a quick "Heads Up" on what is happening, visually! It could be used to study and see for instance, the volume and past bars volume during (or, reaching) a peak (Tops and Bottoms). UP candles are shown in pale
FREE
VM Auto SLTP Basic - Intelligent Trade Management for Scalpers Enhance your scalping strategy to a higher level. VM Auto SLTP Basic automatically manages Stop Loss and Take Profit for orders that are opened manually or by other Expert Advisors. This tool does not open trades on its own, allowing you to maintain full control while enjoying precise risk management. Key Features SL/TP based on ATR or fixed price Automatic SL move to Breakeven Risk management as a percentage of account balance Suppo
FREE

MACD Support–Resistance Candle Analyzer — Professional This indicator enhances the classic MACD by combining momentum analysis with dynamic Support & Resistance detection , giving traders a clearer view of breakout strength and market structure. It transforms price action into color-coded MACD candles , highlights SnR break levels , and provides clean visual confirmation of trend continuation or reversal. Ideal for scalpers, intraday traders, and swing traders who rely on fast, structured trend
FREE

Echelon EA – Chart Your Unique Trading Constellation Like the celestial guides that lead explorers through the vast universe, Echelon EA empowers you to create and optimize your very own trading strategies. This versatile system combines advanced grid and martingale techniques with cutting‐edge indicators, offering you an endless palette for designing a strategy that is truly your own. Craft Your Personal Strategy: Infinite Possibilities – Customize every parameter to build a trading system t
FREE

Eagle Spikes Detector v1.50 - Professional Trading Signal System Ultimate Precision Trading with Advanced SuperTrend Filtering Technology join my telegram channel to trade with me: https://t.me/ +9HHY4pBOlBBlMzc8
The Eagle Spikes Detector is a sophisticated, professional-grade trading indicator designed for serious traders who demand precision, reliability, and visual excellence. Combining advanced multi-timeframe analysis with cutting-edge SuperTrend filtering, this indicator identifi
FREE

Transform your MetaTrader 5 chart into a professional trading cockpit. Apex Dashboard is a high-performance utility designed for serious traders who need complete situational awareness. It moves beyond simple monitoring by providing a comprehensive overview of your account's solvency, performance, and risk exposure in real-time. Unlike standard indicators, Apex Dashboard features a Persistent Data Engine . It records your historical Peak Drawdown to a local file, ensuring your risk metrics r
FREE

The TMA Centered Bands Indicator for MT5 draws bands on the chart and shows the overall price trend. It displays three bands - the lower and upper boundaries of the channel and the median. The bands are made up of moving averages, and each of them has an MA period. The name TMA comes from triangular moving averages, as the indicator draws triangular bands. The price will fluctuate between these ranges whenever the trend changes direction, thus creating entry and exit points. How to trade
FREE

FiboEvo WIN: Estratégia Híbrida Fibo & Grid Adaptativo Descrição Curta Expert Advisor "Graybox" especializado em Mini Índice (WIN). Combina entradas técnicas por Fibonacci, Filtros de Fluxo (VWAP/ADX) e um sistema de Grid Adaptativo por ATR para recuperação de posições. Visão Geral (Overview) O FiboEvo WIN foi projetado para a realidade do mercado brasileiro (B3). Ele opera rompimentos e retrações de níveis de Fibonacci a favor da tendência. Seu grande diferencial é o sistema Auto-Adaptativo (AT
FREE

Extremum Scalper is a fully automated Expert Advisor, that uses a dynamic MM, probabilistic analysis and also strategy of breakout/rebound from the levels of daily and local extremes, and the candlestick Highs. The price Highs and the tick volume serve as the analyzed parameters. Works in different markets with all trade execution modes. Does not use martingale or hidden methods of increasing the position volume. The EA has 9 different extremum calculation algorithms. Uses a drawdown protection,
FREE
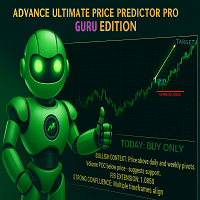
THE ADVANCE PRICE PREDICTOR - GURU EDITION Tired of Guesswork?
Meet the AI-Powered "Almighty Predictor" – Pinpoints High-Probability Targets Before the Move, With Surgical Precision
Stop chasing pips. Start attracting them. Our proprietary algorithm fuses Multi-Timeframe Analysis + Smart Money Concepts + Real-Time Confluence Scoring to give you a clear, calculated edge on every trade.
Are You Constantly Wondering…
"Is this the top, or will it keep going?"
"Where should I real
FREE

Introducing our innovative Expert Advisor (EA) designed to capitalize on pullback opportunities in the forex market, with the support of the Average True Range (ATR) indicator. This strategy focuses on identifying moments when the price temporarily retraces within a dominant trend, offering potential entry points with controlled risk. The ATR is a volatility indicator that measures the amplitude of price movements over a given period of time. By integrating the ATR into our EA, we can assess the
FREE

Gold Pro SMC Big Player EA MT5 - Note This EA Can also be used on Indices such as US30, NASDAQ, FR40, DAX, UK, BTCUSD, Metals and Currencies. Write Separately to me for set files after purchase. Set file for Backtesting/forward testing is attached in Comment Section- Must Use it on XAUUSD/Gold in M30 time. The Gold Pro SMC Big Player EA MT5 is a next-generation trading system built on Smart Money Concepts (SMC) and institutional order flow logic .
It identifies high-probability zones where inst

介绍强大的NRTR(Nick Rypock Trailing Reverse)指标 - 这是一个必备的技术工具,用于帮助交易员识别趋势反转并设置有效的跟踪止损水平。由Nick Rypock开发,该指标采用独特的算法,可以适应不断变化的市场条件,成为任何交易者工具箱中不可或缺的一部分。
以下是交易员使用该指标的两种常见方式:
1. 趋势反转:NRTR指标在趋势即将反转时生成清晰的信号。留意指标线穿过价格图表,这是潜在趋势方向转变的信号。
2. 跟踪止损:NRTR还可作为可靠的跟踪止损工具,可在趋势市场中保护利润。当价格朝着预期方向移动时,NRTR线会动态地跟随价格,提供灵活的止损水平。
可自定义参数:通过调整指标的参数,将NRTR指标调整为适合您的交易偏好和时间框架。尝试不同的设置,找到最适合您独特交易风格的配置。为了提升交易策略,考虑将NRTR指标与其他技术指标结合使用。使用多个指标可以验证信号,并提高整体交易准确性。
总之,NRTR指标对于希望识别趋势反转并实施有效的跟踪止损的交易员来说是一个宝贵的资产。其适应性和用户友好的设计使其成为交易者中受欢迎的选择,有助于提高交易
FREE

如果您喜欢这款免费工具,请留下五星好评!非常感谢 :) “风险管理助手”专家顾问系列是一套全面的工具,旨在通过有效管理各种市场条件下的风险来增强交易策略。该系列包含三个关键组件:平均交易、切换交易和对冲交易专家顾问,每个组件都针对不同的交易场景提供独特的优势。
此 EA 是基于市场上标准风险管理策略的开发版本。
https://www.mql5.com/en/blogs/post/756961
1. “均线助手”EA: MT4: https://www.mql5.com/en/market/product/115468 MT5: https://www.mql5.com/en/market/product/115469 2. “切换助手”EA: MT4: https://www.mql5.com/en/market/product/115478 MT5: https://www.mql5.com/en/market/product/115428 3. “对冲助手”EA: MT4: https://www.mql5.com/en/market/product/115466 MT5
FREE

Hetzer News Trading 是一款专门为在重要新闻发布期间运行而设计的智能交易机器人。它允许您通过设置精确的时间间隔在发布重要经济和金融数据时进入市场,从而提前规划您的交易。 Hetzer News Trading 的主要优势: 灵活配置: 根据新闻日历提前设定您的交易时间表。例如,如果您知道明天 16:00 和 17:00 会有重要新闻发布,您可以将机器人设置为在这些时间段自动激活。 每周规划: 能够提前几天查看新闻事件,使您能够迅速调整策略,最大限度地降低风险并优化盈利潜力。 交易操作自动化: 机器人会在指定时间自动激活,免去了您不断监控新闻并手动进入市场的麻烦。 有效的风险管理: 预设的时间间隔和策略有助于降低与新闻事件相关的市场波动性影响。 使用 Hetzer News Trading,您将拥有一个可靠的助手,能够按照预定计划运行,适应市场变化,并在高波动性条件下实现最大效率。
FREE

One of the best tools for analyzing volume,
Weis Wave was idelized by David Weis, to facilitate the reading of directional flow. For the VSA method disciples it is an evolution of the practices created by Richard Wycoff, facilitating a predictive reading of the market, always seeking an accumulation and distribution of the negotiated contracts.
Cumulative wave volume Range of wave ( removed) Average Wave volume Ref "Tim Ord lectures" ( removed)
FREE

The provided code is an example of an Expert Advisor (EA) written in MQL5, a programming language used for creating algorithmic trading systems in MetaTrader 5. Here is a breakdown of the code:
The code begins with various input parameters and settings defined using the input keyword. These parameters allow customization of the EA's behavior, such as entry lots, stop loss, take profit, and indicator parameters.
Several constant values and variables are declared, including session time setting
FREE
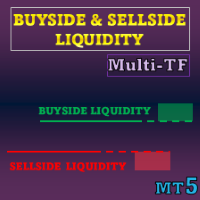
特别优惠 : 全部工具 ,每个仅 $35 ! 新工具 在 第一周 或 前3笔购买 期间定价为 $30 ! MQL5 交易工具频道 :加入我的 MQL5 频道以获取我的最新消息 本指标可视化 流动性水平 与 流动性区域 (基于 ICT 概念 , 并提供 Liquidity Voids 以突出单方向价格位移)。它关注止损或挂单易于聚集的位置,以及当价格穿越这些区域后其变化情况。
查看更多 MT5 版本: Buyside and Sellside Liquidity MT5 Multi Timeframe 查看更多 MT4 版本: Buyside and Sellside Liquidity MT4 Multi Timeframe 更多产品: All P roducts 要点 • 以配色区分的水平与区域,阐明双向流动性结构(buyside/sellside) • 当价格穿越水平后立即形成区域,并在价格保持于受控带内时扩展 • 以多层薄片显示 Liquidity Voids,便于跟踪其随时间的回补 • 提供“仅近期”或“全历史”两种显示

This utility here gives you a lot of bang for your buck by being a 2 in 1 custom candles generator. For the price of 1 utility, you get 2 !! It creates offline charts that will behave like a live chart.
It has 2 modes of operation: Tick and Range
These are not time based charts. They will enhance your analysis giving you an edge by filtering a lot of useless and confusing price noise, leaving behind the most important price levels/market structure.
When set to "Tick" mode, it will generate
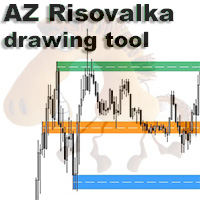
AZ Risovalka levels drawing tool An indicator for simplifying the drawing of levels. Select the indicator mode for the body, shadow, or the whole candle in the settings. Click the 'Draw' button on the drawing panel to create a level, then click on the body or shadow of the candle and select the level color in the color menu that appears. The 'Delete' button to delete level you select, 'Color' to select the color of an already created level. You can set your own colors in the indicator menu (6 co
FREE

Carbon Drift Price today is 70. When 5 copies are sold, the new price will be 90. Don’t miss the early slot. Currently sold: 4 . Contact me now to get a demo-account test version.
迈入自动交易的新纪元, Carbon Drift ——一款旨在解读市场自然“流动动态”的EA。该系统旨在精准地读取实时动量变化,检测疲软区域,并在趋势疲软与反转力量相遇时执行入场。这是一种非线性、流动的方法——远超于僵化的机械设置。
加入我们在MQL上不断壮大的交易者社区: (点击这里) 深入了解EA的见解: (点击这里)
Need my assistance? For proper backtest outcomes, I’ll send you the setup file and help notes. 概述 图表符号: GBPCHF (单图表设置) 时间框架: M15 最佳适用: NZDJPY,CHFJPY,EU

Fair Value Gap Sweep is a unique and powerful indicator that draws fair value gaps on your chart and alerts you when a gap has been swept by the price. A fair value gap is a price gap that occurs when the market opens at a different level than the previous close, creating an imbalance between buyers and sellers. A gap sweep is when the price moves back to fill the gap, indicating a change in market sentiment and a potential trading opportunity.
Fair Value Gap Sweep indicator has the following
FREE

A heatmap is a graphical representation of data in two dimensions, using colors to display different factors. Heatmaps are a helpful visual aid for viewers, enabling the quick dissemination of statistical or data-driven information. The MP Heatmap indicator provides a graphical representation of the relative strengths of major currencies compared to others, organizing data from pairs into color-coded results and producing a clear overview of the entire Forex market. The MP Heatmap indicator dis
FREE

EXPERT for YOUR OWN ACCOUNT - 本智能交易系统专为您的使用而设计、开发和优化。
这是一款功能强大的智能交易系统 (EA),可在 H1 时间框架和 MT5 平台上,在美元兑加元 (AUDUSD) 符号的所有趋势阶段,自始至终利用最佳和最大的机会。 在过去 3 年的回溯测试中,其准确性、性能和一致性令人印象深刻。 该 EA 就像一个猎人、一个狙击手,分析价格走势、力度和趋势,耐心等待最佳时机,极其精准地完成任务。 该 EA 以 SMC CHANGE OF CHARACTER (CHoCH) 策略为基础,还使用了许多本地专有指标。
LIVE SIGNAL - STRATEGY No.1 - https://www.mql5.com/en/signals/2336247 LIVE SIGNAL - STRATEGY No.2 - https://www.mql5.com/en/signals/2336242
主要特点 该 EA 会持续分析价格走势,一旦发现最佳机会,就会发送一个有限订单,从而建立头寸。 每个仓位从一开始就设定了固定目标和固定止损。 手数也
This EA trades using the Average Directional Index (ADX) indicator. It offers many entry strategies and flexible position management settings, plus many useful features like customizable trading sessions and a martingale mode. [ Installation Guide | Update Guide | Troubleshooting | FAQ | All Products ] Easy to use and supervise It implements 4 different entry strategies Customizable break-even, SL, TP and trailing-stop Works for ECN/Non-ECN brokers Works for 2-3-4-5 digit symbols Trading can be
FREE

Trade Receiver Free is a free tool to copy trades/signals from multiple MT4/MT5 accounts. The provider account must use copier EA to send the signal. This version can be used on MT5 accounts only. For MT4 accounts, you must use Trade Receiver Free . Reference: - For MT4 receiver, please download Trade Receiver Free .
- For MT5 receiver, please download Trade Receiver Free MT5 .
- For cTrader receiver, please download Trade Receiver Free cTrader .
- If you only need copy from MT4 account to u
FREE
Other profitable programs https://www.mql5.com/en/users/ifyjava/seller FNCD指标是一个先进的技术分析工具,将费雪变换与统计价格标准化相结合,创建复杂的振荡器。基础从Z分数标准化开始,其中价格数据通过计算当前价格在指定周期内偏离其移动平均值多少个标准差来标准化。这种标准化过程将原始价格波动转换为标准化单位,使得更容易识别极端偏差,无论工具的价格水平如何。费雪变换然后将这些标准化值转换为围绕零振荡的有界振荡器,极端读数表明潜在的反转区域。两个指数移动平均线应用于费雪变换值——快速EMA和慢速EMA——创建类似于MACD但具有增强统计属性的双线系统。当快速EMA从下方穿越慢速EMA时,产生看涨信号,而当快线从上方穿越慢线时,出现看跌信号。统计标准化和费雪变换的结合使这个指标在识别超买和超卖条件方面特别有效,同时通过EMA平滑机制过滤市场噪音。
FREE

Professional algorithmic trading system combining Four independent strategies Why Four Strategies Markets move through different phases: strong trends, sideways ranges, high volatility, and calm periods. The problem: A single strategy works in one season and fails in another. The solution: Four integrated strategies: SuperTrend Reversal - for trend reversals with 3 filters (ADX, ATR, MA) Smart Money BOS - for Break of Structure signals Market Structure - for pivot point breakouts Consol
FREE

Doji Flow : Precision Trading, Powered by Heikin-Ashi Doji Intelligence Welcome to Doji Flow , a meticulously crafted, next-generation trading system designed to transform subtle market indecision into consistent opportunity. Built for the astinct trader seeking clarity in chaos, this expert advisor combines advanced Heikin-Ashi Doji detection with smart, adaptive risk management ,all in one seamless, robust package. - Key Features - Heikin-Ashi Doji Detection
Identifies high-probability
FREE

圖形分析指標。 在圖表上標記主要的日本燭台形態。 目前,交易者可以使用以下一組模式: - Bearish/Bullish Abandoned Baby; - Bearish Advance Block; - Bearish Deliberation; - Bearish/Bullish Belt Hold; - Bearish/Bullish Engulfing; - Bearish Shooting Star; - Bearish Evening Star; - Bearish Evening Doji Star; - Bearish/Bullish Doji Star; - Bearish/Bullish Tri-Star; - Bearish Hanging Man; - Bearish/Bullish Harami; - Bearish/Bullish Harami Cross; - Bearish Two Crows; - Bearish Identical Three Crows; - Bearish Three Black Crows
点击此处查看我所有免费产品
InfoXpert 是 款免费的智能工具,适用于 MetaTrader 5 ,可将所有关键交易数据直接显示在图表上 - 实时、清晰且精确。 你可以立即看到你的盈亏(以货币和百分比显示)、点差以及当前蜡烛的剩余时间 - 非常适合在活跃交易中快速决策。 所有元素都 完全可自定义 - 你可以决定显示哪些数据、使用哪些颜色,以及信息出现在图表的什么位置:上方、下方或紧贴价格旁边。 这样一来, InfoXpert 会适应你的风格,而不是让你去适应它。 凭借其 现代且极简的设计 , InfoXpert 成为你的轻量化交易信息面板 - 精确、高效,并且完全免费。 这是为重视清晰度、控制力和完美时机的交易者打造的必备工具。 InfoXpert 将功能性与风格相结合 - 为希望看到自己成功每个细节的交易者而设计。
规格 在图表上直接展示 关键交易数据 实时显示盈亏(货币与百分比)
显示点差
显示当前蜡烛剩余时间并带有倒计时
完全可自定义布局 - 选择你想显示的内容
灵活放置:顶部、底部、左侧、右侧或紧邻价格
可调节颜色、字体大小和样式 - 保证最佳可读性
即时实时
FREE
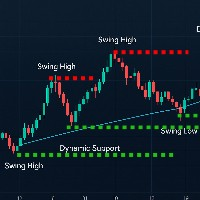
A professional swing point detection indicator that identifies key highs and lows with precision. Features include: Smart Detection : Identifies swing highs/lows based on customizable left/right bar analysis Visual Alerts : Clear arrows and labels (optional) mark swing points Dynamic Lines : Draws support/resistance lines that disappear when price touches them (toggle on/off) Real-Time Alerts : Sound and popup notifications for new swings Non-Intrusive : Preserves all manual chart drawings Perfe
FREE

Event Horizon Trader - это передовой автоматический торговый робот, построенный на инновационной гибридной архитектуре. Он объединяет квантовые принципы, искусственный интеллект и многоуровневую систему управления рисками для адаптивной торговли на финансовых рынках. Советник разработан для работы в изменчивых рыночных условиях, динамически подстраиваясь под трендовые, флэтовые и высоковолатильные периоды. Советник имеет тестовую настройку для пары: XAUUSD Ключевые компоненты системы: 1. Квант
FREE

Equity Shield Pro 1.1
NEW VERSION Equity Shield Pro 1.1 is a powerful utility EA designed to safeguard your trading account by actively monitoring and enforcing equity protection and profit management rules. Whether you’re trading personal accounts or working through proprietary firm challenges, this EA ensures strict adherence to risk and profit targets, enabling you to maintain discipline and consistency. Fully compatible with all challenge types, Equity Shield Pro 1.1 is specifically craft

Grid Balance Pro - The Ultimate Safe Grid System for XAUUSD Grid Balance Pro is not just another grid EA. It is a sophisticated, safety-first trading system specifically optimized for Gold (XAUUSD) . Unlike traditional risky grids, Grid Balance Pro incorporates advanced filters like Trend Detection , Volatility Protection , and a Smart News Filter to ensure your account stays safe while generating consistent cash flow. Why Grid Balance Pro? Safety First Logic: The system prioritizes capita

Moving Average RAINBOW Forex traders use moving averages for different reasons. Some use them as their primary analytical tool, while others simply use them as a confidence builder to back up their investment decisions. In this section, we'll present a few different types of strategies - incorporating them into your trading style is up to you! A technique used in technical analysis to identify changing trends. It is created by placing a large number of moving averages onto the same chart. When a
FREE
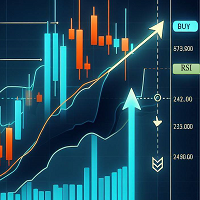
This trading robot is based on a candlestick pattern and RSI indicator strategy. It looks for candles that have a small body relative to their shadows, indicating indecision in the market. It also checks if these candles are placed at the pivot point. If the close of one of the next candles breaks the resistance line from below and the RSI is above the MA of RSI, then the robot opens a buy order. If the close of one of the next candles breaks the support line from above and the RSI is below th
FREE

MA Cross MACD Final Engine v3.04
支持多时间框架的策略自动化,集成CTrade 概述:
MA Cross MACD Final Engine v3.04是一种自动化交易策略,结合了移动平均线(MA)交叉、MACD确认和趋势过滤。该专家顾问专为MetaTrader 5设计,能够智能适应市场条件。 主要特点: 双MA交叉和MACD确认:
买入和卖出信号基于快速和慢速MA交叉以及MACD位置进行过滤。 趋势过滤器(多时间框架分析):
仅在趋势方向上开仓,趋势由在更高时间框架上计算的附加MA指标确定。 全自动化和CTrade集成:
通过MQL5的现代 CTrade 类处理交易进入和管理。 高级仓位管理: 固定的止损/止盈点 可调节的手数大小 可选的跟踪止损功能 实时信息面板:
在终端屏幕上显示交易状态、当前盈亏和未平仓头寸数量。 输入参数:
参数按逻辑分组: 交易设置 跟踪止损选项 指标设置(MA和MACD) 趋势过滤器的时间框架和类型 可视化面板设置 目的:
该专家顾问旨在通过系统地应用手动交易策略中常用的经典MA和MACD方法,优化时机、风险
FREE

The Chandelier Exit Indicator for MT5 is a powerful tool designed to help traders manage trades by dynamically adjusting stop-loss levels based on market volatility. It is based on the Average True Range (ATR) and follows the trend, placing stop-loss levels above or below price action, depending on the trend direction. This makes it an effective tool for trend-following strategies, breakout trading, and risk management .
Key Features: • Dynamic Stop-Loss Placement – Adjusts stop-
FREE

Are you tired of the slow, clunky, and uninformative default order panel in MetaTrader 5? Discretionary trading demands speed, precision, and above all, clear information. Clicking through multiple menus, dragging stops one by one, and lacking a consolidated view of your risk are barriers that cost you time and, most importantly, money. Professional trading requires professional tools. Trader Panel Alpha X Pro is the definitive solution. It's not just another "order ticket"; it's a complete trad
FREE

RSI警报(对于Metatrader 5)
该指标的工作方式与普通RSI一样,具有所有设置(周期性,颜色,水平等),
但是,另外,可以在上限和下限设置警报(示例70和30),并且可以通过移动蓝线和红线来建立上限和下限来调整这些级别。
您还可以打开和关闭一个附加功能,当达到预期的较高或较低的RSI时,将在图表上创建一个箭头。
RSI警报(对于Metatrader 5)
该指标的工作方式与普通RSI一样,具有所有设置(周期性,颜色,水平等),
但是,另外,可以在上限和下限设置警报(示例70和30),并且可以通过移动蓝线和红线来建立上限和下限来调整这些级别。
您还可以打开和关闭一个附加功能,当达到预期的较高或较低的RSI时,将在图表上创建一个箭头。

Neural Market Scalper ML
Overview: Neural Market Scalper ML is an innovative automated trading solution designed specifically for traders seeking reliable, adaptive, and strategic performance in Forex and CFD markets. Utilizing advanced machine learning algorithms combined with proven trading indicators, it dynamically adjusts its strategies to current market conditions.
Recommended Instruments & Timeframes:
Recommended Symbol:ETHUSD, BTCUSD, XAUUSD Recommended Timeframe:M5 (5-minute chart)
FREE
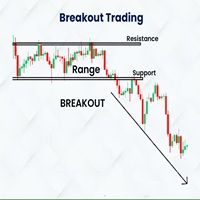
Indicador Basado en la estrategia de ruptura del rango de londres de Amaury Benedetti.
Este indicador dibuja automaticamente el rango, el maximo y minimo y sus correspondientes lineas de stoploss, entrada y takeprofit.
SE RECOMIENDA USAR EN M1 EN EL US30 (DE ACUERDO A LA ESTRATEGIA)
Los valores se pueden modificar de acuerdo a la necesidad del usuario, tambien se tienen mas configuraciones para dibujar cualquier rango en diversos horarios y con diferentes configuraciones de sl, tp, etc
Detal
FREE

The Ultimate Arbitrage Machines EA is a professional-grade solution designed for both statistical and triangular arbitrage in forex markets. This EA adaptively captures mean-reversion opportunities while employing robust risk controls. It features dynamic threshold adjustment, adaptive risk management, multi-strategy execution, and real-time market adaptation. The EA auto-calibrates Z-Score parameters, intelligently positions TP/SL, and uses multi-factor position sizing. It detects both statist
FREE

This is not an EA – it’s a simple and powerful MT5 indicator designed to help you manage trades quickly and easily. Key Features: TP1 Auto-Set – Fixed at 1RR TP2 Auto-Set – Set at 2RR Fast Lot Calculation – Calculates lot size based on SL in 1 second Quick Actions: Close All Trades Move to Breakeven Set TP at RR1 / RR2 User-Friendly – No complex setup, just attach to chart and start using Support:
Telegram – @inForexVIP
WhatsApp – +923118409597 MT4 Version Coming Soon
W
FREE

免费版网格策略!与相同策略的完整版相比,唯一的限制就是仓位数量。 它的目标是在趋势行情中收获最大利润 (自动模式),并在趋势中调整。有经验的交易者也可以在手工交易时使用它。许多拥有 500 多名付费订阅者的成功交易者正在使用这类系统。 结合您的交易经验与自动策略!它包含适用于 GBPJPY 的网格,也可以轻松扩展到其它货币。 您也可以从头开始构建自己的网格! 策略也支持止损选项。您可以使用基于净值的止损,设置净值百分比来保护每笔交易。 针对 GBPJPY 进行测试 06.2012 - 11.2013 任意时间帧 (每次即时报价)。 其它对: CHFJPY, EURJPY, CADJPY, USDJPY。 也可在任意货币对的趋势行情中测试 (例如, GBPUSD 06.2013-11.2013) 或振荡行情。针对 GBPUSD 最好使用紧凑的网格,并且,若非振荡模式,应跟随日线趋势。在振荡模式中,围绕 8-16 均线附近振荡。 该 EA 十分容易配置。给我发送私信,获得更多详情,或观看 MetaTrader 4 版本的视频教学。 所有选项均有很长的描述,并给出某些选项能够完成什么的例子。
FREE
Special offer : ALL TOOLS , just $35 each! New tools will be $30 for the first week or the first 3 purchases ! Trading Tools Channel on MQL5 : Join my MQL5 channel to update the latest news from me 通过 SuperTrend AI Clustering MT5 with Scanner ,体验人工智能的强大力量。这款革命性的交易工具适用于 MetaTrader 5 (MT5),结合了 K-means 聚类和广受欢迎的 SuperTrend 指标,帮助交易者在趋势和信号中掌握主动。 See more MT4 version at: SuperTrend AI Clustering MT4 with Scanner See more products at: https://www.mql5.com/en/users/ndhsfy/seller
为何此工具独

Product Name: HTF Candle Insight (EurUsd) - See the Big Picture Description: IMPORTANT: This version works EXCLUSIVELY on the EURUSD symbol. (It supports all broker prefixes/suffixes, e.g., pro.EURUSD, EURUSD.m, but will NOT work on Gold, Bitcoin, or other pairs). Experience the full power of "HTF Candle Insight" completely on EURUSD! Stop switching tabs constantly! This indicator allows you to visualize Higher Timeframe price action directly on your current trading chart. Whether you are a Sca
FREE

This Supertrend strategy will allow you to enter a long or short from a supertrend trend change. Both ATR period and ATR multiplier are adjustable. If you check off "Change ATR Calculation Method" it will base the calculation off the S MA and give you slightly different results, which may work better depending on the asset. Be sure to enter slippage and commission into the properties to give you realistic results. If you want automatic trade with Supertrend indicator, please buy following pr
FREE

使用革命性的交易时间管理器轻松控制您的交易程序。这个强大的工具可以在指定时间自动执行订单,从而改变您的交易方式。 为不同的交易行为(从购买到设置订单)制定个性化任务列表,所有这些都无需人工干预。 交易时间管理器安装和输入指南 如果您想获取有关 EA 的通知,请将我们的 URL 添加到 MT4/MT5 终端(参见屏幕截图)。 MT4版本 https://www.mql5.com/en/market/product/103716 MT5版本 https://www.mql5.com/en/market/product/103715 告别人工监控,拥抱精简效率。直观的界面允许您设置精确的参数,包括交易品种、执行时间、价格、止损 (SL)、止盈 (TP) 点和手数大小。 该工具的灵活性通过与市场行为相匹配的适应性重复选项来凸显。通过视觉主题个性化您的体验,并减少长时间交易期间的眼睛疲劳。 摆脱手动交易程序,拥抱“交易时间管理器”的强大功能。提高交易的准确性、组织性和自由度。简化您的日常工作并重新体验交易。
主要特点:
自动订单执行:按指定时间间隔无缝自动执行订单,从而节省您的

介绍 Break Asian Range 是一款自动化交易机器人,基于著名的“亚洲高低点突破”策略。它旨在识别并交易亚洲交易时段的突破行情,适用于如 EURUSD、GBPJPY 等波动性较高的货币对。 它结合了可自定义的技术确认与高级风险管理(止损、止盈、移动止损、可变风险、重入等),适用于保守或激进风格的交易者。 支持多种时间周期,可识别关键的K线形态,如十字星、锤头线或吞没形态,以用于入场确认(如交易者选择使用)。 主要特点
基于市场中一种广为人知、重复性强的行为策略。 灵活:允许自定义确认条件、交易时间、风险等。 兼容任何货币对或资产。 可根据用户的风格进行保守或激进交易。 支持重入、动态风险管理及交易过滤。 已在2025年4月对多个货币对进行了良好的测试(见下方图片)。
评论与支持 如果您觉得此机器人有帮助,非常感谢您留下积极和建设性的评论。这将帮助我改进未来版本,并更好地满足用户的实际需求。 我随时为您解答疑问,解释任何参数,或处理与机器人相关的任何问题。 下方将提供该系统运行原理及可配置参数的详细说明。
亚洲高低点策略 亚洲高低点策略基于这样一个概念:每个交易时段(
FREE

123模式 是最受欢迎,功能强大和灵活的图表模式之一。该模式由三个价格点组成:底部,峰值或谷值以及38.2%至71.8%之间的斐波纳契回撤位。当价格突破最后一个峰值或谷值时,该形态被认为是有效的,此时指标绘制箭头,发出警报并可以进行交易。 [ 安装指南 | 更新指南 | 故障排除 | 常见问题 | 所有产品 ]
清除交易信号 可自定义的颜色和尺寸 实施绩效统计 可定制的斐波那契回撤水平 显示适当的止损和获利水平
该指标可用于查找连续或反转形态 它是不可重涂和不可重涂的 它实现了电子邮件/声音/视觉警报 123模式 可以表现为连续或反转模式。为了简化操作,该指标使您可以选择要寻找哪种类型的形态,使其成为趋势或反转交易者的绝佳工具。
设置 将指标加载到任何图表时,将显示一组选项作为输入参数。如果您认为它们太多,请不要感到失望,因为参数被分组为不言自明的块。这就是每个参数块的作用。 幅度-幅度表示替代价格点之间的最小柱线量。要找到大图案,请增加幅度参数。要查找较小的模式,请减小幅度参数。 闵。回撤-形态中所需的最小斐波那契回撤。设置为零不对其进行评估。 最大。回撤-形态中可能的最大斐
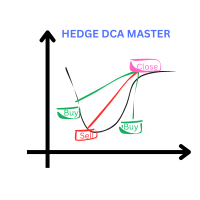
Wealth gained hastily will dwindle, but whoever gathers little by little will increase it.
This Expert is using DCA and Hedging Strategy. Live Account with startlot 0.04 : Hedge DCA Master HighRisk x4
Live Account with Middle Risk and recovery from loss other EA : https://www.mql5.com/en/signals/2289704
www.myfxbook. com/portfolio/hedge-dca-master/11230507 delete space before com I cut the loss and change the demo to Gold m15 because more happening on gold pair
The Key point: Use my cu
FREE

RITZ – 8 Main Market Zones & Smart Candle Timer is an advanced market-timing and session-analysis indicator designed to enhance intraday trading precision. The indicator features an adaptive candle countdown timer with dynamic time format, color warnings, blinking effects, size scaling, and multi-level sound alerts to help traders anticipate candle close and critical market moments accurately. It includes a global market session panel covering 8 major trading zones worldwide , displaying real-t
FREE

该指标通过分析连接价格和MACD直方图峰值或谷值的线的斜率来识别背离。 看涨背离(趋同): 当连接MACD谷值的线与连接相应价格谷值的线具有相反的斜率并趋同时发生。 看跌背离: 当连接MACD峰值的线与连接相应价格峰值的线具有相反的斜率并发散时发生。 当检测到背离信号时,指标会在对应信号的价格水平和时间上在图表中标注点。 额外功能: 该指标集成了 Darek Dargo的交易系统 中的信号,称为 TFR(The First Red) 。如果背离和TFR信号同时发生,指标会在图表中显示方向箭头,突显强化信号。 MACD直方图: 为了更清晰地显示,直方图采用不同颜色: 红色柱状 表示值高于前一根柱子。 绿色柱状 表示值低于前一根柱子。 当直方图在零线以下从红色变为绿色时,表明可能存在买入机会。相应地,当直方图在零线以上从绿色变为红色时,表明可能存在卖出机会。 背离和TFR信号作为过滤器,增强了这些信号的可靠性。 技术细节: MACD直方图计算为12周期和26周期指数移动平均线的差值。信号线未参与背离模式,以确保专注于直方图的动态。

SWIFT SNIPER COMBO — Advanced Trading Signal Indicator (Non-Repainting) Short Pitch: A precision entry system that fuses a fast/slow MA crossover with robust swing-pivot confirmation to deliver high-probability signals, clear TP/SL levels, and realtime alerts — built for traders who want clean, non-repainting signals and practical risk management. What It Does (Quick Overview) SWIFT SNIPER COMBO combines a smoothed moving-average crossover engine with a swing-pivot detector. Signals are only gen
FREE

Smart Grid MT5 automatically recognizes any symbol, period and scale of the chart and marks it up accordingly. It is possible to mark up the chart by trading sessions. The grid consists of the two main line types.
Vertical lines There are two visualization methods: Standard - the lines are divided into three types, separating: Small time period. Medium time period. Large time period. Trading Session - the lines are divided into groups (a total of ten). Each group has two lines: the first is res
FREE

This EA uses two moving averages one slow and one fast, when ever they cross it checks if the RSI value is greater or lesser than 50 depending on the signal given by the Moving averages. After that it checks if the Stochastics lines are going up or down and not in the Over Bought or Over sold zone. so in total it uses an RSI, 2 Moving Averages ,Stochastics and an ATR to try to evade stop hunting.Also has a trailing function to hold the profits if price moves X pips tested on a 5 min time frame
FREE

Ritz Smart FIBOPIVOT Optimus Pro Advanced Multi-Timeframe Fibonacci Trading System SMART PREDICTION & ACCURATE FORECAST Revolutionary Fibonacci Pivot Technology combines traditional pivot points with advanced Fibonacci extensions, creating a powerful predictive tool for professional traders.
Our algorithm intelligently detects significant price levels across multiple timeframes, delivering laser-accurate support and resistance zones before the market moves . INTELLIGENT VOLUME-VALIDATED SIGNALS
FREE

Developed by Charles Le Beau and featured in Alexander Elder's books, the Chandelier Exit sets a trailing stop-loss based on the Average True Range (ATR). The indicator is designed to keep traders in a trend and prevent an early exit as long as the trend extends. Typically, the Chandelier Exit will be above prices during a downtrend and below prices during an uptrend.
Calculation
The original Chandelier Exit formula consists of three parts: a period high or period low, the Average True Rang
FREE

Highly configurable Bollinger Bands indicator. Features: Highly customizable alert functions (at levels, crosses, direction changes via email, push, sound, popup) Multi timeframe ability Color customization (at levels, crosses, direction changes) Linear interpolation option Works on strategy tester in multi timeframe mode (at weekend without ticks also) Parameters:
Bollinger Bands Timeframe: You can set the lower/higher timeframes for Bollinger Bands. Bollinger Bands Bar Shift: Y ou can set th
FREE

Probability emerges to record higher prices when MACD breaks out oscillator historical resistance level. It's strongly encouraged to confirm price breakout with oscillator breakout since they have comparable effects to price breaking support and resistance levels; surely, short trades will have the same perception. As advantage, many times oscillator breakout precedes price breakout as early alert to upcoming event as illustrated by 2nd & 3rd screenshot. Furthermore, divergence is confirmed
FREE

Gold Master Indicator MT5 - Institutional Precision for XAUUSD The Gold Master Indicator is an advanced analysis tool specifically designed for the unique volatility of the Gold (XAUUSD) market. This indicator not only tracks the price but also identifies liquidity zones and institutional turning points where the probability of reversals is higher.
Unlike standard indicators, Gold Master uses a data smoothing algorithm to eliminate market noise, allowing traders to capture clean movements on t
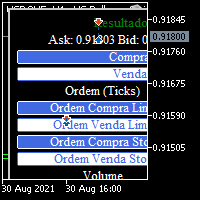
BOLETA TRADING PROFISSIONAL. Painel de negociação usado para facilitar operações manuais no MT5. -Botão para fechamento automático de ordens e posições. -Negociação facilitada usando teclado e mouse. -Sistema de ordens OCO (TP & SL pré configurados) -Normalização de volume para qualquer ativo. -Controle de limite horários para negociação. -Sistema de meta e limite de loss. -Martingale configurável. -Trailing Stop. -BreakEven. -Numero mágico (Expert Magic) para não entrar em conflito com outros r
FREE

Index Stalker EA (v1.x 系列) 专为自营交易公司(Prop Firm)设计 遵守规则 风险保证金:1%。 每日回撤:3%。 账户资金:$10, 000。 如果您需要任何信息,请随时与我联系。
1. 高冲击力产品描述 在纳斯达克100指数的动荡潮流中, 最大的机遇并非通过蛮力获得, 而是源于精准与耐心。 隆重推出 Index Stalker EA ——一款精密的交易工具, 旨在以手术刀般的精度, 悄然追踪并执行高概率的交易机会。 其核心是一个复杂的双策略引擎, 能够智能识别市场状态。 “动能骑士” (Momentum Rider) 策略使您的交易与NAS100强大的日内趋势保持一致;而 “反转专家” (Reversal Specialist) 则在关键的供给与需求区域精确定位趋势枯竭的时刻, 为您在急剧且有利可图的转折点做好准备。 这个智能核心由一个坚不可摧的隐形框架所保护——一套专业级的风险管理系统。 凭借基于ATR动态调整的止损、 硬编码的每日回撤限制, 以及对点差和交易时段的过滤, 您的资金将受到严格保护, 免受市场噪音和不可预测情况的影响。 Index S
FREE
MetaTrader市场提供了一个方便,安全的购买MetaTrader平台应用程序的场所。直接从您的程序端免费下载EA交易和指标的试用版在测试策略中进行测试。
在不同模式下测试应用程序来监视性能和为您想要使用MQL5.community支付系统的产品进行付款。
您错过了交易机会:
- 免费交易应用程序
- 8,000+信号可供复制
- 探索金融市场的经济新闻
注册
登录