 MetaTrader 5
 专家
 指标
 程序库
 实用工具
 窗口小部件
 规则
适用于MetaTrader 5的新技术指标 - 113
 技术指标的信号外汇和股票市场的开仓交易和平仓交易起着至关重要的作用。指标的本质就是一种交易品种的数学转换,旨在预测未来的价格变化。
测试技术指标可以更有利于预测市场行为并从中获利。
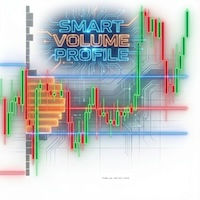
Chinese (Simplified) 扫描 "Smart Money" (成交量标记): 箭头指示异常成交量(高于平均水平),并以清晰的红/绿颜色区分。这有助于识别主力资金(Smart Money)的入场点,并过滤掉虚假信号。 关键警报 (Alerts): 无需时刻盯着屏幕。当价格穿越 POC 线(成交量控制点)时,系统会立即发出警报,这通常是决定趋势延续或反转的关键点。 即时市场结构 (Developing Profile): 显示当前正在形成的价格周期的分布图。让您一目了然地看到价格是正在脱离累积区,还是正在被拉回均值。 Chinese (Simplified) 该指标非常适合专注于 Price Action (价格行为) 和 Volume Analysis (量价分析) 的交易者,因为它能将普通的裸K图表转化为一张清晰的**“作战地图”**,直观地告诉您: 关键点位在哪里: (通过 Pivot 和 POC 判断) 谁在主导市场: (观察绿色/红色的成交量标记) 是否值得入场: (利用成交量与突破形态的相互验证)

Chinese (中文) PREDATOR DAILY LEVELS 软件: Predator Daily Levels 自动在 MT5 图表上绘制每日高点、低点和开盘(HLO)线,取代手动标记水平以实现高效交易。它显示多个历史天数,带有描述性标签如“Monday High”,彩色线条(深红色高点、森林绿色低点、浅珊瑚色开盘),并可自定义宽度、样式和字体大小。更新在新柱和图表变化时自动进行,确保所有符号和时间框架的实时精确性。 关键特性
自动 HLO 线:绘制前日高点(PDH)、低点(PDL)和开盘水平,向前延伸 2 天,适合识别支撑/阻力及突破区。 完全自定义:调整颜色、线条样式(实线/虚线)、宽度至 3px、标签可见性、字体大小(默认 20pt)和回溯天数(至 20 天)以适应任何设置。 终身支持:为买家提供代码自定义修改,加上所有市场的非重绘性能。 完美适合日交易员、波段交易员和剥头皮交易员,寻求无延迟或重绘的干净即时每日参考水平。直接消息我或联系 mizzlah17@gmail.com 以进行购后修改。

购买此指标,您就可以免费获得 ICT Concept MT5 或任何其他指标! 私信了解更多详情!
指标:Currency Strength Meter Pro (货币强弱计专业版) 市场广度可视化 (Market Breadth Visualization) 优点: 该指标以整洁的“仪表盘”形式显示,代替了杂乱的图表。交易者只需扫一眼即可知道市场上哪个货币对最强或最弱。 益处: 节省逐个查看图表的时间,并帮助快速做出选币决策。 自动排名与排序 (Auto-Ranking & Sorting) 优点: 拥有“水平排名”模式,自动将货币对从“最强”到“最弱”进行排序。 益处: 让您立即看到日/周/月的赢家 (Winners) 和输家 (Losers),这是相对强弱交易策略的核心。 智能货币逻辑 (Smart Currency Logic) 优点: 在垂直模式下,工具能智能处理基础货币位置不同的货币对(如 EURUSD 与 USDJPY)。系统会自动“反转”数值,使条形图方向与主货币(如 USD)的强弱一致。 益处: 减少分析基础货币或报价货币位置时的混淆。 多时间周期灵活性 (Mul

Buyer Seller Arrows – 自信交易的利器! 发现一个革命性的工具,用于在所有时间框架(从 M1 到 MN1)中直观分析买方与卖方的力量。该指标通过 彩色百分比和箭头 为你提供 即时的市场动态概览 。 主要功能: 绿色向上箭头 = 买方占优 红色向下箭头 = 卖方占优 百分比强度 显示在每个时间框架 (M1, M5, M15, M30, H1, H4, D1, W1, MN1) 颜色编码 让你快速识别趋势(鲜绿色与鲜红色) 工作原理: 跟踪 买卖压力之间的平衡 使用 EMA 与 SMA 计算市场强度 实时显示 趋势主导情况 帮助识别 理想的进场与出场点位 为什么交易者喜欢它: 极其直观 – 无需复杂图表,只看市场力量 快速决策 – 适合剥头皮交易与波段交易 完全可定制 – 根据你的交易风格调整参数 优秀的辅助工具 – 与其他指标结合确认信号
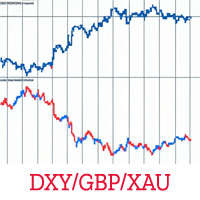
概览
利用 KS Invert Chart Pro 指标,为您的图表分析开启全新视角——这是一款专为 MetaTrader 5 设计的强大且零滞后(zero-lag)的工具。这款创新的指标能够通过数学运算(将价格数据乘以 -1)对K线柱或蜡烛图进行反转,从而揭示传统视角下可能被忽略的隐藏形态、逆向交易机会以及反向关联性。它非常适合那些运用关联交易策略、多周期分析或对冲监控的高级交易者使用。无论您是想在当前图表上捕捉那些难以察觉的形态,还是希望实时同步外部交易品种的数据,该指标都能为您提供即时的洞察,且毫无延迟。
核心优势:
即时反转:将图表上下翻转以获得反向视图——这对于形态识别和逆向交易策略至关重要。
外部品种同步:在同一时间周期或不同时间周期下,显示并反转任意经纪商提供的交易品种(例如,将 EUR/USD 与 GBP/USD 进行对比分析)。
应用广泛:支持美元指数反向分析(结合 EUR/USD 走势验证 DXY 信号)、跨市场关联分析(外汇品种与股指联动),以及实时对冲头寸监控。
高度自定义:可选的颜色互换功能可提升图表的可读性;在所有时间周期下均可无缝顺畅运行。

# SSL ST Strategy MT5 Indicator - Chinese (Simplified) Version
SSL ST Strategy MT5指标是一个技术分析工具,旨在帮助交易者在交易图表上清晰地识别买卖信号。它提供视觉指标(如线条和箭头),以及声音、弹出和推送通知,在出现交易机会时及时提醒交易者。
## 主要优势
- 在图表上直接提供清晰的视觉信号,使用彩色线条(SSL1和基线)和箭头表示买入(绿色三角形)和卖出(红色三角形)信号。 - 支持声音警报、弹出警报和移动推送通知,确保交易者即使不在屏幕前也不会错过重要信号。 - 允许反转信号逻辑,使其适应不同的交易策略或市场条件。 - 使用基于高点、低点和收盘价的指数移动平均线(EMA)以获得更响应和平滑的信号生成。 - 内置过滤功能可防止同一信号柱的重复警报,减少噪音和警报疲劳。
## 输入参数
- **len**: 设置SSL1和基线EMA计算的周期长度(默认60)。 - **show_Baseline**: 选择在图表上显示或隐藏基线EMA线。 - **show_SSL1**: 选择在图表上显示或
FREE

=== 什么是 Scalper Hunting?===
Scalper Hunting 是一款 MT5 指标,它通过结合整体市场环境和多种技术指标,自动生成交易信号。
通过叠加多个指标并应用多重过滤,它只聚焦于高潜力的交易机会,帮助你在更少噪音的环境下更清晰地做出交易决策。 它并不是为了“抓住一次好运气的交易”而设计,而是为了支持一种长期、可持续的交易方式,帮助交易者在结构化、纪律性的框架下,在市场中生存得更久。
购买后,请通过私信联系我们。我们会向您说明本次交易所需的设置信息。
=== 工作原理 === Scalper Hunting 可用于以下市场: XAUUSD(黄金) 主要外汇货币对(如 EURUSD、GBPUSD、USDJPY 等) 指数品种(如 NASDAQ、US30、DAX 等) 支持的交易风格: 低周期的剥头皮交易(Scalping) 日内 / 短线交易(Intraday) 该指标只会在当前K线收盘时给出信号。
它综合考虑: 市场结构(Market structure) 技术指标(Technical indicators) 交易时段与时间过滤(Session and

Metatrader 5 version of the known "Currency Slope Strength" MT4 indicator. This tool was designed to visually measure the strength of major global currencies in real time, allowing to identify trending currencies, reversals, and cross-currency opportunities. Currencies: AUD, CAD, CHF, EUR, GBP, JPY, NZD and USD.
Level Crossing alerts (Pop-up,Push,Email). Customizable timeframes (Main and Extra). Customizable colors. Non-repainting . The indicator runs in Strategy Tester, but it may take a while
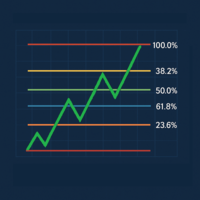
Last Candle Fibonacci is an indicator that makes it easy to see the Fibonacci levels of the previous candle. It can be configured for use on any timeframe, works on major currency pairs, and allows traders to identify reversal zones more clearly. Its design is intended to integrate seamlessly into the chart, highlighting key levels that help confirm pullbacks, potential entries, and targets. It is a lightweight, stable, and practical tool for those seeking a more structured market analysis and t
FREE

Capital Vault System is a professional technical analysis suite for MetaTrader 5 engineered to identify market structure and adaptively filter market volatility. Unlike static indicators, this system integrates three mathematical models— Maximum Entropy Spectral Analysis (MESA) , Fractal Dimension , and Harmonic Geometry —to distinguish between directional trends and non-linear consolidation ranges. It includes an embedded Risk Management Dashboard designed to assist traders in real-time positio

成交量冲量指标(Volume Impulse)能够精准识别出在K线和成交量柱上形成的特定图形模式。它是我亲自设计的一种专有的反转与趋势延续形态。当该形态出现时,通常预示着价格即将朝信号指向的方向发生强劲而迅速的运动。这个信号属于高概率指标,但仍需结合大盘环境与个股具体位置进行过滤。我的经验是:当标的已经处于月线级别的高点时避免盲目追多;当价格已经跌至当月低点附近时,不要急于做空。最佳使用方式是结合关键支撑阻力位、整体趋势方向以及当前市场状态(多头/空头/震荡)一起判断,这样能大幅提高胜率。 输入参数: Volume_Type = tick 或 real(选择使用tick成交量还是实际成交量) MinIncrement = 成交量柱的最小增幅百分比(用于过滤噪音) dist = 信号点距离K线最高/最低点的距离(单位:点数或百分比,用于调整信号敏感度)

Murrey Math Institutional Frame is a technical analysis solution for MetaTrader 5 that transcends conventional indicators. While standard tools like RSI or Moving Averages react with lag, this system utilizes fractal algorithms to project the future geometric structure of the market. This software builds an objective "Reference Frame" on the chart, allowing the operator to visualize volatility and mathematical equilibrium points before price reaches them. Technical Specifications The system inte

Overview Market Volume Profile Modes is a powerful MT5 volume distribution indicator that integrates multiple Volume Profile variants. Users can switch between different analysis modes through a simple menu selection. This indicator helps traders identify key price levels, support and resistance zones, and market volume distribution.
Core Concepts • POC (Point of Control): The price level with the highest volume concentration, representing the market's accepted "fair value" area • VAH (Value A
FREE

http://www.tradepositive.lat
ALGO Smart Flow Structure Indicator The ALGO Smart Flow Structure Indicator is designed for serious traders who use objective Market structure. Forget noise and slow indicators; this tool provides you with a crystal-clear, unambiguous view of structural breakouts across all timeframes. Based on the rigorous rules of the ALGO Smart Flow methodology, the indicator filters out internal structure and only shows you the Major Structural Points (Swing Points) , ensuri
FREE
解锁精准交易:ATR 动态枢轴系统 立即下载这款 免费 的 ATR Pivot Signals 指标,立即在市场噪音中占据优势。对于那些要求基于 真实市场摆动反转 而非猜测来确定高信心入场点的交易者来说,这是终极工具。 ATR Pivot Signals 系统是一款创新的技术指标,它利用 平均真实波动范围 (ATR) 动态过滤波动性,确保仅在价格出现统计学上显著的移动时才触发信号。它通过动态设置 反转阈值 来消除假突破,使其在所有市场条件下都有效——无论是平静的盘整还是爆炸性的趋势。 ATR 动态枢轴指标的关键特点: 动态、过滤噪音的反转: 使用可自定义的 ATR 因子 来调整反转阈值,使其适应当前市场波动性,忽略次要回调。 高信心信号: 直接在主图表上提供明确的 买入 (绿色)和 卖出 (红色)箭头,标记确认主要摆动枢轴的确切价格柱。 不重绘技术: 信号在K线收盘时确认并锁定。该指标采用防闪烁逻辑设计,确保对每个历史和实时信号的信任。 趋势识别: 清晰地跟踪市场状态(上涨/下跌趋势),为您提供简洁的视觉框架来确定方向偏差。 简单且高效: 易于安装,仅有两个关键输入参数可根据您的交易风
FREE

SMC LIQUIDITY Advanced Institutional-Grade Smart Money and Liquidity Analysis Suite for MT5 SMC LIQUIDITY is a comprehensive institutional toolkit engineered for traders who require precise liquidity mapping, market structure intelligence, smart money concepts, and order flow awareness in a single integrated interface. It is designed for professional workflow, multi-timeframe clarity, and seamless execution in fast-moving conditions. This indicator combines several institutional methodologies in
FREE
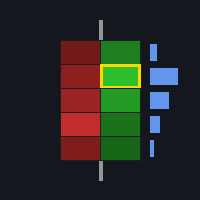
FootprintOrderflow权威指南 (本指标还适配不提供DOM数据和BID/ASK数据的经济商,重点还支持各类外汇交易,DEMO版本 ,模式必须选择“每个点基于实时点”才能正常绘制)
重要提示:在下单前,请先联系我,我将为您提供专业的解答和服务
1. 指标核心理念 Footprint orderflow 是一款基于 订单流(Order Flow) 理论的高级图表工具。与传统的 K 线图只展示 OHLC(开高低收)不同,足迹图通过实时解析 Tick 数据,剖析每根 K 线内部的微观结构。 它能告诉你: 谁在主导? (买方还是卖方) 哪里成交量最大? (机构主要筹码交换区) 价格是否被认可? (停留时间与价值区域) 趋势是否竭尽? (通过背离信号) 关键背离是否需要提醒? (通过背离的信号发送MT5弹窗警告,并推送通知到手机) 2. 图表界面深度解析 2.1 基础足迹图 (Standard View) 在普通模式下,K 线被拆解为一个个价格格子(Bin): 左侧数字 (Bid/Sell) :代表主动卖出成交量(市价卖单撞击买一价)。 右侧数字 (Ask/Buy) :代表主动
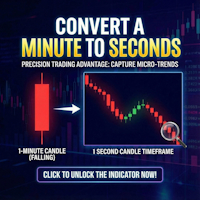
Second Timeframe Pro — See the Market Before Anyone Else!
Unlock a Hidden Level of Price Action
While other traders look at minute candles, you can see 60 candles within each minute!
What is Second Timeframe Pro?
It's a revolutionary indicator that creates full-fledged candlestick charts with second timeframes directly in MetaTrader 5.
Standard MT5 limits you to a minute chart. But the market doesn't stop every minute — it pulsates every second. Second Timeframe Pro removes this limitation

Gold Scalper System is a multifunctional trading system that combines a breakout strategy for key liquidity levels with confirmation and a built-in Smart DOM Pro module for market depth analysis. The system identifies zones of limit order accumulation, tracks activity at support and resistance levels, and generates signals at the moment of their breakout. Smart DOM Pro visualizes Bid/Ask volumes, identifies liquidity clusters, and helps determine the intentions of major market participants. G

SUP – Support & Resistance Zone Detection Tool
The SUP Indicator is a professional trading tool designed to automatically detect and highlight Support and Resistance price zones on any market chart. Using advanced zone-mapping algorithms, it visualizes the strongest price levels where the market frequently reacts — helping traders identify entries, reversals, breakouts, and risk-management areas.
In addition to automatic detection, the indicator also allows you to manually add your own zones,
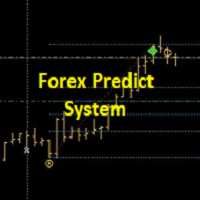
+++++++++++++++++++++++++++++++++++++++++++++++++++++++++++++++++++++++++++++++++++++++++++++++++ +++ Link to EURUSD Only Free Version --> https://www.mql5.com/en/market/product/156904?source=Unknown +++++++++++++++++++++++++++++++++++++++++++++++++++++++++++++++++++++++++++++++++++++++++++++++++ Hallo Trader, This is a traditional GANN & FIBONACCI strategy based on detection of an impulsive move in the opposite direction. This is called a Breakout. At the moment of Breakout, the indicator draw
+++++++++++++++++++++++++++++
+++ FREE VERSION - EURUSD ONLY
+++++++++++++++++++++++++++++
Please add PREFIX and/or SUFFIX via settings if your Broker Chart Symbol is different (e.g. suffix = .r).
+++
This is forecast system.
On the moment of the breakout/forecast: the indicator draws retrace zone (yellow) and three targets. The levels act as support and resistance. It can be used on all pairs/indices/timeframes/periods. For the higher timeframes (H4, H1, M30) it's better to engage at Optima
FREE
Timeframe Simulator Indicator This indicator redraws candlestick structures from a higher timeframe onto your current chart. It helps visualize higher-period price action without switching timeframes, making it easier to analyze trends and key levels while trading on lower timeframes. Main features: Customizable Candles – Adjust the appearance of higher timeframe candles (bull/bear colors, wick style, gaps, and history length). Higher Timeframe Lines – Optionally display dynamic high, low,
FREE

My other indicators:
https://www.mql5.com/en/market/product/156702 (FREE)
https://www.mql5.com/en/market/product/153968 (FREE)
https://www.mql5.com/en/market/product/153960 (FREE) This indicator displays higher timeframe candles directly on your lower timeframe chart, allowing you to monitor higher timeframe price action without switching between charts. It also plots session highs and lows for the Asia, London, and New York kill zones, giving you key liquidity levels directly on your chart. Wh
FREE

Mystic Pulse V2.0 是一款专注于捕捉市场趋势强度与动能变化的技术指标,它基于方向性动能系统(Directional Movement System),主要依赖 DI+ 与 DI− 的变化来判断市场中多头与空头力量的增强或减弱。指标的核心思想是:市场趋势的真正力量来自“连续性”。也就是说,不仅要看动能是否增强,还要观察这种增强是否能够在多根 K 线中持续出现。 在运行过程中,指标会分别对 看涨动能持续增强 和 看跌动能持续增强 进行计数,形成两个独立的计数序列: 正向计数(Positive Count) 代表多头动能的连续上升,反映上涨压力越来越强。 负向计数(Negative Count) 代表空头动能的连续增强,反映下跌压力不断累积。 一旦 DI+ 的强度超过 DI− 并且持续增强,正向计数便会增加;反之,当 DI− 持续增强并占据优势时,负向计数会递增。当趋势动能减弱或出现反转迹象时,计数器会自动归零,这不仅可以帮助交易者识别趋势延续,也能提示潜在的反转时机。通过可视化的柱状显示,用户可以直观地看到趋势力量是否在持续积累,或是否已经出现衰退。 Mystic Pul
FREE

The indicator is stable on noise fluctuations in price and quickly reacts to the trend. It is based on an algorithm from a system of hyperbolic functions that allows you to aggressively smooth the flat with minimal lag on the trend. It can be applied directly to the price chart, to itself, or to other indicators in order to eliminate false signals. The main purpose of the indicator is to smooth out small sawtooth price movements as much as possible. The higher the Hyperbolic parameter, the stron

Global Session 4X Indicator Global Session 4X is a visual indicator that displays active Forex trading sessions around the world in real time. Designed with precision and respect for market diversity, it covers financial hubs such as London, New York, Tokyo, Sydney, São Paulo, Istanbul, Riyadh, Toronto, and more. Each session is shown as a color-coded band highlighting the most traded currency pairs in that region. The layout is clean, modern, and fully customizable — traders can choose which se
FREE
RSI Bollinger DualStrike Signals offers a clear and structured approach to identifying areas that may be favorable for potential trend reversals. By combining the RSI with Bollinger Bands, the indicator highlights moments when price shows signs of pressure or loss of momentum. The BUY/SELL signals help traders make more organized and disciplined decisions. It is a useful tool for scalping, day trading, or swing trading not to predict the market, but to improve the reading and understanding of pr
FREE

Volatility Break Signals Description:
The Volatility Break Signals is an indicator designed to detect potential trend changes while partially filtering market noise. It uses an adaptive volatility measure based on the selected price (Close, Open, High, Low, etc.) and generates Buy and Sell signals when the price shows a reversal relative to the previous direction. How it works: Price Volatility Measurement The indicator calculates the absolute price changes from bar to bar ( |price - previous
FREE
ZigZag Reversal Detector Signals This is a technical indicator based on the ZigZag principle, designed to automatically detect market reversal points and generate clear buy and sell signals. Customizable Parameters ️: Level : Determines the sensitivity of the ZigZag to price changes. Ecart : Sets the minimum distance between two ZigZag points. Rebond : Adjusts the confirmation threshold for a reversal. Alerts & Notifications : Enable or disable according to your needs. Pe
FREE

Trading Sessions by Mahefa R is an indicator for MetaTrader 5 that visually identifies the four main trading sessions: New York, London, Tokyo, and Sydney . Designed to provide a clean, intuitive, and professional market view, it highlights the most active periods of the Forex market using smart visualization of session ranges , session-specific candle colors , and daily separators . Main Features: Automatic detection of the 4 major sessions New York London Tokyo Sydney Each session is fully c
FREE
This is MT5 version only. For MT4 visit: https://www.mql5.com/en/market/product/156000/
Detailed blog post with screenshots: https://www.mql5.com/en/blogs/post/765529
Features Overview Bull and Bear Power Visualization: Histograms or Lines or Bands Combined Bull/Bear Power (BBP) Mode: To see the net power balance Customize Colors: for instant pattern recognition Smoothing (Optional): reduces noise for cleaner signals Additional Filter Options: Price Divergence visualization to spot potential

BOS and CHoCH Detector is an indicator designed to detect BOS (Break of Structure) and CHoCH (Change of Character) within the Smart Money Management strategy. It helps traders get a clearer view of the market on the chart and optimize their trading strategy. An additional advantage of this indicator is its color system: Green : signals a high probability of a buy opportunity. Red : signals a high probability of a sell opportunity. This tool is perfect for gaining clarity and confidence in your t

New Trend Stage -is a unique next-generation indicator that creates dynamic projections of market movement based on real data of the current day. These are not classical channels. This is an enhanced system of proprietary geometry built on the principles of time offsets, range dynamics, and adaptive levels.
The indicator automatically identifies and calculates the true range for the past N hours relative to each extremum and constructs precise, direction-based projections of future price moveme

TrendView Zero — Zero Setup. Zero Complexity. Maximum Clarity. Over time, we received valuable feedback from traders who tested TrendView Ultimate, our most advanced indicator. Many loved its power and depth, but also shared a common challenge: “It’s incredibly powerful, but it gives SO much information that I don’t always know what to configure.” This inspired the creation of TrendView Zero, a fully automated, streamlined version that keeps only the information that matters most. It provide

优化版MACD增强工具 (MT5专属) 专为短线/超短线交易者量身打造,核心亮点重构高频交易信号体系:
双维度信号同步 主图叠加**动态趋势线**,副图升级强化版MACD——含多色能量柱(红柱加深=空头累积,绿柱延展=多头释放)+ 经典双线交叉,主副图信号实时联动,精准捕捉涨跌拐点。如图中框选区域,从初期异动到明确转向的趋势反转信号全程清晰追踪,彻底规避信号滞后与误判风险。
高波动行情适配 针对加密货币、外汇等高频品种特性深度优化,弱化长期趋势干扰,强化短期波动响应能力。以12月1-3日脉冲行情为例,急涨急跌中信号同步性显著提升,紧密跟随价格节奏输出有效交易指引,完美适配高频交易场景需求。
可视化门槛低 无需复杂公式计算,仅通过能量柱颜色分层与主图趋势线方向联动,即可快速识别多空节奏。新手无需长时间磨合,上手即可精准把握交易时机,大幅降低短线/超短线交易的操作门槛与学习成本。
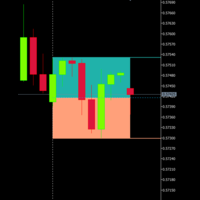
If you like this product, please give it a 5 star rating as a token of appreciation.
This CRT indicator draws the premium and discount zones of a single candle from any timeframe on your chart.
You choose which candle (current or previous) using CandleOffset, and the indicator automatically retrieves that candle’s high, low, and midpoint which is the same as CANDLE RANGE THEORY (CANDLE RANGE THEORY).
It then visually displays:
Premium Zone (Upper 50%)
A shaded rectangle from the candle’s midp
FREE
Volumized OrderBlocks MTF - Multi-Timeframe Volumetric Order Block Indicator
OVERVIEW
Volumized OrderBlocks MTF is an advanced Multi-Timeframe Order Block indicator that automatically detects, displays, and merges Order Blocks from up to 3 different timeframes on a single chart. Built with institutional Smart Money Concepts (SMC) method
FREE

Advanced SMC & Volumetric Order Block Indicator Overview
This enhanced-grade for MetaTrader 5 indicator is designed to decode market behavior using Smart Money Concepts (SMC) method . It goes beyond standard price action analysis by integrating Volumetric Data directly into market structure, helping traders identify high-probability reversal and continuation zones with precision. Key Features Volumetric Order Blocks: A unique, split-gauge visualization within Order Block zones that disp
FREE

Hull Suite by Riz | MT5 Indicator Overview: Hull Suite is a premium trend-following indicator that combines three powerful Hull Moving Average variations (HMA, EHMA, THMA) into one versatile tool. Designed for traders who demand clarity and precision, this indicator helps identify trend direction with minimal lag while filtering out market noise. Key Features: Three Hull Variations – Switch between HMA (classic), EHMA (exponential smoothing), and THMA (triple weighted) to match your trading styl
FREE
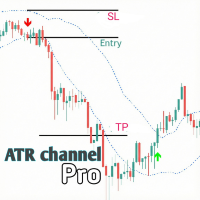
This is an indicator called ATR Channel. This indicator is made with ATR and VWMA (Volume Weighted Moving Average). This indicator will work best in a volatile market. So please try to trade during high volatile sessions and high volatile pairs.
Rules:
• Pair: Bitcoin, Gold, Nasdaq (US100) or S&P (US500) •Do not trade Forex pairs because they are low volatile.
Session: Only US session (especially start after the first 15-minute candle closes )
Trading hours: First 4 hours of the US Session .

MultiSession Volume Profile is a professional volume profile indicator for MetaTrader 5 that builds separate POC, VAH, VAL and volume histograms for multiple custom trading sessions on the same chart. It helps you see where volume truly concentrated in each part of the day (RTH, Globex, Asia, London, etc.), so you can identify key intraday levels, ranges, and magnets that many standard tools miss. Main advantages Multi-session profiles
Build up to 5 fully independent sessions with custom times
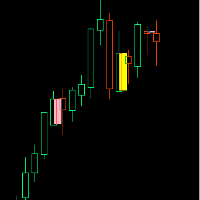
If you like this product, please give it a 5 star rating as a token of appreciation.
Inside Bar: A candle that is completely contained within the high-low range of the previous candle
Outside Bar: A candle that completely engulfs the high-low range of the previous candle (also called an "Engulfing Bar")
Inside Bars Consolidation Signals : Indicates market indecision/compression Breakout Setup : Often precedes significant price moves Continuation Patterns : Can signal pause in trend before con
FREE
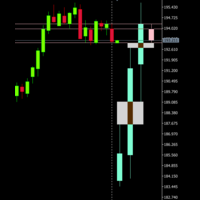
If you like this product, please give it a 5 star rating as a token of appreciation. This indicator projects Higher-Timeframe (HTF) candles onto the current chart and optionally shows their OHLC lines and Fair Value Gaps (FVGs) using ICT 3-candle logic.
Projects multiple higher timeframe candles.
Accurately preserves HTF OHLC on any lower timeframe.
Allows spacing adjustment between projected candles.
Optionally displays OHLC horizontal reference lines.
Automatically detects and draws HTF Fair
FREE

If you like this product, please give it a 5 star rating as a token of appreciation.
This indicator plots horizontal trend lines at the opening price of each quarter (Q1–Q4) on the chart. These lines visually represent quarterly open levels of the current year, which traders often use as support/resistance or reference points. Automatically plots Q1–Q4 opening levels as trend lines on the chart. Lines are dashed, colored, and labeled. Handles both current and historical quarters. Cleans up line
FREE

If you like this product, please give it a 5 star rating as a token of appreciation.
This indicator calculates and draws pivot points and support/resistance levels for both daily and weekly timeframes: Pivot (central) level Support levels S1, S2, S3 Resistance levels R1, R2, R3 It allows showing daily, weekly, or both sets of pivots , giving traders visual references for potential support/resistance areas.
Pivot mode: Choose which pivots to display (weekly, daily, or both). Colors and style: C
FREE
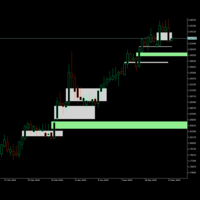
If you like this product, please give it a 5 star rating as a token of appreciation.
This indicator identifies and displays Fair Value Gaps (FVG) on price charts.
Fair Value Gaps are price zones where there's a significant imbalance between buying and selling pressure, creating "gaps" in price action. The indicator detects two types and when they are mitigated(touched):
Bullish FVG: When a candle's low is above the high of a candle two periods earlier.
Bearish FVG: When a candle's high is bel
FREE

If you like this product, please give it a 5 star rating as a token of appreciation.
This indicator draws vertical lines marking key Forex trading sessions (Asian, London, New York) for a configurable number of past days. These “Silver Bullet” lines help traders quickly visualize session start and end times on the chart.
DaysToDisplay: How many previous days’ session lines to show. Session colors: Customizable line colors for each session. Session start hours: Local server hours for each sessi
FREE

If you like this product, please give it a 5 star rating as a token of appreciation.
This indicator plots horizontal lines on the chart representing the previous year’s high and low prices . These levels are widely used in technical analysis as major support/resistance references.
Automatically identifies the previous calendar year’s high and low . Plots horizontal lines on the chart at these levels. Customizable color, width, and style of the lines. Deletes lines on deinitialization. Updates
FREE

SuperTrend Pro MT5 - The Ultimate Trend Following System
For MT4 version : https://www.mql5.com/en/market/product/156454
Unlock the full potential of the SuperTrend indicator on MetaTrader 5. Designed for traders who need precision and performance. SuperTrend Pro MT5 is a next-generation trading system built for the modern trader. It combines the classic SuperTrend with advanced Multi-Timeframe (MTF) analysis and smart filtering to identify high-probability setups on the MT5 platform. Why Sup
The Trend Duration Forecast MT5 indicator is designed to estimate the probable lifespan of a bullish or bearish trend. Using a Hull Moving Average (HMA) to detect directional shifts, it tracks the duration of each historical trend and calculates an average to forecast how long the current trend is statistically likely to continue. This allows traders to visualize both real-time trend strength and potential exhaustion zones with exceptional clarity. KEY FEATURES Dynamic Trend Detection: Utiliz
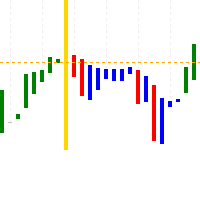
L3 Banker Fund Flow Trend Oscillator v5 is a simple translation of blackcat's work from pine script (language used by TradingView platform) to mql5. It generates buy and sell signals when two calculated buffers cross over each other in the oversold and overbought oscillator territory. Current version does not offer any changable inputs, but could be easily added in the modified version if requested.

Indicator shows balance curves based on magic number for portfolio analysis. It allows to visually estimate different strategies performance on a single symbol. Any of magic number can be hidden by clicking on the value in legend. Parameters: HideAllOnStart - all magics are hidden and can be activated by clicking on its value; MAMode - shows average profit from trades; MAPeriod - Moving average period; Magics - a string with magic numbers separated by comma like "1,2,123". If this field is empty

Overlay higher timeframe candles onto the lower timeframe candles for both live time trading and back testing to see how higher timeframe candles are formed with lower timeframe candles. Helps traders to see the multi timeframe alignment between timeframes in each moment to find refined entry within market structure. Give the trader a full view of price across all timeframes by just looking at one timeframe.

Key Features Visual Risk/Reward Planning Spawns interactive rectangles on the chart for Buy and Sell setups. Pink Box: Represents your Risk (Entry to Stop Loss). Green Box: Represents your Reward (Entry to Take Profit). The Green box automatically adjusts its size based on your preferred Reward Ratio (e.g., 1:2). Auto-Lot Calculation Automatically calculates the correct Lot Size based on your Account Balance and defined Risk Percentage. Takes into account the symbol's Tick Value and Cont
ICT Kill zones Professional Automate your ICT & Smart Money analysis with precise, dynamic session tracking and liquidity pivots. Here our more valuable tools
SMC Trend Trading , Easy SMC Trading , Institutional SMC Architect Volume Analysis Tools , Volume flow Profile , Market volume profile , FVG with Volume , Liquidity Heatmap Profile , Volume Spread Analysis Product Description Stop wasting time drawing boxes and lines every single day. ICT Killzones Professional is the u

Liquidity Channels Pro MT4 HERE is a sophisticated Smart Money Concepts (SMC) tool designed to automate the identification of Buy Side Liquidity (BSL) and Sell Side Liquidity (SSL) . Unlike standard support and resistance indicators, this tool doesn't just draw lines; it projects dynamic expanding channels based on volatility (ATR) from key pivot points. Crucially, it follows the "Mitigation" logic used by institutional traders: once liquidity is taken (price touches the level), th
N/B: All our product purchase comes with our free ‘’DAILY SCALPER EA’’ - bit.ly/4qlFLNh Whatsapp Developer for yours after successful purchase
Premium Breakout Scanner Indicator: Your Institutional-Grade Breakout Trading System
DISCOVER HIGH-PROBABILITY BREAKOUTS BEFORE THEY HAPPEN
THIS IS A FOUR-CANDLE BREAKOUT STRATEGY/SYSTEM WITH 70%+ ACCURACY .
Tired of missing breakout moves? Entering too late? Getting stopped out by false breakouts? The Premium Breakout Scanner combines instit

Dynamic Market Watch & Timeframe Dashboard (MT5 Indicator) 1. Product Overview The Dynamic Market Watch & Timeframe Dashboard is a professional chart navigation utility designed for MetaTrader 5. It transforms the static "Market Watch" list into an interactive, on-chart control panel. Designed for efficiency, this indicator creates a clean, vertical tiling system that allows traders to switch between assets and timeframes instantly with a single click. It features an intelligent auto-layou

Extreme Confirmation: Momentum and Trend Oscillator Extreme Confirmation is a technical oscillator designed to filter market noise and provide visual confirmation of trend direction and potential reversal zones. By combining dual-period momentum analysis with a dynamic signal cloud, the indicator assists traders in identifying technical entry and exit points across various market conditions. Key Features Dual-Line Crossover: Utilizes Fast (13-period) and Slow (34-period) calculations to detect

MercariaPattern1-2-3 відстежує рух ціни, знаходить трьоххвильові структури 1-2-3 та підсвічує момент, коли сценарій підтверджується пробоєм ключового рівня. MercariaPattern1-2-3 tracks price movement, detects three-leg 1-2-3 structures and highlights the moment when the scenario is confirmed by a key level breakout. Індикатор збирає локальні свінги в компактну фігуру 0–1–2–3 , чекає підтвердженого пробою та будує стрілку входу з готовими рівнями SL/TP. The indicator combines local swings into a

The indicator reads MT5’s built-in economic calendar and organizes events into three horizontal lanes : High-impact events (red) Medium-impact events (orange) Low-impact events (gray) (optional) Each lane scrolls horizontally across the chart like a ticker. You can choose whether to show: Today’s events only Or all events for the current week This is a complete fundamental dashboard for MT5. It gives you: Real-time scrolling economic events
Interpreted color-coded results
Day/Week filterin

Session Finder — Professional Multi-Session Market HUD for MetaTrader 5 Stop guessing when volatility will strike. Trade with absolute timing precision. Session Finder is a premium, high-performance on-chart dashboard engineered for MetaTrader 5. It gives day traders, scalpers, and swing traders real-time visibility into the world's major trading sessions— Sydney, Tokyo, London, and New York . By tracking exact market overlaps and session transitions right on your active chart, you can easily hu

Gold Beast XAUUSD – The Ultimate Gold Arrow Indicator
After 6+ years and tens of thousands of real trades, this is the FINAL and most powerful Gold arrow system ever released.
Gold Beast XAUUSD : • Arrows ( confirmed only at candle close ) • Blue upward arrow = BUY • Red downward arrow = SELL • Pure EMA × RSI crossover – zero lag, zero fake outs • Pre-loaded with the best XAUUSD settings (EMA 7 – the Gold holy grail) • Push, Email + Sound alerts included
Default Beast Settings (already loade

Delta + CVD & CVD Candles
Order-flow indicator combining Delta (Ask–Bid), Cumulative Volume Delta (CVD), and a unique CVD-based synthetic candle system. Shows buy/sell pressure, volume aggressiveness, and momentum shifts with optional Delta histogram, CVD line, and CVD+Delta combined candles. Useful for scalping, intraday trading, divergence detection, and understanding buyer/seller dominance. Overview The Delta + CVD & CVD Candles Indicator combines multiple order-flow tools into one clean
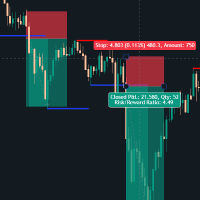
Support & Resistance Breakout Indicator This custom-built MT5 indicator automatically identifies key price levels where the market has historically reversed (support and resistance zones) and alerts traders when these levels are broken with conviction. What it does: The indicator scans price action to detect significant swing highs and lows, then draws dynamic support and resistance lines that extend forward until they're either replaced by a new level or broken by price. When a breakout occurs,

SuperTrend Plus Dema – Faster Trends, Less Noise SuperTrend Plus Dema is an advanced evolution of the classic trend-following indicator. Unlike standard SuperTrend indicators that rely solely on High/Low or Close prices, this tool integrates the Double Exponential Moving Average (DEMA) as a calculation source. This unique combination offers a smoother trend line with significantly reduced lag, allowing you to catch trends earlier while filtering out market noise. Why use SuperTrend Plus Dema? Re
Indicator logic (quick summary) Retail sentiment input : You type in current retail long % from MyFxBook/FXSSI/etc. If > 60% long → contrarian bearish If < 40% long → contrarian bullish Else → neutral Trend bias : EMA(50) vs EMA(200) → primary trend MACD(6,13,5) direction as confirmation Volatility bias : ATR(14) vs ATR(50) → expansion ratio Too low/too high volatility → “AVOID” Session bias : Time-based classification (server time): Asia, London, New York Just a label + “quality fact

Smash FX System — Inside-Bar Breakouts, Reversals & Continuations (Indicator) Tagline: Smash the noise, catch the clear moves — high-clarity inside-bar breakout, reversal and continuation arrows designed for clean entries and professional journaling. Short promo Smash FX System pinpoints high-probability inside-bar breakouts, smart reversals and continuation setups with on-chart arrows and exact levels — built for traders who want clear, repeatable setups and perfect order-management handoffs f
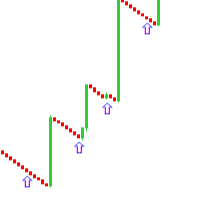
LES PIDO POR FAVOR QUE CUANDO ADQUIERAN EL PRODUCTO SE COMUNIQUEN CONMIGO PARA DARLES LOS PARÁMETROS CORRECTOS
Este indicador de trading funciona en los pares de índices sintéticos; Boom 1000, boom 900, boom 600, crash 1000, crash 900, crash 600 , en la temporalidad de M1 y este indicador es mas preciso con indicador y para obtenerlo te puedes comunicar al 0967713191 te obsequiare dos indicadores por la compra de este. Este indicador sirve para cazar picos y si quieres mas precisión y confian
MetaTrader市场是 出售自动交易和技术指标的最好地方。
您只需要以一个有吸引力的设计和良好的描述为MetaTrader平台开发应用程序。我们将为您解释如何在市场发布您的产品将它提供给数以百万计的MetaTrader用户。
