 MetaTrader 5
 Experts
 Indicadores
 Bibliotecas
 Utilitários
 Widgets
 Regras
Conheça o Mercado MQL5 no YouTube, assista aos vídeos tutoriais
Como comprar um robô de negociação ou indicador?
Execute seu EA na
hospedagem virtual
hospedagem virtual
Teste indicadores/robôs de negociação antes de comprá-los
Quer ganhar dinheiro no Mercado?
Como apresentar um produto para o consumidor final?
Novos Indicadores Técnicos para MetaTrader 5 - 113
 É com base nos sinais de indicadores técnicos que se aplicam as decisões para abertura ou fechamento de uma transação nos mercados de ações e Forex. A essência dos indicadores reside na previsão de mudanças de preço, com base na conversão matemática de preço e/ou volumes de um instrumento financeiro.
Teste os indicadores técnicos para prever melhor o comportamento do mercado e lucrar com isso.

- What does this do?
This indicator draws the standard EMAs used in Steve Mauro's BTMM (Beat the Market Maker) method:
• The 5 EMA (Mustard)
• The 13 EMA (Ketchup)
• The 50 EMA (Water)
• The 200 EMA (Mayo)
• The 800 EMA (Blueberry)
- What improvement does this indicator offer?
The original version provided by Steve Mauro was for MetaTrader4. This is for MetaTrader5.
The original version provided by Steve Mauro misplaced the EMA-crossover arrows. This indicator handle
TuMz TrendSignal – Your Reliable Trading Compass in Volatile Markets Tired of noisy indicators that give false signals? Meet TuMz TrendSignal — a clean, non-repainting, ATR-based trend indicator built for serious MT5 traders. Using a smart combination of mid-price (HL/2) and adaptive ATR bands , TuMz TrendSignal dynamically draws: Green trend line during uptrends Red trend line during downtrends Dotted support/resistance zones that adjust to market volatility Clear buy/sell arrows at tr

- What does this do?
This indicator draws the standard session boxes used in Steve Mauro's BTMM (Beat the Market Maker) method:
• Asian session boxes
• Brinks boxes: London and New York session changeover boxes
• New York session boxes
• Stop-hunt boxes
- Is this for me?
If you use the BTMM trading system and you are on MetaTrader5, this is for you.
• The one provided by Steve Mauro was for MetaTrader4. This is its first MetaTrader5 adaptation. You cannot find this anyw
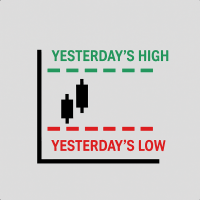
- What does this do?
This indicator draws previous day's high and low as blue tracers on the chart. It is used in Steve Mauro's BTMM (Beat the Market Maker) method.
- What improvement does this indicator offer?
The original version provided by Steve Mauro was for MetaTrader4. This is the first adaptation for MetaTrader5.
Highly optimized for computing resources. It does not affect your computer's performance at all.
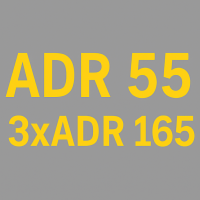
- What does this do?
This indicator show the ADR and 3xADR on the chart. It is used in Steve Mauro's BTMM (Beat the Market Maker) method.
It also mark the ADR High and ADR Low as vertical line segments.
- What improvement does this indicator offer?
The original version provided by Steve Mauro was for MetaTrader4. This is the first adaptation for MetaTrader5.
Highly optimized for computing resources. It does not affect your computer's performance at all.

SMC Indicator for MT5 – Trade Like Institutions Unlock the power of institutional trading with the Smart Money Concepts (SMC) Indicator for MetaTrader 5 . Designed for traders who want to go beyond retail strategies, this advanced tool helps you identify market structure shifts, order blocks, liquidity zones, and fair value gaps with precision and clarity. Key Features: Automatic Market Structure Detection : Instantly spot Breaks of Structure (BOS), CHoCH, and trend shifts. Multi-Timeframe
Super Trend Entry Signal Indicator is a powerful trading tool designed to identify precise entry points based on market volatility. Using the Average True Range (ATR) as its core, this indicator dynamically adjusts to current market conditions — helping traders spot potential breakout or reversal opportunities with confidence. Key Features: - Volatility-Based Entries: Calculates entry zones using real-time ATR values for adaptive precision. - Multi-Timeframe Support: Works seamlessly on any time

Synthetic Trend AI — um indicador de tendência inteligente com tecnologia de inteligência artificial Com base na lógica de negociação, foi criado um consultor de negociação. EA Super Trend XAUUSD
O indicador Synthetic Trend AI é uma poderosa ferramenta de análise técnica que combina a fórmula clássica do SuperTrend com algoritmos de inteligência artificial (k-Nearest Neighbors, KNN) e análise de volume. Ele foi desenvolvido para quem deseja analisar o mercado com mais profundidade e tomar d
FREE

# Velas de Alta, Baixa e Base - Reconhecimento Profissional de Padrões
## Visão Geral
Velas de Alta, Baixa e Base é um sistema profissional de identificação de padrões de velas projetado para ajudar os traders a identificar zonas de oferta e demanda de alta probabilidade. Este indicador identifica e destaca automaticamente três tipos de velas essenciais que formam a base das estratégias de negociação institucionais: Velas de Alta (forte pressão de compra), Velas de Baixa (forte pressão de ven
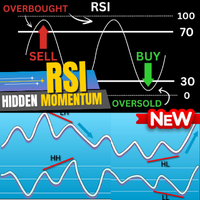
The Real RSI – Caçador de Divergências Profissional Visão Geral The Real RSI é um indicador profissional de detecção de divergências, desenvolvido para traders que buscam precisão em nível institucional na identificação de sinais de reversão e continuação baseados no RSI.
Ele detecta automaticamente divergências regulares e ocultas entre o preço e o RSI, confirmando cada configuração por meio de uma lógica inteligente de pivôs e validação estrutural em tempo real.
O indicador foi projetado para
FREE
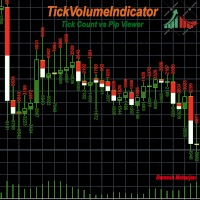
Existem vários indicadores e métodos para identificar tendências num gráfico. O TickVolumeIndicator é um deles. Ajuda a identificar e prever tendências futuras, exibindo tendências passadas utilizando dados de ticks.
O TickVolumeIndicator é um indicador que desenha cores em candles visíveis no gráfico utilizando os volumes dos ticks. Os volumes de ticks são valores de compra e venda. Os utilizadores podem escolher entre as contagens de compra e venda do tick ou as alterações de pips para o per
FREE
Sobre o Range Explosion Range Explosion é uma ferramenta de trading poderosa e gratuita, projetada para detectar faixas de preço, desenhar zonas precisas de suporte e resistência e identificar oportunidades de rompimento com precisão e estilo.
Faz parte do projeto Break Out Explosion, oferecendo uma solução confiável e visualmente avançada para traders iniciantes e profissionais. Se você tem interesse em estratégias de rompimento, conheça a ferramenta avançada desenvolvida para detectar rompimen
FREE
Advanced UT BOT ALERTS for MT5 Sistema profissional de detecção de tendência com múltiplos filtros | Motor UT BOT aprimorado Nós fornecemos apenas indicadores de alta qualidade. Advanced UT BOT foi desenvolvido para uso profissional, com lógica de sinal estável e cálculo seguro que evita atrasos ou atualizações incorretas.
Ele não redesenha, remove nem altera sinais passados.
Todos os sinais de BUY e SELL são gerados somente após o fechamento da vela , garantindo estabilidade e precisão.
No modo

Scanner Intelligence Hub - Multi-Active Monitoring 28+ Pairs Stop jumping from one chart to another. Scanner Intelligence Hub is the ultimate command center for the professional trader. Monitor dozens of assets and multiple timeframes from a single dashboard.
Technical Capabilities:
Real-time scanning: It detects candlestick patterns, mean crossovers, and RSI levels in 28 pairs simultaneously.
Customizable Panel: Choose which indicators and timeframes you want the Scanner to monitor f

Haven Fibonacci Volume Profiles — Seu Analista Automático de Faixas de Mercado Apresentando o Haven Fibonacci Volume Profiles — uma ferramenta poderosa que leva a análise de mercado para o próximo nível. Este indicador identifica automaticamente as principais faixas de preço, construídas em pontos de pivô significativos, e sobrepõe em cada uma delas um Perfil de Volume detalhado juntamente com os níveis de Fibonacci. Isso permite que os traders vejam instantaneamente onde a liquidez está concent
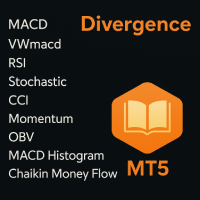
Multiple Divergence Detection System for MT5 Sistema de detecção e visualização de divergências multi-indicadores (Regular / Hidden, 10 fontes de indicadores, leve e eficiente) Valor principal • Visualização unificada – Detecta automaticamente divergências regulares e ocultas entre preço e indicadores, exibindo linhas de ligação e rótulos claros.
• Análise de múltiplas fontes – Inclui MACD / MACD Histogram / RSI / Stochastic / CCI / Momentum / OBV / VWMACD / CMF / MFI.
É possível

O LogVar é um indicador que calcula e exibe a variação logarítmica do preço , uma forma mais precisa de medir as mudanças percentuais entre períodos. Ele compara o preço de fechamento atual com o fechamento de n períodos atrás (definido pelo parâmetro iPeriod ) e apresenta o resultado em uma escala logarítmica amplificada, facilitando a visualização da força e direção da variação. A linha é colorida automaticamente conforme o sinal da variação: Verde: o preço atual está acima do valor logarítmi
FREE

Média Móvel Adaptativa AMD (AAMA)
AAMA é um indicador de média móvel adaptativa para MetaTrader 4 que ajusta automaticamente sua sensibilidade de acordo com as condições do mercado. Principais recursos: Média móvel adaptativa baseada na razão de eficiência de Kaufman – reage rapidamente em tendências e filtra o ruído em mercados laterais Detecção automática das 4 fases do mercado AMD: Acumulação, Markup (alta), Distribuição, Markdown (baixa) Adaptação à volatilidade via ATR – ajusta a sensibili
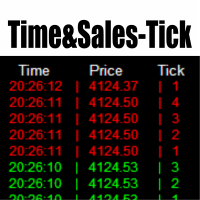
O Time & Sales Tick Indicator é um indicador para MetaTrader 5 que exibe informações de ticks em tempo real.
Ele mostra preço, volume e horário diretamente no gráfico, permitindo análise precisa da atividade do mercado.
Funcionalidades Exibe dados de ticks (preço, volume e hora) em um painel sobre o gráfico. Agrupa os ticks em intervalos definidos pelo usuário, com cores diferentes (verde para alta, vermelho para baixa). O painel pode ser posicionado em qualquer canto do gráfico, com ajuste de t

Indicador Institucional de Compressão de Liquidez O indicador mede o aperto de liquidez em tempo real utilizando a largura normalizada das Bandas de Bollinger, o volume e o spread médio, a fim de identificar fases de compressão antes das rupturas de preço. Exibição:
Janela separada em estilo profissional, com histograma “Compression Score” e linha de limiar (“Threshold”). Principais Características Deteção antecipada: Identifica zonas de contração antes dos impulsos de preço. Medição multifator

Simple Delta - Client Description
Simple Delta is a clean and efficient volume delta indicator for MetaTrader 5 that displays normalized buying and selling pressure above each candle.
What You Get
The indicator analyzes real-time tick data to calculate the delta (buy volume minus sell volume) and displays a single normalized value (-10 to +10) above each candle. **Positive values** indicate buying dominance (displayed in your chosen buy color), while **negative values** show selling pressu

DS Candle Percent Panel – Visão completa do mercado em um só olhar O DS Candle Percent Panel é um indicador avançado que exibe em tempo real a variação percentual do preço em relação à abertura de cada candle nos principais timeframes — de M1 até D1 , incluindo períodos personalizados como H2 e H6 . Com ele, você não precisa mais alternar entre múltiplos gráficos para entender se o mercado está subindo em H1 enquanto cai em M1. Tudo é mostrado de forma clara, coerente e instantânea , diretam

Benefits and Usage of the Volume Bubble Tool This tool, (one of my favorites by Algo Alpha, from Tradingview) provides an advanced method of volume analysis by moving beyond traditional histograms. It leverages statistical normalization (Z-score) on lower-timeframe data to identify and classify statistically significant volume events, visualizing the dynamic between "Smart Money" (institutional) and "Retail" participants. Core Benefits Intuitive On-Chart Visualization: By plotting volume as bub

SMC Donchian Suite The SMC Donchian Suite for MetaTrader 5 is a comprehensive, all-in-one indicator that combines the power of Donchian Channels, Anchored VWAP, and Visible Range Volume Profile (VRVP) to provide a complete and actionable view of the market. It's designed for traders who want to understand market structure, volume, and momentum in a single, integrated tool. Key Features: Multi-faceted Market Analysis: The indicator integrates three powerful analytical tools: Donchian Channels: T
FREE

SMC Donchian Fusion ZigZag This indicator for MetaTrader 5 provides a comprehensive multi-timeframe trend analysis by fusing signals from the ZigZag indicator across three different timeframes (Entry, H1, and H4). It is designed to give you a clear and immediate understanding of trend alignment and potential entry points. Key Features: Multi-Timeframe Analysis: Combines ZigZag data from three user-defined timeframes (defaulting to M15, H1, and H4) to create a powerful, unified trend signal. Nor
FREE
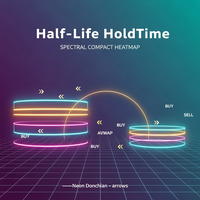
Half-Life HoldTime Spectral Compact Heatmap The Half-Life HoldTime Spectral Compact Heatmap indicator for MetaTrader 5 provides advanced analysis of suggested hold times for trades using AR(1) half-life estimation, spectral cycle fusion, and a confidence heatmap. This tool helps traders optimize their position management by visualizing the most probable hold durations and market regimes. Key Features: AR(1) Half-Life Estimation: Calculates the suggested hold time for a position using autoregres
FREE

SMC Donchian CandleBlend The SMC Donchian CandleBlend for MetaTrader 5 is a powerful indicator that simplifies your chart analysis by coloring candles based on a fusion of signals from two powerful indicators: the "SMC Donchian Trend Breakout" and the "SMC Donchian Fusion ZigZag". This provides a clear and immediate visual representation of market sentiment, helping you to make more informed trading decisions. Key Features: Fused Signal Logic: The indicator intelligently combines signals from t
FREE
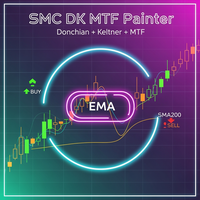
SMC Donchian Keltner MTF Trend Painter The SMC Donchian Keltner MTF Trend Painter for MetaTrader 5 is a versatile trend indicator that combines Donchian and Keltner channels with a multi-timeframe EMA bias. It delivers a clear, multi-dimensional view of market trends and precise trading signals – ideal for both intraday and swing traders. Key Features: Multi-Timeframe Trend Assessment: Candles are colored according to EMA bias from two timeframes (e.g., H1/H4), instantly showing the dominant ma
FREE

SMC Donchian PD Overlay Signals The SMC Donchian PD Overlay Signals indicator for MetaTrader 5 offers a sophisticated and visually intuitive way to analyze market dynamics. It combines a multi-timeframe Donchian Premium/Discount overlay with a powerful theme engine and de-duplicated signal arrows, providing a comprehensive solution for discretionary traders. Note: This overlay uses external DKTB signals from the “SMC Donchian Trend Breakout” indicator to draw arrow signals. Without that indicat
FREE
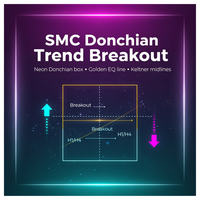
SMC Donchian Trend Breakout The SMC Donchian Trend Breakout indicator for MetaTrader 5 is a powerful tool designed to identify high-probability breakout opportunities. It combines the classic Donchian Channel with a sophisticated set of analytical tools to provide clear and actionable trading signals. Key Features: Advanced Breakout Detection: The indicator uses a 20-day Donchian Channel to identify potential breakouts. It signals a long entry when the price closes above the upper band and a sh
FREE

OrderFlow Pro - Institutional Order Flow Detector Professional Order Flow Analysis for MT5 OrderFlow Pro is an advanced technical indicator designed to detect and analyze institutional order flow in real-time. The indicator provides traders with comprehensive insights into market dynamics by identifying buying and selling pressure, volume imbalances, absorption zones, trapped traders, and delta divergences. KEY FEATURES Order Flow Detection: Real-time buy and sell pressure calculation with perce

SMC Donchian Regime Breakout The SMC Donchian Regime Breakout indicator for MetaTrader 5 is a comprehensive trading tool that combines a powerful set of analytical features to provide clear, actionable signals for breakout and mean-reversion strategies. It's designed to help you identify market regimes, trade with the dominant trend, and manage your risk effectively. Key Features: Multi-faceted Market Analysis: The indicator integrates several powerful analytical tools: Anchored VWAP (AVWAP) wi
FREE

MyFXRoom Supply & Demand Zones Automatically identifies and draws high-probability Supply and Demand zones directly on your chart using a ZigZag-based swing point algorithm. Zones are calculated on a configurable higher timeframe and projected onto any chart timeframe, giving you clean, objective levels without manual analysis. How It Works The indicator scans historical price data for significant swing highs and swing lows using a ZigZag algorithm. Each confirmed swing point becomes a Supply z
FREE

MOVING AVERAGE RIBBON Ritz MA Ribbon Dynamics – The Next-Gen Trend Visualizer Ritz MA Ribbon Dynamics is a futuristic multi-layer Moving Average system engineered to visualize trend momentum, volatility balance, and market rhythm in one adaptive ribbon.
Designed for modern traders who demand clarity, flexibility, and automation — this tool transforms the classic MA visualization into a dynamic analytical framework. Core Concept The indicator creates a multi-tier MA Ribbon that adapts to the cho
FREE

My other indicators https://www.mql5.com/en/market/product/156702 https://www.mql5.com/en/market/product/153968 (FREE) https://www.mql5.com/en/market/product/153960 (FREE) MyFXRoom Equal Highs & Lows – Intelligent S/R Detector
What it does MyFXRoom Equal Highs & Lows automatically detects, validates, and draws Equal Highs and Equal Lows from confirmed 5-bar swing points. It highlights key support and resistance formed by multiple unbroken reactions at the same price area — the zones many tra
FREE

# Spread Watchdog Indicator - Professional Spread Monitoring Solution
## Product Overview The Spread Watchdog Indicator is a professional trading tool designed to monitor and analyze price differentials between two financial instruments in real-time. Perfect for spread traders, arbitrage strategies, and market analysis.
## Key Features
### Real-time Spread Monitoring - Continuously tracks price differences between two selected symbols - Displays current spread values in a separate ind
FREE

VolumeTracker 4X – Candle de Maior Volume e VWAP Descrição principal: O VolumeTracker 4X identifica automaticamente o candle de maior volume do dia no mercado Forex e calcula o preço médio ponderado pelo volume (VWAP) a partir deste candle. Ele desenha canais dinâmicos com base nos preços high e low desde o candle de maior volume até o candle atual , ajudando você a visualizar áreas importantes de suporte e resistência . Criado para traders que desejam decisões mais precisas usando volume real c

SmartCandle 4X – Candles Coloridos por Volume Descrição principal: O SmartCandle 4X pinta automaticamente cada candle de acordo com o volume detectado . Candles de baixo volume começam com tons suaves de azul, evoluindo para branco, amarelo, laranja, vermelho e roxo à medida que o volume aumenta. Isso permite ao trader identificar rapidamente se o mercado está calmo ou agitado , facilitando decisões mais estratégicas no Forex. Principais benefícios: Visualização imediata do nível de atividade do
Selected Range Volume — Buyers and Sellers Balance + Volume Levels Selected Range Volume is an advanced indicator for analyzing volumes and the imbalance between buyers and sellers. It doesn't just show where the volume was—it highlights who exactly dominated: buyers or sellers, and where the market might stop in the future. You select any section of the chart, and the indicator instantly calculates the volume activity within the range, builds a volume profile by prices, and displays the balance
O True Range Normalized Momentum (TRNM) é um oscilador de volatilidade e momentum projetado para identificar mudanças reais de intensidade no movimento do preço , eliminando o ruído causado por oscilações aleatórias do mercado.
Ele combina a variação real do preço ( True Range ) com técnicas de normalização estatística , gerando um sinal claro e responsivo sobre a força e direção do momentum atual . ️ Conceito e Funcionamento O TRNM mede a volatilidade efetiva de um ativo at
FVG Box– The Ultimate Fair Value Gap Indicator for MetaTrader 5
Developed by LiquidWave | Mohd Firuz Fahmi (Moff17) Precision Trading with Automated Fair Value Gaps
FVG Box is the next-generation Fair Value Gap (FVG) detection indicator designed for serious traders who rely on smart money concepts and institutional imbalance zones . With ultra-smooth performance and real-time updates, it automatically scans your chart to highlight potential liquidity gaps and trading opportunities wi

MA MTF Fijo: Smooth Curves, Clean Charts
Eliminates the visual "steps" of multi-timeframe moving averages.
Fixed MA MTF: It offers a smooth and professional line of any higher timeframe directly on your current chart.
Key Points:
No Steps: Real and smooth curve between candles (Goodbye to rough straight lines). High Performance: Optimized code; does not slow down your MetaTrader 5. Maximum Versatility: Supports all 21 timeframes and all methods (SMA, EMA, SMMA, LWMA). Multi-Market: Ideal fo

Big bull scalper Short Description Master market structure with the precision of the popular Big bull scalper This tool automatically identifies key pivot highs and lows, plotting unique "angling" trend lines that dynamically define market context. It visually confirms Breaks of Structure (BOS) and Changes of Character (CHoCH), removing all guesswork from your analysis.
Key Features: Automatic Pivot Detection Instantly spots significant swing highs and lows. Dynamic Angling Lines Visual
FREE

The "MA Gaussiano" indicator is a custom tool for MetaTrader 5 (MQL5) that combines a Gaussian Moving Average with colored trend candles, designed to identify market trends in a visual and innovative way. It was developed with xAI assistance in 2025 and focuses on providing a smooth and sensitive representation of prices, ideal for traders looking to filter noise in charts of currencies, stocks, or cryptocurrencies. Main Components: Gaussian MA (Colored Line): Plots a line representing the Gauss
FREE
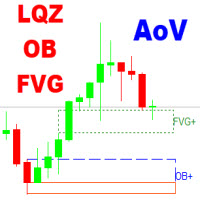
The Area of Value Detection indicator automatically identifies and highlights key institutional price zones, including Liquidity areas, Order Blocks, and Fair Value Gaps (FVG). It is designed to help traders visualize market imbalances and potential points of interest (POIs) used by smart money participants.
Main Features Liquidity Zones: Detects clusters of equal highs/lows and liquidity pools where stop orders are likely accumulated.
Order Blocks: Highlights potential bullish and bearish or

LiquidX Pro - Precision Reversal Engine "Professional multi-confluence reversal detector that identifies high-probability tops and bottoms using institutional liquidity sweeps, volume exhaustion, and momentum divergence" Overview LiquidX Pro - Precision Reversal Engine is a sophisticated, professional-grade indicator designed for serious traders who want to catch high-probability market reversals with institutional precision. Stop chasing breakouts that fail—start trading reversals that pay. Thi

The Current Price Line indicator displays the current price as a real-time horizontal line on the chart. Features of the Current Price Line Unlike standard buy/sell lines, it is unaffected by spreads, enabling precise price identification. It instantly identifies reactive price zones (such as resistance/support lines), facilitating high-precision entries. It delivers high performance for scalping and day trading. Simultaneous display of lines across multiple timeframes supports multi-timeframe a

Instantly identify key price action signals with an intuitive visualization indicator:
Pin Bar: The Rejection Candle. Green for a bullish close, red for a bearish close. Defined by a long wick and a small body, signaling a strong price rejection.
Inside Bar: The Consolidation Candle. Highlighted in blue, this pattern occurs when a candle trades entirely within the range of the previous one. It represents a period of market indecision and compression.
Fakey Bar: The Failed Breakout
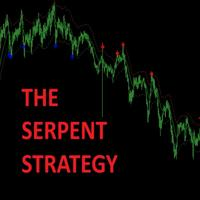
Trade Like a Serpent — Calm, Precise, Lethal. The Serpent Strategy equips you with a visual edge — clarity in confusion, precision in volatility, and confidence in timing.
Let your trades strike like a serpent — swift, silent, and accurate. Overview The Serpent Strategy is a powerful custom-built MetaTrader 5 indicator designed to identify high-probability trade zones using a unique combination of market volatility, trend direction, and momentum confirmation.
It visualizes price action in th

ICT Unicorn Hunter – Multi-Timeframe Smart Setup Detector IMPORTANT: This is a Multi-Timeframe Scanner, looking for 'Unicorn' setups. A Unicorn in this definition is a liquidity sweep, market structure shift and creation of a Fair Value Gap overlapping with the last opposite-close candle before the liquidity sweep (breaker). This scanner does NOT provide visualisation of the Unicorn on the chart.
For visualisation, use the Unicorn Tracker indicator, which is designed to work with the Unicorn
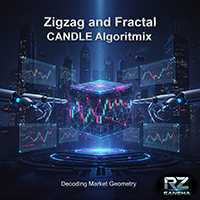
ZIGZAG and FRACTAL CANDLE PRO ( Only candles, No RSI strength panel) " Suitable for QQE RITZ " > Check My Product is an advanced market structure visualization system built for precision trend detection, powered by dynamic fractal logic and adaptive swing validation.
It seamlessly identifies Higher Highs (HH), Lower Lows (LL), and key structural shifts — allowing traders to read the true rhythm of market transitions with institutional clarity. This system combines ZigZag precision , fractal
FREE
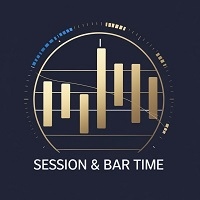
The Sessions and Bar Time indicator is a professional utility tool designed to enhance your trading awareness and timing precision on any chart. It combines two key features every trader needs — market session visualization and real-time bar countdown — in one clean, efficient display. Key Features: Candle Countdown Timer – Shows the remaining time before the current candle closes, helping you anticipate new bar formations. Market Session Display – Automatically highlights the four main trading
FREE

Moving Average Sentiment "Transform Raw Market Data into Clear Sentiment Vision" Moving Average Sentiment is a next-generation adaptive trend sentiment indicator that visualizes the true bias of the market — bullish, bearish, or neutral — in real time. It combines Moving Average dynamics with ATR-based volatility zones , creating a fluid, self-adjusting sentiment curve that reacts instantly to price structure and volatility shifts. This tool goes beyond a simple MA — it reads the behavior of th
FREE

TickVelocity with Smart Alert : Real-Time Buyer vs Seller Speed Dominance **️ Discover the raw energy of the market with the TickVelocity with Smart Alert indicator. Go beyond standard volume and price action to measure the speed and momentum of price changes, revealing the true underlying dominance of buyers or sellers in real-time. This essential tool provides a clear, separate-window view of market dynamics and features a sophisticated Smart Alert System to catch explosive moves early!
FREE

AMSV Zones - Adaptive Market Structure + Volatility Zones
Stop trading blind support/resistance levels. Start trading zones that adapt to real market conditions.
AMSV Zones combines multi-timeframe market structure analysis with volatility-adaptive zones to identify high-probability trading opportunities. Unlike traditional indicators using fixed levels, AMSV automatically adjusts zone widths based on current ATR, ensuring relevance during both calm and volatile periods.
KEY FEATURES
1. Mu
FREE

Ratio X Trend Watcher – Advanced Trendline Breakout Indicator Learn More about Ratio X Systems:
Source code and compiled EA: Reasons why the .mq5 file changes everything. Integrated MQL5 message filters: How to protect professional operating systems without DLLs? How can you build your own expert advisor (EA) brand using white-label trading software? MQL5 programming methods with ChatGPT and Claude Code (no development knowledge required) You will have unlimited access to all source code (.mq5)
FREE
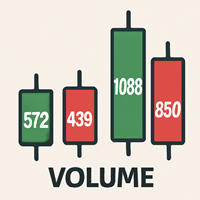
Volume Data on Candles Indicator for MetaTrader 5 Maximize your trading insights with the Volume Data on Candles indicator for MetaTrader 5. This powerful tool provides real-time volume data directly on each candle, allowing you to identify significant shifts in market activity. When the volume of a candle exceeds the average of the last 50 candles, it will be clearly highlighted , ensuring you don't miss out on potential high-volume movements. Key Features: Real-Time Volume Data : Displays volu
FREE

M ulti-timeframe indicator that overlays higher timeframe candlesticks directly onto your current chart. It helps traders visualize broader market structure and momentum without switching between different timeframes. The indicator also plots the latest open price from the selected higher timeframe, giving clear insight into key reference levels. Users can customize the visual appearance through the settings — adjusting candle colors, line styles,to fit their trading layout and preferences.
FREE

Z-Corr — это инструмент, разработанный для анализа корреляции между двумя валютными парами. Индикатор в реальном времени отображает отклонения в движении инструментов, помогая трейдеру определить моменты, когда валютные пары начинают расходиться, и своевременно открыть позицию для получения прибыли на их последующем схождении. Основные возможности: Отображает два инструмента и сравнивает их движение. Линии и гистограммы показывают текущую динамику отклонения пар. Жёлтая гистограмма сигнализирует

MARKET SENTIENCE PRO - INSTITUTIONAL GRADE MARKET INTELLIGENCE INDICATOR Copyright 2025, Amuyunzu OVERVIEW Market Sentience Pro is a comprehensive, institutional-grade trading indicator designed to decode market behavior by combining smart money concepts, market structure analysis, liquidity zone detection, and trend confirmation into a unified system. This all-in-one solution helps traders anticipate market movements before they occur by displaying a clear, layered view of institutional footpri
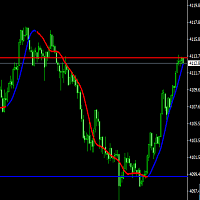
This is a professional trader's breakthrough system indicator that can be used for trading in various categories. Using the Hull moving average to create trend charts and provide price pressure and support positions, it provides traders with trading references for each cycle. Welcome to use it, if you have any questions, please contact us. The last 50 candlesticks for price pressure and support settings can be reset according to your needs

Here our more valuable tools
SMC Trend Trading , Easy SMC Trading , Institutional SMC Architect Volume Analysis Tools , Volume flow Profile , Market volume profile , FVG with Volume , Liquidity Heatmap Profile , Volume Spread Analysis Purpose : Measures market pressure by analyzing tick movements, volume, and speed within a time window. How it works : Calculates weighted price changes, considers tick velocity and volatility, and applies EMA smoothing. Trading use : Strong po

Swing and Liquidity Sweep Finder is a powerful tool designed to automatically detect swing points and liquidity sweeps on your chart.
It helps traders identify where the market is likely to grab liquidity before reversing, showing both internal and external liquidity zones with high accuracy.
This indicator is ideal for ICT and Smart Money Concept traders who rely on swing structure and liquidity manipulation for their entries and exits.
Our Team Services: If you are want to see our products cl

Composite MA Indicator - Comprehensive Guide Description:
The Composite MA indicator is a sophisticated multi-timeframe trend analysis tool that calculates the average value of multiple moving averages across a user-defined period range. It provides comprehensive market trend visualization through both a color-coded composite moving average line on the chart and an Excel-style panel displaying trend direction across 21 different timeframes. The indicator uses canvas technology for smooth GUI r
Advanced ZigZag Histogram with Divergence Detection and Order Flow Simulation ZigDeltaSwingPro is a comprehensive technical analysis indicator for MetaTrader 5, built on the classic ZigZag algorithm and enhanced with modern features such as divergence detection, dynamic histogram visualization, swing pattern recognition, and simulated order flow insights. Designed for scalpers and swing traders alike, it leverages MT5’s internal tick volume to deliver actionable signals—no external data feeds r
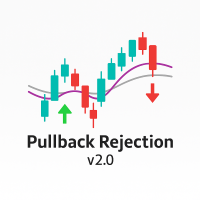
Overview Pullback Rejection v2.0 is a professional-grade visual indicator that spots continuation setups after pullbacks using Heiken Ashi logic and multi-EMA trend bias.
It is designed for scalpers and intraday traders who want clean, rule-based BUY and SELL signals aligned with trend direction only — no repainting, no noise, no counter-trend traps. Trading Concept The indicator combines EMA 7, EMA 50, and EMA 200 to define directional bias: Bias Condition Trades Allowed Bullish EMA7 > EMA200

Object Synchronizer: Seamless Chart Object Duplication & Management Tired of drawing the same trendline or Fibonacci retracement on multiple charts for the same symbol? Wish your analysis on one timeframe would instantly appear on another? Introducing Object Synchronizer , the ultimate utility indicator for MQL5 that bridges the gap between your charts. Designed for professional traders and analysts using multiple charts of the same symbol, this powerful tool automatically duplicates and manages
The Hammer and Doji Scanner is a powerful technical analysis tool designed for MetaTrader platforms, such as MetaTrader 4 (MT4) and MetaTrader 5 (MT5), to detect and highlight key candlestick patterns, specifically the Hammer and Doji . These patterns are widely used by traders to identify potential trend reversals or periods of indecision in the market. Hammer: The Hammer is a bullish reversal candlestick pattern that appears after a downtrend. It is characterized by a small body near the top o
FREE
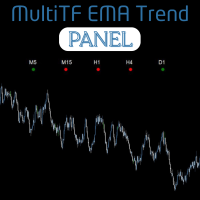
The MultiTF EMA Trend Panel is a clean, lightweight, and visually intuitive indicator designed to help traders quickly assess trend direction across multiple timeframes — all in one glance. It compares the relationship between two exponential moving averages (EMAs), typically the 50 EMA vs 200 EMA , across popular timeframes such as M5, M15, H1, H4, and D1 . You can customize the EMA settings and colors to match your own strategy or visual preferences. Key Features Multi-timeframe trend comparis
FREE

The Trend Wave indicator for MetaTrader 5 ( MT5 ) is a reliable tool designed to help traders effectively identify market trends and potential reversals . By utilizing oscillating wave patterns, this indicator provides clear visual signals, enabling traders to capitalize on price movements . Whether you are a day trader or a swing trader , this indicator is a versatile addition to your trading toolkit, simplifying complex market analysis.
Saiba como comprar um robô de negociação na AppStore do MetaTrader, a loja de aplicativos para a plataforma MetaTrader.
O Sistema de Pagamento MQL5.community permite transações através WebMoney, PayPay, ePayments e sistemas de pagamento populares. Nós recomendamos que você teste o robô de negociação antes de comprá-lo para uma melhor experiência como cliente.

Você está perdendo oportunidades de negociação:
- Aplicativos de negociação gratuitos
- 8 000+ sinais para cópia
- Notícias econômicas para análise dos mercados financeiros
Registro
Login
Você concorda com a política do site e com os termos de uso
Se você não tem uma conta, por favor registre-se