 MetaTrader 5
 专家
 指标
 程序库
 实用工具
 窗口小部件
 规则
适用于MetaTrader 5的免费技术指标 - 74
 技术指标的信号外汇和股票市场的开仓交易和平仓交易起着至关重要的作用。指标的本质就是一种交易品种的数学转换,旨在预测未来的价格变化。
测试技术指标可以更有利于预测市场行为并从中获利。

Product name Rilvanta RSI PrimeSuite
Short headline A pure RSI professional suite for overbought/oversold context, regular and hidden divergence, failure swings, RSI structure and multi-timeframe RSI alignment.
Overview Rilvanta RSI PrimeSuite is a pure RSI analysis indicator designed for traders who want a complete RSI-based view without mixing in unrelated trend, volume, VWAP, ATR, Bollinger, SMC, ICT or moving-average filters. The indicator focuses on the core tools that make RSI useful: o
FREE

Привет. Сегодня представляем индикатор корреляции - SynchroWindowTomson. Индикатор в одном окне показывает движение нескольких инструментов, по отношению друг к другу, удобно определять направление и изменение, особенно когда вы работаете с целым портфелем разных инструментов и нужно определить какой из них тянет результат назад и движется в другую сторону. Так же видны точки разворота спреда.
FREE

If you like this product, please give it a 5 star rating as a token of appreciation.
This indicator plots horizontal lines on the chart representing the previous year’s high and low prices . These levels are widely used in technical analysis as major support/resistance references.
Automatically identifies the previous calendar year’s high and low . Plots horizontal lines on the chart at these levels. Customizable color, width, and style of the lines. Deletes lines on deinitialization. Updates
FREE
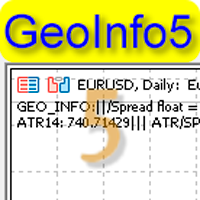
GeoInfo5 是信息量最大的指标之一,它以简洁的形式显示交易工具的基本信息。 Meta Trader4终端的版本在交易者中广受欢迎。 该指标是免费的,将永远是免费的。 推出版本现在也可用于MetaTrader5。
在图表左上角的行中以简短的形式显示有关工具主要参数的信息: 价差,交换买入订单,交换卖出订单,当前价差,抵押品(保证金),蜱虫大小,停止水平,订单冻结水平。 信息显示基于一个手和点。
信息以如下形式输出: Spread ... = 23 pips /SWAP B:4.200 /S:-8.470 /MRG:256.0/TCV:0.10/STL:0/FRL /MinLot:0.1
已经介绍了关于周期的平均范围和周期/点差的比率范围的信息的显示,这允许您选择在这些市场条件下最有效操作的最佳时间框架。 数据以格式呈现: ATR14:906.786///ATR/SPR:3.956 如果 ATR/SPR 比率较小,则选择更高的时间框架以实现更高效的操作可能是有意义的。 对于紧急工具(期货),到期日以以下格式显示: Exp Date:2022.02.18 参数: ShowSym
FREE

Quickview The Quickview indicator instantly highlights asset variations, delivering crystal-clear market insights at a glance. Effortlessly track multiple assets with visual simplicity, enabling quicker, smarter, and more confident trading decisions daily. ️ Key Features Real-Time Asset Tracking: Instantly monitor multiple assets simultaneously, never missing a critical market move. Flexible and Intuitive Display: Personalize your view, displaying assets exactly as you want—clear, concise, c
FREE

TS Time Remaining - Indicador de Cuenta Regresiva para Velas en MetaTrader 5 El TS Time Remaining es un indicador gratuito diseñado para la plataforma MetaTrader 5 que permite a los traders visualizar en tiempo real el tiempo restante de la vela actual. Esta herramienta es especialmente útil para aquellos operadores que trabajan con estrategias basadas en la acción del precio y patrones de velas japonesas, ya que les permite anticiparse al cierre de la vela y tomar decisiones con mayor precisión
FREE

On Off Trade On Off Trade — это индикатор для MetaTrader 5, который выводит прямо на график статус рынка и расписание торговых сессий. Возможности: Показывает, открыт ли рынок сейчас ( СТАТУС: РЫНОК ОТКРЫТ / ЗАКРЫТ ). Отображает активную торговую сессию: время начала и окончания. Если рынок закрыт — указывает, когда начнётся следующая сессия. По желанию можно включить полное расписание всех сессий на неделю с подсветкой текущего дня и активной сессии. Автоматическое обновление данных кажды
FREE

Aureon StrataCore SMC
Overview Aureon StrataCore SMC is a MetaTrader 5 chart-context indicator designed to organize Smart Money Concepts into a clean visual framework. It displays swing structure, BOS/CHOCH events, liquidity zones, order block zones, premium/discount range context and optional closed-bar entry arrows. The indicator is a decision-support tool and does not trade automatically.
Key Features - Closed-bar swing high and swing low detection using configurable pivot depth. - Bullish
FREE

Display the date, time and price according to the movement of the mouse cursor on the chart This is useful for discretionary trading.
It is an indispensable tool for verifying and studying past market prices and trades. Characteristic Date,Time and Price are displayed.
The value follows the movement of the mouse.
You can change the color of the text. Please refer to the video on youtube. For MT5 only.
FREE

HighVolume SR Boxes is a professional support and resistance zone indicator designed to identify important price areas using confirmed pivot structure and volume-based filtering. Instead of drawing simple horizontal lines, the indicator highlights market zones as dynamic boxes, helping traders see where price has previously reacted with meaningful volume participation. These zones can be used to observe potential reversals, breakouts, retests, and role-reversal behavior between support and resis
FREE

海龟指标带警报功能。交易突破。不错过任何一个信号。 市场不等人。一旦价格突破进入新的区域,你必须知道,必须行动。这个指标专为关注价格本身、而非他人观点的交易者而设计。 无论你遵循经典的海龟交易系统规则,还是任何其他基于突破的方法,该指标都会将关键水平直接绘制在你的图表上,并在市场发出信号的那一刻立即提醒你。没有猜测。没有长时间盯盘。只有在关键时刻出现的、基于规则的清晰信号。 专为希望保持纪律的系统化交易者而设计 突破交易者最大的敌人不是糟糕的市场,而是情绪。因为分心而错过入场。因为"感觉"价格会回来而死守亏损的交易。因为回撤让你紧张而过早离场。 这个指标消除了所有这些问题。它精确地告诉你何时入场,以及市场何时表明这笔交易已经结束。规则始终如一。 当价格创出新高或新低时发出清晰的入场信号——这是每个海龟风格系统的核心。基于较短跟踪通道的出场信号,让你顺势而为,在趋势结束时离场,而不是提前离场。电脑弹窗和推送通知。即使你不在电脑前,信号出现的那一刻也会推送到你的手机。通道线始终显示在图表上。在下一个信号出现之前,你就能看到它可能从哪里到来。 基于规则的系统纪律,实时呈现 大多数突破交易者都
FREE

IDNR4 — Indicator Description (English)
The IDNR4 (Inside Day Narrow Range 4) is a volatility-compression pattern that identifies potential breakout conditions. It combines two concepts: NR4 (Narrow Range 4)
The current bar has the smallest high–low range compared to the previous three bars. Inside Bar (ID)
The current bar’s high and low are fully contained within the range of the previous bar. Signal Logic
• When the bar is NR4 only , it is highlighted as a normal contraction pattern.
• Wh
FREE

ICT Projection answers one question: "the last times the chart looked like this, where did price go next?" It searches the history of your chart for bars with the same ICT snapshot as now and draws the path price took after them, in ATR units, as a shaded area to the right of the last candle. It is a statistics tool: it shows what usually happened and how often, and it says so plainly when there is no edge.
What it measures - The ICT snapshot of every bar, from 14 features: market structure, r
FREE

停止猜测,开始精准交易。
QTS Super Hybrid Platinum 不仅仅是一个指标,它更是一套完整的交易系统,专为追求精准和安全的短线交易者和日内交易者而设计。该工具结合了机构价格行为 (SNR) 和趋势动量 (三重 EMA) 的强大功能,过滤掉市场噪音,只为您提供高概率的交易机会。
为什么选择 QTS Super Hybrid Platinum?我们开发这款工具旨在解决交易者面临的三大难题:虚假信号、过度交易和错失良机。
白金版功能:
自动趋势和 SNR 逻辑:自动识别“大玩家”趋势(高时间框架偏好),并为您绘制关键支撑/阻力位。
移动推送通知:再也不会错过任何交易机会!当出现有效信号时,您的手机将立即收到提醒(“叮!”)。随时随地,轻松交易。
幽灵目标系统(自动止盈/止损):不知道在哪里退出?该指标会根据波动率(ATR)自动绘制“幽灵线”来设置止盈和止损点。
️ 智能过滤器(防陷阱):
RSI 过滤器:防止在顶部买入或在底部卖出。
波动率计:在市场横盘整理或剧烈波动时发出警告。
K 线计时器:使用精准的倒计时器避免假
FREE

The problem most traders face: To know which candles carry abnormal volume, you have to check the volume panel bar-by-bar, draw a mental vertical line up to the corresponding candle, and match the two together. It works, but it takes extra steps every time — and on a busy chart, it's easy to lose track of which candle you were even checking. What VSA Candle Color does: This indicator paints candles directly on your MT5 chart the moment Ultra High or Very High volume is detected. The color sits
FREE

Aurexon DriftWave EMA
MetaTrader 5 Custom Indicator Overview
Aurexon DriftWave EMA is an EMA-based chart context indicator for MetaTrader 5. It is designed to give traders a clear visual overview of trend direction, impulse behavior, and volatility boundaries directly on the price chart. Instead of relying only on arrow signals, the indicator displays EMA lines, EMA cloud, ATR volatility rails, and optional closed-bar Buy/Sell confirmation arrows. Key Features Fast EMA impulse line Slow EMA t
FREE

Nebryx BandPulse Matrix Professional Bollinger Bands Volatility Context Indicator for MetaTrader 5
PRODUCT OVERVIEW Nebryx BandPulse Matrix is a clean volatility-context indicator built around Bollinger Bands. It is designed for traders who want more than a standard band overlay. The indicator combines classic Bollinger Bands with volatility squeeze detection, expansion confirmation, band-walk trend context, stretch/overextension markers, and a compact chart status label.
The product focuses
FREE

NovaTac Fixed Volume Profile displays configurable volume-at-price profiles with POC, value area, nodes and closed-bar context alerts.
Overview
NovaTac Precision Volume Profile is an analytical chart indicator for MetaTrader 5. It organizes available volume across price rows and displays the areas where trading activity was concentrated within a selected range.
The indicator does not open, modify or close trades. It is intended to support chart analysis and discretionary decision-making.
Pr
FREE

Fx Gamma Profile - see where the options market is positioned, directly on your MetaTrader 5 chart. Fx Gamma Profile turns an options-chain file into a gamma-exposure (GEX) map and draws it beside price: a bar for every strike, the call wall, the put wall and the zero-gamma level, plus a status panel that explains in plain words what the numbers imply. It is a decision-support tool for discretionary traders who want options-market context for FX pairs. READ BEFORE YOU BUY - THIS INDICATOR NEE
FREE

Trading Opportunity Scanner 不再需要逐个翻看几十张图表。Trading Opportunity Scanner 同时监控外汇货币对、指数、黄金、白银、原油和加密货币,并在一个屏幕上告诉您:哪些市场此刻正处于支撑或阻力区域,以及背后的动能有多强。 本工具专为使用 支撑与阻力(SNR)结合多时间周期市场结构 的交易者设计,适用于波段、日内以及剥头皮交易。 显示内容 1. 货币强弱与资金流 8 种主要货币以及黄金、白银在 M15、H1、H4、D1 上的强弱。 每种货币附一句简短解读,例如“强势但开始转弱”或“弱势但开始转强”。 2. FX Flow(28 个货币对 + 黄金和白银) 每个货币对的市场结构(D1 / H4 / H1)。 小周期与大周期的动能:推动、维持、疲软或无力。 日波幅已用比例(ADR %)、潜力评分(POT)、解读以及备选情景。 3. Multi Asset Flow(多资产) 指数(US30、NAS100、SPX500、GER40、FRA40、EU50、UK100、JP225)、黄金、白银、原油(USOIL、UKOIL)和加密货币(BTCUS
FREE

Gold Sniper SMC v4.0 — Institutional Market Structure & Precision Entries
PREMIUM LAUNCH OFFER: GET IT TODAY FOR ONLY 50 USD! (Limited Slots Remaining) INSTITUTIONAL-GRADE SYSTEM: ZERO-REPAINT SIGNALS BACKED BY REAL MARKET STRUCTURE!
Welcome to the future of institutional trading on MetaTrader 5. Gold Sniper SMC v4.0 is an all-in-one elite trading system engineered to track smart money footprints (SMC/ICT) and execute precision entries with pinpoint accuracy. Say goodbye to laggin
FREE

TTB ABC Trend Structure is a clean, practical price-action indicator designed to help traders spot trend alignment, market structure swings, and high-probability entry points without chart clutter.
MAIN FEATURES: 1. ATR TREND LINE: - A single, smooth dynamic trendline that filters macro market direction. - Sky Blue line = Bullish trend. - Crimson Red line = Bearish trend. - Keeps your chart clean and free of noisy indicators.
2. POINT C SIGNAL ARROWS & TRIGGER STRIPE: - Clear si
FREE

Nested Candles 在您图表的K线周围绘制更大周期的K线。每根 H4、D1 或 W1 K线都按真实的开盘价、最高价、最低价和收盘价绘制,并准确框住构成它的小周期K线。无需切换周期,即可在同一张图表上同时看到大格局和细节。适用于任何品种:外汇货币对、金属、指数和加密货币。
如果您觉得有用,请在“评论”标签中留下星级评分和简短评论。这能帮助我继续改进这个工具。谢谢。
工作原理
将指标添加到任意图表,一个小面板会列出比您当前图表更大的周期(从 M5、M15、H1、H4、D1、W1 和 MN 中),以及您在输入参数中添加的任何额外周期。每个周期都可以一键开启或关闭。仍在形成中的K线以虚线轮廓绘制,并随每个报价实时更新。
透明度随缩放变化。缩小图表时,更大周期变得更明显并成为主角;放大时,它们会淡出,让图表本身的K线保持清晰。如果您更喜欢固定数值,可以关闭自动透明度,使用每个周期的强度滑块。
样式与工具
提供三种样式:极简(细轮廓加柔和填充,默认)、方框和幽灵。每个周期可以选择填充或仅轮廓,边框颜色可选自动、灰色或自定义。面板还提供: 信息卡:将鼠标指向大周期K线,即可查
FREE

Pivot Points Six Types with Level Alerts 是一款适用于 MetaTrader 5、与 TV 兼容的枢轴点指标。它使用与 TradingView 自带的 "Pivot Points Standard" 指标相同的公式和相同的周期划分,并以相同的方式绘制水平线:从每个周期第一根K线开始的短水平线,带有橙色(#FB8C00)的 "R1 (价格)" 样式标签。
六种计算类型 各水平由前一周期的最高价、最低价和收盘价计算。 - Traditional:P、R1–R5、S1–S5 - Fibonacci:P、R1–R3、S1–S3(前一周期波幅的 0.382 / 0.618 / 1.000) - Woodie:P、R1–R4、S1–S4(与 TradingView 一样,使用当前周期的开盘价) - Classic:P、R1–R4、S1–S4 - DM (DeMark):P、R1、S1(同时使用前一周期的开盘价) - Camarilla:P、R1–R5、S1–S5(R5 = high / low x close) 水平数量较少的类型,其余水平只是留空。
FREE

Gold Command Dashboard puts the context you need before you click Buy or Sell into one compact panel on your XAUUSD chart. It does not draw arrows, does not generate signals and does not trade. It tells you what kind of market you are in , so your own strategy can make better decisions. Free, no time limit. What the panel shows SESSION - active session (Tokyo / London / New York, overlaps shown as "LONDON + NEW YORK"), countdown to the close and to the next session. RANGE - today's range as a %
FREE

CLOUDPips Kaze answers one question before you trade: is the market really moving right now, or is it just quiet? Ever seen price break out, only to snap back minutes later? Many false breakouts happen when the market is quiet. Kaze makes that quiet visible.
How it works Kaze combines each candle's tick volume and its range (high − low). It compares them with what is normal for the same hour of the day over the last 20 days (adjustable). 1.0 = normal for that hour. The Asian session is always
FREE

MNFM Spread History records your broker’s bid–ask spread for the chart symbol, in points. It is a read-only indicator.
The dashboard shows broker and local clocks, the current recording hour, the most recent completed recorded hour, and a chart of up to 60 recent readings with the current spread in points and a right-side scale. Number of Readings counts valid samples. Middle Spread is the median. 95% Equal or Below is the spread level at or below which at least 95% of readings fall. Highest Sp
FREE

MNFM Session Activity shows the indicative trading hours of the Sydney, Tokyo, London, and New York forex sessions. The timeline marks each opening and closing, highlights active sessions, and shows the current time in your computer’s local time zone by default. The Hourly Price Movement chart compares today’s completed hourly high–low ranges with the average for the same hours across up to 14 historical trading days. Values are in points for the chart symbol and depend on the broker’s available
FREE
MetaTrader 市场 - 在您的交易程序端可以直接使用为交易者提供的自动交易和技术指标。
MQL5.community 支付系统 提供给MQL5.com 网站所有已注册用户用于MetaTrade服务方面的事务。您可以使用WebMoney,PayPal 或银行卡进行存取款。
