English Русский Español Português
preview
MQL5中的价格时间缺口分析(第二部分):构建时间维度下的流动性分布热力图

MQL5中的价格时间缺口分析(第二部分):构建时间维度下的流动性分布热力图

MetaTrader 5指标 |
22 4
Yevgeniy Koshtenko
Yevgeniy Koshtenko

前一篇文章中,我们讲解了时间缺口的概念,以及其与机构交易活动的关联。然而,检测缺口仅仅完成了一半工作。想要高效交易,交易者必须掌握完整的市场全貌:价格长期停留和短暂停留的区间,以及这些区域之间如何相互作用。

而我们的指标正好解决了这一问题 —— 一款将隐形的时间价格规律转化为直观的热力图的工具。前一篇文章聚焦于挖掘市场异常形态(缺口),本文则致力于构建完整的常态价格行为图。

其基本原理很简单:将整体价格区间划分为若干微观区间,统计价格在每个区间的停留时长。价格停留时间越久,区间“热度”越高,对应的市场重要性也越强。采用从红色到蓝色、由低热度到高热度的配色方案。


数学基础:从无序行情到有序规律

任何市场行情,本质都是供需双方的持续博弈。博弈最激烈的价格区间,往往是价格停留最久的位置。这一规律可通过时间密度函数量化表达:

T(p) = Σt_i(价格处于区间[p-δ, p+δ]内的总时长)

其中p为待分析价格点位,δ为分析区间宽度,tᵢ为价格在该区间内每一段的停留时长。

原始的绝对时长数据参考价值有限,我们需要进行归一化处理,将绝对时长换算为相对占比,计算公式如下:

P(p) = ((T(p) - T_min) / (T_max - T_min)) × 99% + 1%

该公式可实现数值标准化:将市场热度最低的区间赋值为1%,而将热度最高的区间赋值为100%,其余所有区间的热度数值,均根据自身市场重要性,按比例分布在1%至100%区间内。


方案架构:模块化设计以保障稳定性

构建指标需要一套严谨完善的程序架构。架构核心为PriceLevel结构体,该结构体封装了单个价格点位的全部核心信息。

struct PriceLevel
{
    double      price;             // Central price level
    double      price_high;        // Zone upper boundary
    double      price_low;         // Zone lower boundary
    long        time_spent;        // Accumulated time in bars
    double      presence_percent;  // Presence percentage
    color       level_color;       // Dynamic color
    string      object_name;       // Unique ID
};

每个价格点位都具备独立的动态属性:累计停留时间、重新计算占比、动态切换颜色。它不再是单纯的数据结构,而是市场生命力的具体体现。

本次设计的核心创新在于引入滑动分析窗口。系统不再遍历全部历史数据(该方式耗时可达数秒),而是仅通过尺寸为AnalysisPeriod的窗口,分析最新的MaxHistory根K线。此举既保证分析结果具备时效性,又确保程序运行性能稳定可控。


算法:数学原理落地实战

算法首先自动测算当前分析区间的价格极值,自动识别统计周期内的最高价与最低价,可自适应任意交易品种的波动率变化。

将整体价格区间均匀切分为若干微观价格带。价格带数量为动态计算:如果设置了最小价格变动单位(tick size),则以此为分割标准;如果没设置,则采用该交易品种的最小报价点位(Point)。同时,系统做了性能平衡约束:精度下限至少50个价格层级,性能上限不超过1000个价格层级。

整个流程中,统计各价格层级的停留时长是最消耗算力的环节。朴素算法需要逐根K线、逐一层级遍历比对,时间复杂度高达O(n²)。本次优化后复杂度降至O(n×k),其中k为单根K线实际覆盖的平均价格层级数量。

// Optimization: find only relevant levels for each bar
int startLevel = MathMax(0, (int)((lowPrice - minPrice) / realTickSize));
int endLevel = MathMin(totalPriceLevels - 1, (int)((highPrice - minPrice) / realTickSize) + 1);

for(int levelIdx = startLevel; levelIdx <= endLevel; levelIdx++)
{
    if(DoesBarTouchLevel(highPrice, lowPrice, levels[levelIdx]))
    {
        levels[levelIdx].time_spent++;
    }
}

DoesBarTouchLevel函数用于检测单根K线的高低价区间,是否与价格层级边界产生交集。其判定逻辑简洁清晰:如果K线最高价高于当前价格层级的下边界,且K线最低价低于该层级的上边界,即可判定二者存在区间重叠。


色彩转化机制:数值的可视化渲染

完成统计时长的计算后,进入核心可视化环节:将原始数值数据转化为梯度色彩方案。本方案采用五阶色彩梯度体系:红色(1%)、橙色(25%)、黄色(50%)、浅蓝(75%)、深蓝(100%)。

系统会在各关键色值节点之间进行平滑插值处理。例如,停留占比37%的价格层级,会渲染为橙色与黄色之间的过渡色。色彩插值运算在RGB空间中完成。

color InterpolateColor(color color1, color color2, double factor)
{
    // Decomposition into RGB components
    int r1 = (color1 >> 16) & 0xFF;
    int g1 = (color1 >> 8) & 0xFF;
    int b1 = color1 & 0xFF;
    
    // Linear interpolation of each channel
    int r = (int)(r1 + (r2 - r1) * factor);
    int g = (int)(g1 + (g2 - g1) * factor);
    int b = (int)(b1 + (b2 - b1) * factor);
    
    return (r << 16) | (g << 8) | b;
}

最终实现平滑的色彩过渡,从而生成贴合市场真实状态的自然热力图。


可视化:从算法到图表

每个价格层级在图表上以矩形区域呈现。创建数千个图形对象在技术实现上具有一定的挑战性,必须进行专项优化。

矩形覆盖范围从分析起始时间一直延伸至当前K线,完整覆盖所关注的区域。将所有图形对象均设置为背景层显示:不干扰常规图表分析、点击不高亮、缩放时自动重绘。

对象管理系统内置清理机制,在渲染新结果前会清除旧有图形,以此避免图表产生冗余的“垃圾对象”,保证可视化的正确更新。

在实时运行场景下,性能至关重要。该指标采用三级优化方案:

  • 第一级为惰性计算,仅在新K线形成时才重新计算。系统记录上一次的更新时间,仅当数据发生变化时才启动运算。
  • 第二级为内存优化,一次性申请数据数组且可重复复用。数据结构按最小内存占用设计:计数器使用长整型而非浮点型,避免多余字符串变量。
  • 第三级为算法优化,滑动分析窗口限制处理数据总量。自适应价格网格避免创建过多价格分区。


结果解读:色彩含义

红色区域(占比1%至25%)代表价格快速掠过的区域,即前一篇中提到的时间缺口潜在区域。这类区域常出现快速反弹与虚假突破行情,需谨慎交易。

橙色与黄色区域(占比25%至75%)代表中等活跃度区域。此处价格会阶段性停留,但无明显多空主导。该区域属于过渡区间,可根据市场环境演变为支撑或阻力,这些区域也往往是趋势跟随交易最容易发挥效果的位置。

蓝色与浅蓝色区域(占比75%至100%)是核心分析重点。价格在此停留时间最长,代表极高的交易活跃度。此类价位具有强烈的“磁力效应”:价格会反复回归,常把这些区域作为推动行情的支撑,或作为需要突破的阻力屏障。

最有效的策略是在蓝色区域做反弹交易。价格进入最高停留区间时,反转概率显著高于平均水平,在震荡市场中效果尤佳,可清晰界定通道边界。

价格突破黄色区域往往预示趋势延续。如果价格伴随放量轻松穿过中等停留区,说明前方无强阻力。

红色区域内的反转结构通常效率最高。

结合成交量分析可大幅提升信号质量,当蓝色时间区域与成交量峰值重合时,即形成最高重要性关键区。


针对不同市场的定制化:通过适应性实现灵活性

伴随高流动性的外汇市场需要较大的参数:AnalysisPeriod(300至500根K线)和MaxHistory(5000至8000根K线)。这里的价格波动更平滑,因此需要更深的分析深度,才能识别出真正重要的区域。

对于股票市场,中等参数的效果最优:AnalysisPeriod(200至300根K线)和MaxHistory(3000至5000根K线)。交易时段结构会形成自然停顿,在热力图上会有明显体现。

最小价格变动单位(TickSize)对指标效果至关重要。数值过小会导致过度精细、无实战意义;数值过大会丢失关键细节。设置为0(自动模式)通常最优,系统会根据品种特性自动选取。

透明度既影响视觉效果,也影响运行性能。高透明度(70%至90%)可实现半透明覆盖,不会干扰K线分析,但渲染开销会更大。

根据MetaTrader平台的图形对象数量限制,设定1000个价格层级为上限,超出合理范围会导致界面卡顿,且分析质量无明显提升。


与其他工具集成:方法协同

热力图与成交量剖面的配合使用效果极佳。蓝色时间区域与成交量峰值的重合区域,会成为长期行情关键点位。

结合斐波那契数列水平,结果颇具启发意义。当重要的斐波那契位落入热力图蓝色区域时,其重要性会成倍提升。这是自然而然的,因为数学规律得到了真实价格行为的验证。

波动率指标(如布林带)与热力图配合使用效果良好。红色区域内布林带开口扩大,往往预示即将出现大幅行情;蓝色区域内布林带收口,代表能量正在积蓄,为后续突破蓄力。

计划在下一版指标中加入机器学习,自动为特定品种优化参数。算法将分析各层级表现的统计数据,动态调整设置以实现最高效率。

当价格接近关键区域时,集成的预警系统可自动推送通知。这对波段交易者尤为实用,使其无需时刻盯盘。

支持数据导出,使得基于热力图开发交易机器人成为可能。机器人可将价格层级强度作为入场过滤条件。


设计理念:时间是市场的货币

该指标基于一个深刻的理念:时间就是市场的货币。交易者投入时间如同投入资金一样慎重。价格在某一价位停留越久,沉淀的情绪、决策与资金也就越多。
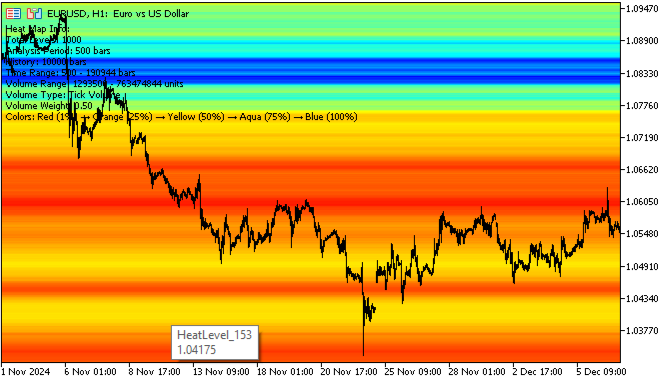
这种情绪附着形成了市场记忆。即使价格离开关键价位,参与者潜意识中仍保留记忆。当价格再次回归,过往记忆被唤醒 —— 有人记起盈利,有人记起亏损,进而影响新的交易决策。

时间热力图能够将这种看不见的记忆可视化,把市场心理转化为数学,把情绪转化为算法,把直觉转化为数据。


结论:以全新视角看待经典规律

该指标并未创造新的原理,只是让经典规律更清晰可见。支撑与阻力一直存在,而现在可以对它们进行量化和分级,并按重要性排序。热力图揭示了市场把时间花在哪些价位上,因此也揭示了真实的力量所在。

结合时间缺口指标,可完整呈现主力资金行为:哪里是快速扫单的区域,哪里是反复沉淀的区域。将两套工具结合,帮助我们更清晰地理解市场结构,使决策建立在逻辑而非直觉之上。

在下一部分中,我们将探讨如何将以上所有内容整合为一套完整的交易系统。

本文由MetaQuotes Ltd译自俄文
原文地址: https://www.mql5.com/ru/articles/18661

附加的文件 |
最近评论 | 前往讨论 (4)
Maxim Kuznetsov
Maxim Kuznetsov | 3 7月 2025 在 09:42

这让我想起:很久以前我也做过类似的事情,

在我看来,你的工作还差一点点就完成了——接下来需要揭示其规律性结构(或者证明它并不存在)。

这当然不是热力图——只是输出了一张类似温度图中规则部分的极值

Stanislav Korotky
Stanislav Korotky | 3 7月 2025 在 14:27
这与众所周知的“市场概况”有什么不同(除了颜色标注之外)?
Maxim Kuznetsov
Maxim Kuznetsov | 3 7月 2025 在 16:33

顺便提一下,该地图是采用最耗时且最易出错的方法计算得出的。

其实操作起来很简单——对于每根K线,向集合中添加2对{price,weight}:{ price=high, weight=-1; } { price=low, weight=+1;},将集合按 price 排序,按 weight 累积求和即为热力图。后续可根据需要进行量化

Lipe Ramos
Lipe Ramos | 15 7月 2025 在 18:44
我决定试用一下ChatGPT,想添加几个“改进”功能,为自己创建些有用的东西——这就是最终的结果。 带注释的部分是我尝试判断价格何时进入某个彩色区域,并直观展示其反应。 但核心思路其实是捕捉这些颜色的细微差别:例如,根据我的观察,当区域呈现稍浅的橙色时,价格往往会进入横盘整理阶段。
//+------------------------------------------------------------------+
//|             Heat Map Plus — 修改版 v3.00                     |
//|   保留缓冲区/警报,并添加ADX、统计数据和排名     |
//+------------------------------------------------------------------+
#property copyright "Chart Coloring by Time and Volume Distribution"
#property link      "https://www.mql5.com"
#property version   "3.00"
#property indicator_chart_window
#property strict

#include <Math\Stat\Math.mqh>    // MathMean, MathStdDev
#include <Indicators\Trend.mqh>     // ADX 用于趋势过滤

// EA的缓冲区
#property indicator_buffers 3
#property indicator_plots   0
double LevelPriceBuffer[];
double LevelStrengthBuffer[];
double LevelTypeBuffer[];

//--- 输入参数
sinput group "=== Heat Map Settings ==="
input int      AnalysisPeriod   = 500;
input int      MaxHistory       = 10000;
input double   TickSize         = 0;
input bool     UseTickVolume    = true;
input double   VolumeWeight     = 0.5;
input int      SessStartHour    = 8;
input int      SessEndHour      = 17;
input double   MinBarRange      = 10;
input bool     EnableAlerts     = true;

//+------------------------------------------------------------------+
//|                                                                  |
//+------------------------------------------------------------------+
sinput group "=== 颜色 (1%→100%) ==="
input color    Color1Percent    = clrRed;
input color    Color25Percent   = clrOrange;
input color    Color50Percent   = clrYellow;
input color    Color75Percent   = clrAqua;
input color    Color100Percent  = clrBlue;
input int      Transparency     = 70;

//--- 全局变量
struct PriceLevel {
 double price, price_high, price_low;
 long   time_spent;
 long   volume;
 double presence_percent;
 color  level_color;
 string object_name; };
PriceLevel      levels[];
datetime        startTime, endTime, lastUpdate;
int             totalPriceLevels = 0;
long            maxTimeSpent = 0, minTimeSpent = LONG_MAX;
long            maxVolume = 0,    minVolume    = LONG_MAX;
bool            calculated = false;

//--- ADX 句柄
CiADX   adx;

//+------------------------------------------------------------------+
//| 初始化                                                  |
//+------------------------------------------------------------------+
int OnInit() {
// EA的缓冲区
 SetIndexBuffer(0, LevelPriceBuffer);
 SetIndexBuffer(1, LevelStrengthBuffer);
 SetIndexBuffer(2, LevelTypeBuffer);
 if(AnalysisPeriod < 50 || MaxHistory < AnalysisPeriod) {
  Print(“参数错误:50 <= AnalysisPeriod <= MaxHistory”);
  return(INIT_PARAMETERS_INCORRECT); }
 if(VolumeWeight < 0 || VolumeWeight > 1) {
  Print("VolumeWeight deve estar em [0,1]");
  return(INIT_PARAMETERS_INCORRECT); }
// ADX(14)
 if(!adx.Create(_Symbol, _Period, 14)) {
  Print("Erro ao criar ADX");
  return(INIT_FAILED); }
 ArrayResize(levels, 0);
 lastUpdate = 0;
 calculated = false;
 totalPriceLevels = 0;
 return(INIT_SUCCEEDED); }

//+------------------------------------------------------------------+
//| 计算                                                     |
//+------------------------------------------------------------------+
int OnCalculate(const int rates_total,
                const int prev_calculated,
                const datetime &time[],
                const double &/*open*/[],
                const double &high[],
                const double &low[],
                const double &/*close*/[],
                const long &tick_volume[],
                const long &volume[],
                const int &/*spread*/[]) {
 if(rates_total < AnalysisPeriod) return(0);
// 仅在新蜡烛线形成时重新计算
 if(lastUpdate == time[rates_total - 1]) return(rates_total);
 lastUpdate = time[rates_total - 1];
 calculated = false;
 if(!calculated) {
  // 更新 ADX
  adx.Refresh(1);
  // 主要计算
  CalculateTimeDistribution(time, high, low, tick_volume, volume, rates_total);
  ColorChart();
  ExportBuffers(rates_total);
  calculated = true; }
 return(rates_total); }

//+------------------------------------------------------------------+
//| 滑动窗口 + 交易时段和波动率过滤器               |
//+------------------------------------------------------------------+
void CalculateTimeDistribution(const datetime &time[],
                               const double &high[],
                               const double &low[],
                               const long &tick_volume[],
                               const long &volume[],
                               int rates_total) {
 ArrayResize(levels, 0);
 int historyStart = MathMax(0, rates_total - MaxHistory);
 startTime = time[historyStart];
 endTime   = time[rates_total - 1];
// 价格范围
 double maxP = high[ArrayMaximum(high, historyStart, MaxHistory)];
 double minP = low [ArrayMinimum(low,  historyStart, MaxHistory)];
 double priceRange = maxP - minP;
 if(priceRange <= 0) return;
// 时间步长
 double tk = (TickSize > 0 ? TickSize : Point());
 totalPriceLevels = (int)(priceRange / tk);
 totalPriceLevels = MathMin(1000, MathMax(50, totalPriceLevels));
 double realTick = priceRange / totalPriceLevels;
// 初始化关卡
 ArrayResize(levels, totalPriceLevels);
 for(int i = 0; i < totalPriceLevels; i++) {
  levels[i].price       = minP + i * realTick;
  levels[i].price_high  = levels[i].price + realTick / 2;
  levels[i].price_low   = levels[i].price - realTick / 2;
  levels[i].time_spent  = 0;
  levels[i].volume      = 0;
  levels[i].object_name = "HeatLevel_" + IntegerToString(i); }
// 遍历条形图
 for(int bar = historyStart; bar < rates_total; bar++) {
  // 会话过滤器
  int hr = TimeHour(time[bar]);
  if(hr < SessStartHour || hr > SessEndHour) continue;
  // 波动率过滤器
  double amp = (high[bar] - low[bar]) / Point();
  if(amp < MinBarRange) continue;
  long barVol = UseTickVolume ? tick_volume[bar] : volume[bar];
  // 查找受影响的层级
  int st = MathMax(0, (int)((low[bar]  - minP) / realTick));
  int en = MathMin(totalPriceLevels - 1,
                   (int)((high[bar] - minP) / realTick));
  for(int li = st; li <= en; li++) {
   if(DoesBarTouchLevel(high[bar], low[bar], levels[li])) {
    levels[li].time_spent++;
    levels[li].volume    += barVol; } } }
// acha 最小值/最大值
 maxTimeSpent = 0; minTimeSpent = LONG_MAX;
 maxVolume    = 0; minVolume    = LONG_MAX;
 for(int i = 0; i < totalPriceLevels; i++) {
  long t = levels[i].time_spent;
  long v = levels[i].volume;
  if(t > maxTimeSpent) maxTimeSpent = t;
  if(t > 0 && t < minTimeSpent) minTimeSpent = t;
  if(v > maxVolume)    maxVolume    = v;
  if(v > 0 && v < minVolume)    minVolume    = v; }
 if(minTimeSpent == LONG_MAX) minTimeSpent = 0;
 if(minVolume   == LONG_MAX) minVolume   = 0;
// 百分比和颜色
 CalculatePercentsAndColors(); }

//+------------------------------------------------------------------+
//| 百分比与核心数                                                |
//+------------------------------------------------------------------+
void CalculatePercentsAndColors() {
 long tr = maxTimeSpent - minTimeSpent;  if(tr <= 0) tr = 1;
 long vr = maxVolume    - minVolume;     if(vr <= 0) vr = 1;
 for(int i = 0; i < totalPriceLevels; i++) {
  double tp = levels[i].time_spent > 0 ?
              ((levels[i].time_spent - minTimeSpent) / (double)tr) * 100.0 : 0;
  double vp = levels[i].volume > 0 ?
              ((levels[i].volume - minVolume) / (double)vr) * 100.0 : 0;
  double comb = (1.0 - VolumeWeight) * tp + VolumeWeight * vp;
  levels[i].presence_percent =
   MathMax(1.0, MathMin(100.0, comb));
  levels[i].level_color =
   GetPercentageColor(levels[i].presence_percent); } }

//+------------------------------------------------------------------+
//| 图表着色 + 警报                                         |
//+------------------------------------------------------------------+

//+------------------------------------------------------------------+
//|                                                                  |
//+------------------------------------------------------------------+
void ColorChart() {
 ClearPreviousObjects();
 datetime nowTime = TimeCurrent();
 double lastBid = SymbolInfoDouble(_Symbol, SYMBOL_BID);
// 区域名称数组
 string zoneNames[5] = {"", “Reversão”, “趋势”, “Lateralização”, "Barreira" };
// 1) 存储商品类型和平均价格
 int    types[]; ArrayResize(types, totalPriceLevels);
 double mids[];  ArrayResize(mids,  totalPriceLevels);
 for(int i = 0; i < totalPriceLevels; i++) {
  types[i] = (int)LevelTypeBuffer[ArraySize(LevelTypeBuffer) - 1 - i];
  if(types[i] < 1 || types[i] > 4)
   types[i] = 4;
  mids[i] = (levels[i].price_low + levels[i].price_high) / 2.0; }
// 2) 创建区域对象(彩色矩形)
 for(int i = 0; i < totalPriceLevels; i++) {
  string nm = levels[i].object_name;
  // 区域矩形
  if(ObjectCreate(ChartID(), nm, OBJ_RECTANGLE, 0,
                  startTime, levels[i].price_low,
                  nowTime,   levels[i].price_high)) {
   ObjectSetInteger(ChartID(), nm, OBJPROP_COLOR, levels[i].level_color);
   ObjectSetInteger(ChartID(), nm, OBJPROP_BACK, true);
   ObjectSetInteger(ChartID(), nm, OBJPROP_FILL, true);
   ENUM_LINE_STYLE style = (Transparency > 50) ? STYLE_DOT : STYLE_SOLID;
   ObjectSetInteger(ChartID(), nm, OBJPROP_STYLE, style);
   ObjectSetInteger(ChartID(), nm, OBJPROP_WIDTH, 1); }
  // 警报
  if(EnableAlerts) {
   static double lastPrice = 0;
   bool cross = ((lastPrice < levels[i].price && lastBid >= levels[i].price) ||
                 (lastPrice > levels[i].price && lastBid <= levels[i].price));
   if(cross) {
    Alert("热力图:价格突破了该水平",
          DoubleToString(levels[i].price, _Digits),
          " [", zoneNames[types[i]], "]"); }
   lastPrice = lastBid; } }
//// 3) 按相邻类型分组,并在每个组上方画一条线
// struct Segment {
//  int type;
//  int start;
//  int end; };
// 段 segs[];
// ArrayResize(segs, 0);
// int currentType = types[0];
// int segStart = 0;
// for(int i = 1; i < totalPriceLevels; i++) {
//  if(types[i] != currentType) {
//   段 seg;
//   seg.type  = currentType;
//   seg.start = segStart;
//   seg.end   = i - 1;
//   ArrayResize(segs, ArraySize(segs) + 1);
//   segs[ArraySize(segs) - 1] = seg;
//   currentType = types[i];
//   segStart    = i; } }
//// 最后一段
// 段 lastSeg;
// lastSeg.type  = currentType;
// lastSeg.start = segStart;
// lastSeg.end   = totalPriceLevels - 1;
// ArrayResize(segs, ArraySize(segs) + 1);
// segs[ArraySize(segs) - 1] = lastSeg;
//// 4) 按区段绘制中位水平线
// for(int j = 0; j < ArraySize(segs); j++) {
//  int s = segs[j].start;
//  int e = segs[j].end;
//  int type = segs[j].type;
//  // 平均价格中位数
//  double avgPrice = 0;
//  for(int k = s; k <= e; k++)
//   avgPrice += mids[k];
//  avgPrice /= (e - s + 1);
//// 创建水平线
//  string lineName = StringFormat(zoneNames[types[s]] + "linha", s, e);
//  if(ObjectCreate(ChartID(), lineName, OBJ_HLINE, 0, 0, avgPrice)) {
//   ObjectSetInteger(ChartID(), lineName, OBJPROP_COLOR, clrWhite);
//   ObjectSetInteger(ChartID(), lineName, OBJPROP_WIDTH, 4);
//   ObjectSetInteger(ChartID(), lineName, OBJPROP_STYLE, STYLE_SOLID);  }
//// 在右侧生成文本(可见的最后一个K线)
//  double textOffset = SymbolInfoDouble(_Symbol, SYMBOL_POINT) * 100; // 行上方的垂直偏移量
//  double textPrice = avgPrice + textOffset;
//  datetime timeRight = iTime(_Symbol, _Period, 0);  // 最新K线的时点
//  string textName = StringFormat(zoneNames[types[s]] + "texto", s, e);
//  if(ObjectCreate(ChartID(), textName, OBJ_TEXT, 0, timeRight, textPrice)) {
//   ObjectSetInteger(ChartID(), textName, OBJPROP_COLOR, clrBlack);
//   ObjectSetInteger(ChartID(), textName, OBJPROP_FONTSIZE, 10);
//   ObjectSetInteger(ChartID(), textName, OBJPROP_CORNER, CORNER_RIGHT_LOWER); // 可选,如需以像素为单位
//   ObjectSetString(ChartID(), textName, OBJPROP_TEXT, zoneNames[types[s]]);
//   ObjectSetInteger(ChartID(), textName, OBJPROP_ANCHOR, ANCHOR_RIGHT);       // 锚点位于该点的右侧
//  } }
}
//+------------------------------------------------------------------+
//|                                                                  |
//+------------------------------------------------------------------+
int CountZLineObjects() {
 int total = ObjectsTotal(ChartID());
 int count = 0;
 for(int i = 0; i < total; i++) {
  string name = ObjectName(ChartID(), i);
  if(StringFind(name, "ZLine_") == 0) // 检查是否以“ZLine_”开头
   count++; }
 return count; }
//+------------------------------------------------------------------+
//| 将缓冲区导出到EA并进行区域分类                 |
//+------------------------------------------------------------------+
void ExportBuffers(int rates_total) {
// 构建统计数组
 double stats[]; ArrayResize(stats, totalPriceLevels);
 for(int i = 0; i < totalPriceLevels; i++)
  stats[i] = levels[i].presence_percent;
 double mean = MathMean(stats);
 double sd   = MathStdDev(stats, mean);
 if(sd <= 0) sd = mean * 0.1;
 double adxValue = adx.Main(0);
 int cnt = MathMin(totalPriceLevels,
                   ArraySize(LevelPriceBuffer));
 for(int i = 0; i < cnt; i++) {
  // 区域类型
  double p = levels[i].presence_percent;
  int ztype = 4; // 默认使用BARREIRA
  if(p < mean - sd)                                 ztype = 1; // 修订版
  else if(p > mean + sd && adxValue >= 25.0)        ztype = 2; // 趋势
  else if(adxValue < 20.0)                          ztype = 3; // 侧化
  LevelPriceBuffer   [rates_total - 1 - i] = levels[i].price;
  LevelStrengthBuffer[rates_total - 1 - i] = p;
  LevelTypeBuffer    [rates_total - 1 - i] = ztype; } }

//+------------------------------------------------------------------+
//| 辅助函数                                                         |
//+------------------------------------------------------------------+
bool DoesBarTouchLevel(double high, double low,
                       const PriceLevel &L) {
 return(high >= L.price_low && low <= L.price_high); }

//+------------------------------------------------------------------+
//|                                                                  |
//+------------------------------------------------------------------+
void ClearPreviousObjects() {
 int tot = ObjectsTotal(ChartID());
 for(int i = tot - 1; i >= 0; i--) {
  string nm = ObjectName(ChartID(), i);
  if(StringFind(nm, "HeatLevel_") == 0)
   ObjectDelete(ChartID(), nm); } }

//+------------------------------------------------------------------+
//|                                                                  |
//+------------------------------------------------------------------+
color GetPercentageColor(double p) {
 if(p <= 1.0)      return Color1Percent;
 else if(p <= 25.) return InterpolateColor(
                            Color1Percent,
                            Color25Percent,
                            (p - 1) / 24);
 else if(p <= 50.) return InterpolateColor(
                            Color25Percent,
                            Color50Percent,
                            (p - 25) / 25);
 else if(p <= 75.) return InterpolateColor(
                            Color50Percent,
                            Color75Percent,
                            (p - 50) / 25);
 else              return InterpolateColor(
                            Color75Percent,
                            Color100Percent,
                            (p - 75) / 25); }

//+------------------------------------------------------------------+
//|                                                                  |
//+------------------------------------------------------------------+
color InterpolateColor(color c1, color c2, double f) {
 int r1 = (c1 >> 16) & 0xFF, g1 = (c1 >> 8) & 0xFF,
     b1 = c1 & 0xFF;
 int r2 = (c2 >> 16) & 0xFF, g2 = (c2 >> 8) & 0xFF,
     b2 = c2 & 0xFF;
 int r = int(r1 + (r2 - r1) * f),
     g = int(g1 + (g2 - g1) * f),
     b = int(b1 + (b2 - b1) * f);
 return (r << 16) | (g << 8) | b; }

//+------------------------------------------------------------------+
//|                                                                  |
//+------------------------------------------------------------------+
int TimeHour(const datetime time) {
 MqlDateTime dt;
 TimeToStruct(time, dt);
 return dt.hour; }
//+------------------------------------------------------------------+
//+------------------------------------------------------------------+
//| DrawAndExport                                                    |
//+------------------------------------------------------------------+
//+------------------------------------------------------------------+
//| 计算一个 double 类型数组的平均值                            |
//+------------------------------------------------------------------+
double MathMean(const double &a[], const int count) {
 if(count <= 0) return 0.0;
 double sum = 0.0;
 for(int i = 0; i < count; i++)
  sum += a[i];
 return sum / count; }
//+------------------------------------------------------------------+
//| 计算一个 double 数组的样本标准差           |
//+------------------------------------------------------------------+
double MathStdDev(const double &a[], const int count) {
 if(count < 2) return 0.0;
 double mean = MathMean(a, count);
 double sumSq = 0.0;
 for(int i = 0; i < count; i++)
  sumSq += MathPow(a[i] - mean, 2);
 return MathSqrt(sumSq / (count - 1));  // 样本标准差
}
//+------------------------------------------------------------------+
交易策略 交易策略
各种交易策略的分类都是任意的,下面这种分类强调从交易的基本概念上分类。
开发多币种 EA(第 27 部分):多行文本显示组件 开发多币种 EA(第 27 部分):多行文本显示组件
如果需要在图表上显示文本,我们可以使用 Comment() 函数。但它的功能相当有限。因此,在本文中,我们将自行开发一个组件 — 一个全屏对话框,该对话框能够显示多行文本,支持灵活的字体设置和滚动功能。
新手在交易中的10个基本错误 新手在交易中的10个基本错误
新手在交易中会犯的10个基本错误: 在市场刚开始时交易, 获利时不适当地仓促, 在损失的时候追加投资, 从最好的仓位开始平仓, 翻本心理, 最优越的仓位, 用永远买进的规则进行交易, 在第一天就平掉获利的仓位,当发出建一个相反的仓位警示时平仓, 犹豫。
按小时、星期几和每月日期分析的季节性指标 按小时、星期几和每月日期分析的季节性指标
本文介绍如何开发一款用于分析金融市场中重复性价格模式的工具 —— 可按每月日期(1-31 日)、星期几(周一至周日)或每日小时(0-23 时)进行分析。该指标分析历史数据,计算每个周期的平均收益率,并以直方图形式展示结果并附带预测。指标包含可自定义参数:季节性类型、分析 K 线数量、以百分比或绝对值显示、图表颜色等。