
将 MQL5 与数据处理包集成 (第 2 部分):机器学习和预测分析
概述
在本文中,我们特别关注机器学习 (ML) 和预测分析。数据处理包为量化交易员和金融分析师开辟了新的领域。通过在 MQL5 中嵌入机器学习功能,交易者可以将他们的交易策略从传统的基于规则的系统提升到复杂的、数据驱动的模型,从而不断适应不断变化的市场条件。
该过程涉及将 Python 强大的数据处理和机器学习库(如scikit-learn)与 MQL5 结合使用。这种集成允许交易者使用历史数据训练预测模型,使用回溯测试技术测试其有效性,然后部署这些模型以做出实时交易决策。将这些工具灵活地融合在一起,可以创建超越经典技术指标的策略,结合预测分析和模式识别,从而显著提高交易结果。
收集历史数据
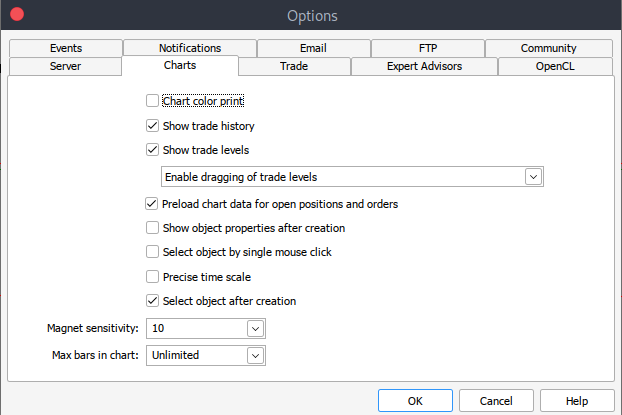
首先,我们需要以 .csv 格式保存的 MetaTrader 5 历史数据,因此只需启动您的 MetaTrader 平台,然后在 MetaTrader 5 菜单/面板顶部导航至 >工具,然后 >选项,您将进入图表选项。然后,您需要选择要下载的图表中的柱形数量。最好选择无限柱数的选项,因为我们将根据日期进行操作,并且我们不知道在给定的时间段内有多少柱形。
此后,您现在必须下载真实数据。为此,您必须导航至 >查看,然后导航至 >交易品种,您将进入“规范”选项卡,只需导航至 >柱或报价,具体取决于要下载的数据类型。继续并输入您要下载的历史数据的开始和结束日期,然后单击请求按钮下载数据并将其保存为 .csv 格式。
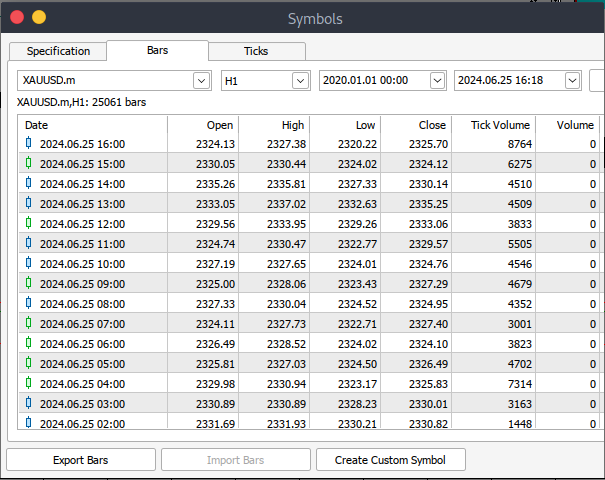
完成所有这些步骤后,您将成功地从 MetaTrader 交易平台下载历史数据。现在您需要下载并设置 Jupyter Lab 环境以进行分析。要下载并设置 Jupyter Lab,您可以前往其官方网站并按照简单的步骤进行下载。根据您使用的操作系统类型,您可以选择使用 pip 、 conda 或 brew 安装。
在 Jupyter Lab 上处理 MetaTrader 5 历史数据
要在 Jupyter Lab 上成功加载 MetaTrader 5 历史数据,您必须知道您选择下载数据的文件夹,然后在 Jupyter Lab 上只需导航到该文件夹即可。要开始,您必须加载数据并检查列名。我们必须检查列的名称,以便正确处理列并避免因使用错误的列名而可能出现的错误。 Python代码:
import pandas as pd

# assign variable to the historical data
file_path = '/home/int_junkie/Documents/ML/predi/XAUUSD.m_H1_201510010000_202408052300.csv'

data = pd.read_csv(file_path, delimiter='\t')

# Display the first few rows and column names
print(data.head())
print(data.columns)
输出:
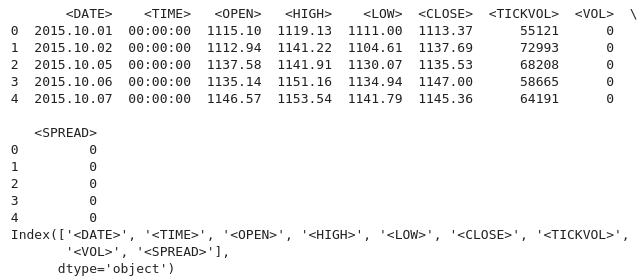
我们正在使用 2015 年至 2024 年的 MetaTrader 5 历史数据,这大约是 9 年的历史数据。这种数据有助于捕捉广泛的市场周期。该数据集可能会捕捉到不同的市场阶段,这将有助于更好地理解和建模这些周期。较长的数据集通过提供更全面的场景范围来降低过度拟合的可能性。
在更广泛的数据集上训练的模型更有可能很好地推广到看不见的数据,特别是如果数据集是像 1H 这样的较低时间框架的数据集。这在时间序列分析中尤为重要,因为更多的观察可以提高结果的可靠性。例如,您可以检测与预测相关的长期趋势(长期市场方向)或反复出现的季节性影响。
基于历史数据的折线图
data.plot.line(y = "<CLOSE>", x = "<DATE>", use_index = True)
输出:
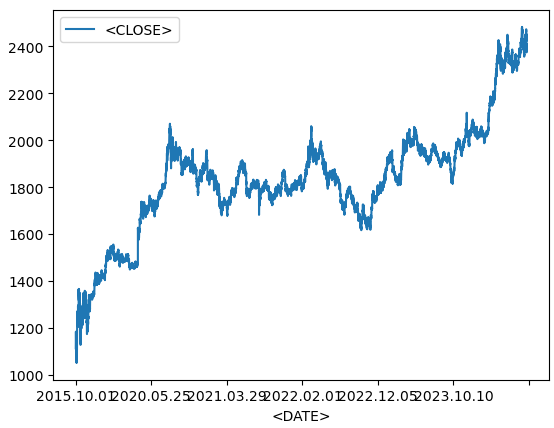
我们在可视化时间序列数据时使用上面的代码,例如随时间变化的金融资产。如果您的数据帧索引已经包含日期,则可以跳过指定“x =“<DATE>””并直接使用“use_index = True”。
del data["<VOL>"]
del data["<SPREAD>"]
然后,我们从历史数据中删除指定的列,我们使用 pandas 库来删除这些列。
data.head()
输出:
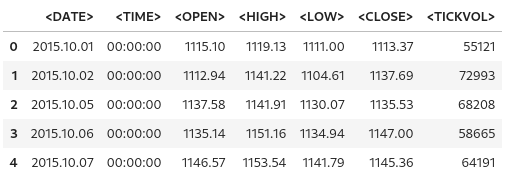
从上面的输出我们可以看到指定的列确实被删除了。
# We add a colunm for tommorows price
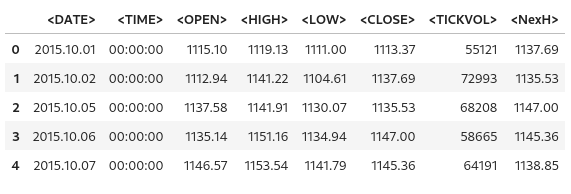
data["<NexH>"] = data["<CLOSE>"].shift(-1)
1. 'data["<NexH>"]':
- 这会将一个名为“<NexH>”(下一小时)的新列添加到“data”数据帧中。此列中的值将代表相对于每一行的下一小时的收盘价。
2. 'data["<CLOSE>"].shift(-1)':
- 'data["<CLOSE>"]' 指的是数据帧中包含每个日期时间的收盘价的现有列。
- '.shift(-1)' 方法将“<CLOSE>”列中的日期时间向上移动 1 行(因为参数为'-1'),从而有效地将每个值移动到上一行。
- 因此,最初与特定日期对应的值现在将出现在与前一个日期对应的行中。
输出:
data["<TRGT>"] = (data["<NexH>"] > data["<CLOSE>"]).astype(int)

data
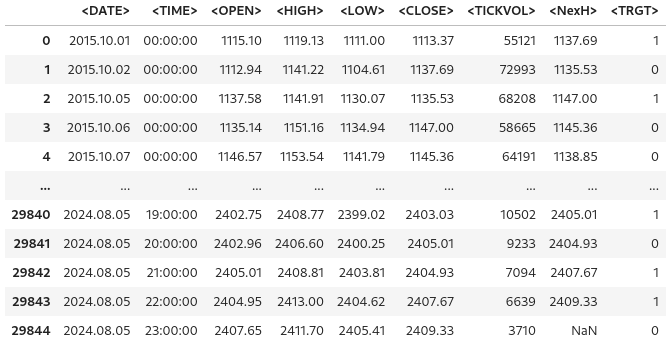
然后我们使用上面的代码在“data”数据帧中创建新列,其中包含二进制值(0 或 1),表示下一时期的最高价(“NexH”)是否高于当前收盘价(“<CLOSE>”)。
1. 'data["<TRGT>"]':
- 这是“data”数据帧中名为“<TRGT>”(目标)的新列。此列将根据条件存储二进制目标值(0 或 1)。
2. '(data["<NexH>"] > data["<CLOSE>"])':
- 此表达式将每行的“<NexH>”列(下一周期的最高价)中的值与“<CLOSE>”列(当前收盘价)中的值进行比较。
- 这是一个布尔系列,其中每个值要么是“True”(如果下一个最高价高于当前收盘价),要么是“False”(如果否)。
3. ‘.astype(int)’:
- 此函数将布尔值(“True”或“False”)转换为整数(分别为“1”或“0”)。
- “True” 变为 “1”,“False” 变为 “0”。
输出:
from sklearn.ensemble import RandomForestClassifier

model = RandomForestClassifier(n_estimators = 50, min_samples_split = 50, random_state = 1)

train = data.iloc[:-50]
test = data.iloc[-50:]

predictors = ["<CLOSE>","<TICKVOL>", "<OPEN>", "<HIGH>", "<LOW>"]
model.fit(train[predictors], train["<TRGT>"])
输出:

1.导入随机森林分类器:
- “Random-Forest-Classifier”(随机森林分类器)是一个组装机器学习模型,它建立多个决策树并合并它们的输出以提高预测准确性并控制过度拟合。
2.模型初始化:
- “estimator”指定森林中的决策树的数量。在本例中,模型将构建50棵树。
- “min_sample_split”设置拆分内部节点所需的最小样本数。较高的值可以通过确保只有在有足够的数据可用时才会发生拆分来减少过度拟合。
- “random_state”将随机种子固定为不确定结果的可重复性。每次运行代码时,使用相同的种子(例如“1”)将产生相同的结果。
3.将数据分为训练集和测试集:
- 'data.iloc[:-50]' 选择除最后 50 行之外的所有行作为训练数据。
- 'data.iloc[-50:]' 选择最后 50 行作为测试数据
- 这种分割通常用于时间序列数据,其中模型在历史数据上进行训练,并在最新数据上进行测试,以评估未来预测的性能。
4.指定预测变量:
- “predictors”列表包含代表模型用于进行预测的特征的列名。这些列名包括(''“<CLOSE>”,'“<TICKVOL>”','“<OPEN>”','“<HIGH>”'和'“<LOW>”')。
该代码准备了一个随机森林分类器,根据过去的数据预测未来的市场行为。该模型使用收盘价、分时交易量等特征进行训练。在将数据分解为训练集和测试集后,将模型拟合到训练数据上,从历史模式中学习以做出未来的预测。
测量模型的准确率
from sklearn.metrics import precision_score

prcsn = model.predict(test[predictors])
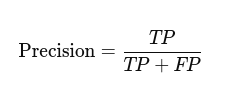
我们从“sklearn.metrics”模块导入函数“precision-score”。精度分数是一种用于评估分类模型的指标,在类不平衡时特别有用。它衡量了有多少预测的正面结果实际上是正面的。高精度表示低正面率。

prcsn = pd.Series(prcsn, index = test.index)
然后,我们将预测('prcsn')转换为 Pandas“系列”,同时保留测试数据集的索引。
precision_score(test["<TRGT>"], prcsn) 通过将测试集中的实际目标值与预测值进行比较,我们得到了模型预测的精度。
输出:
![]()
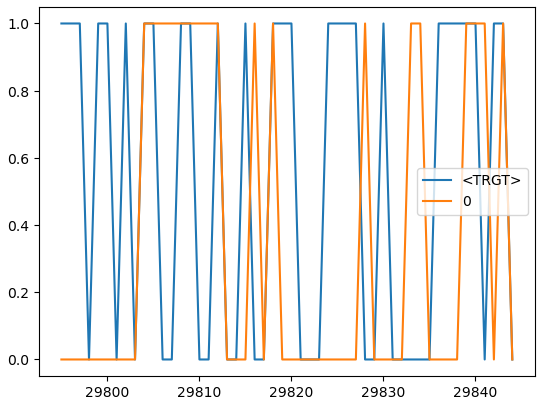
cmbnd = pd.concat([test["<TRGT>"], prcsn], axis = 1)

cmbnd.plot()
我们将实际目标值和模型的预测值组合到一个数据帧中,以便于分析。
输出:
def predors(train, test, predictors, model):
    model.fit(train[predictors], train["<TRGT>"])
    prcsn = model.predict(test[predictors])
    prcsn = pd.Series(prcsn, index = test.index, name = "Predictions")
    cmbnd = pd.concat([test["<TRGT>"], prcsn], axis = 1)
    return cmbnd
此函数接受训练和测试数据集、预测变量列表和机器学习模型。该函数在训练数据上训练模型,对测试数据进行预测,并返回一个数据帧,其中并排包含实际目标值和预测值。
def backtestor(data, model, predictors, start = 2500, step = 250):
    all_predictions = []

    for i in range(start, data.shape[0], step):
        train = data.iloc[0:i].copy()
        test = data.iloc[i:(i + step)].copy()
        predictions = predors(train, test, predictors, model)
        all_predictions.append(predictions)
    return pd.concat(all_predictions)
此函数使用机器学习模型对时间序列数据集执行回溯测试。回溯测试通过模拟预测来评估模型的性能,就像预测是在真实的交易环境中做出的一样,随着时间的推移,数据会逐渐显现出来。
predictions = backtestor(data, model, predictors)
使用指定的数据集(“data”)、机器学习模型(“model”)和预测变量(“predictors”)运行“backtestor”函数。它执行滚动回测,并将结果预测存储在变量“predicitions”中。
predictions["Predictions"].value_counts() 我们计算“prediction”数据帧的“Predictions”列中每个唯一值出现的次数。
输出:

precision_score(predictions["<TRGT>"], predictions["Predictions"])
计算模型预测的精度。精度是衡量正面预测准确性的指标。
输出:
![]()
predictions["<TRGT>"].value_counts() / predictions.shape[0]
计算 `"<TRGT>"` 列中每个唯一值占预测总数的比例。
输出:

horizons = [2, 5, 55, 125, 750]
new_predictors = []

# Ensure only numeric columns are used for rolling calculations
numeric_columns = data.select_dtypes(include=[float, int]).columns

for i in horizons:
    # Calculate rolling averages for numeric columns only
    rolling_averages = data[numeric_columns].rolling(i).mean()

    # Generate the ratio column
    ratio_column = f"Close_Ratio_{i}"
    data[ratio_column] = data["<CLOSE>"] / rolling_averages["<CLOSE>"]

    # Generate the trend column
    trend_column = f"Trend_{i}"
    data[trend_column] = data["<TRGT>"].shift(1).rolling(i).sum()

    new_predictors += [ratio_column, trend_column]
data
基于不同时间范围内的滚动平均值和趋势生成新特征。额外的预测器通过在不同时期为模型提供更多市场信息来帮助提高模型性能。
输出:
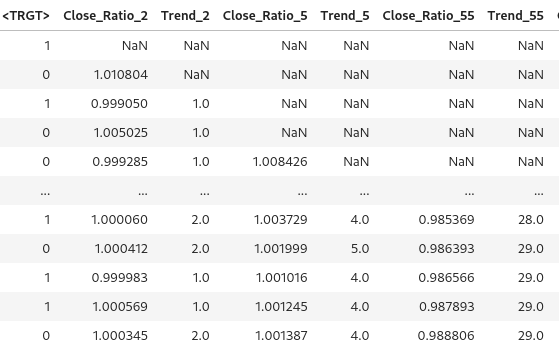
data = data.dropna()
我们删除数据帧中缺少值的任何行。
def predict(train, test, predictors, model):
    model.fit(train[predictors], train["<TRGT>"])
    prcsn = model.predict_proba(test[predictors])[:1]
    prcsn[prcsn >= .6] = 1
    prcsn[prcsn < .6] = 0
    prcsn = pd.Series(prcsn, index = test.index, name = "Predictions")
    cmbnd = pd.concat([test["<TRGT>"], prcsn], axis = 1)
    return cmbnd
使用所选的预测器和目标变量在训练数据集上训练模型。对于阈值和预测,我们应用 0.6 的自定义阈值。如果 class1 的概率为 0.6 或更高,则模型预测“1”。否则,如果预测“0”。这一调整使模型更加保守,在发出交易信号之前需要更高的信心。
predictions = backtestor(data, model, new_predictors)
predictions["Predictions"].value_counts() precision_score(predictions["<TRGT>"], predictions["Predictions"])
输出:
![]()
如果我们四舍五入,我们的精确得分略有上升,为 0.52。
训练模型并将其导出到 ONNX
import pandas as pd
from sklearn.ensemble import RandomForestClassifier
from sklearn.model_selection import train_test_split
import onnx
import skl2onnx
from skl2onnx import convert_sklearn
from skl2onnx.common.data_types import FloatTensorType

# Load and preprocess your data (example)
# Replace this with your actual data loading process
#data = pd.read_csv('your_data.csv')  # Replace with your actual data source
#data = data.dropna()

# Define predictors and target
predictors = ["<CLOSE>", "<TICKVOL>", "<OPEN>", "<HIGH>", "<LOW>"]
target = "<TRGT>"

# Split data into train and test sets
train, test = train_test_split(data, test_size=0.2, shuffle=False)

# Define and train the model
model = RandomForestClassifier(n_estimators=50, min_samples_split=50, random_state=1)
model.fit(train[predictors], train[target])

# Export the trained model to ONNX format
initial_type = [('float_input', FloatTensorType([None, len(predictors)]))]
onnx_model = convert_sklearn(model, initial_types=initial_type)

# Save the ONNX model to a file
with open("random_forest_model.onnx", "wb") as f:
    f.write(onnx_model.SerializeToString())
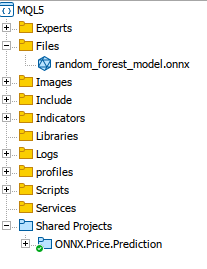
我们训练模型,然后使用 `skl2onnx` 将其转换、导出并保存为 ONNX 格式。我们将保存的模型复制到 MQL5“Files”文件夹,以便我们可以访问它。
将所有内容放在 MQL5 中
在 Oninit() 上加载模型。
#include <Trade/Trade.mqh>
#define   ModelName          "RandomForestClassifier"
#define   ONNXFilename       "random_forest_model.onnx"

// Single ONNX model resource
#resource "\\Files\\random_forest_model.onnx" as const uchar ExtModelDouble[];

input double lotsize = 0.1;     // Trade lot size
input double stoploss = 20;     // Stop loss in points
input double takeprofit = 50;   // Take profit in points

// Trading functions
CTrade m_trade;
全局作用域上的 include 和全局变量。我们还指定将 ONNX 模型作为二进制资源嵌入到 MQL5 中。`#resource` 用于包含外部文件。
//+------------------------------------------------------------------+
//| Run classification using double values                           |
//+------------------------------------------------------------------+
bool RunModel(long model, vector &input_vector, vector &output_vector)
{
    ulong batch_size = input_vector.Size() / 5; // Assuming 5 input features
    if (batch_size == 0)
        return (false);

    output_vector.Resize((int)batch_size);

    // Prepare input tensor
    double input_data[];
    ArrayResize(input_data, input_vector.Size());

    for (int k = 0; k < input_vector.Size(); k++)
        input_data[k] = input_vector[k];

    // Set input shape
    ulong input_shape[] = {batch_size, 5}; // 5 input features for each prediction
    OnnxSetInputShape(model, 0, input_shape);

    // Prepare output tensor
    double output_data[];
    ArrayResize(output_data, (int)batch_size);

    // Set output shape (binary classification)
    ulong output_shape[] = {batch_size, 2}; // Output shape for probability (0 or 1)
    OnnxSetOutputShape(model, 0, output_shape);

    // Run the model
    bool res = OnnxRun(model, ONNX_DEBUG_LOGS, input_data, output_data);

    if (res)
    {
        // Copy output to vector (only keeping the class with highest probability)
        for (int k = 0; k < batch_size; k++)
            output_vector[k] = (output_data[2 * k] < output_data[2 * k + 1]) ? 1.0 : 0.0;
    }

    return (res);
}
函数“RunModel”是我们训练的用于执行二元分类的 ONNX 模型。该函数基于哪个类具有更高的概率来确定预测的类(0 或 1),并将结果存储在输出向量中。
//+------------------------------------------------------------------+
//| Generate input data for prediction                               |
//+------------------------------------------------------------------+
vector input_data()
{
    vector input_vector;
    MqlRates rates[];

    // Get the last 5 bars of data
    if (CopyRates(Symbol(), PERIOD_H1, 5, 1, rates) > 0)
    {
        input_vector.Resize(5 * 5); // 5 input features for each bar

        for (int i = 0; i < 5; i++)
        {
            input_vector[i * 5] = rates[i].open;
            input_vector[i * 5 + 1] = rates[i].high;
            input_vector[i * 5 + 2] = rates[i].low;
            input_vector[i * 5 + 3] = rates[i].close;
            input_vector[i * 5 + 4] = rates[i].tick_volume;
        }
    }

    return (input_vector);
}

//+------------------------------------------------------------------+
//| Check if there is a new bar                                      |
//+------------------------------------------------------------------+
bool NewBar()
{
    static datetime last_time = 0;
    datetime current_time = iTime(Symbol(), Period(), 0);

    if (current_time != last_time)
    {
        last_time = current_time;
        return (true);
    }
    return (false);
}

//+------------------------------------------------------------------+
//| Check if a position of a certain type exists                     |
//+------------------------------------------------------------------+
bool PosExists(int type)
{
    for (int i = PositionsTotal() - 1; i >= 0; i--)
    {
        if (PositionGetInteger(POSITION_TYPE) == type && PositionGetString(POSITION_SYMBOL) == Symbol())
            return (true);
    }
    return (false);
}

//+------------------------------------------------------------------+
//| Script program initialization                                    |
//+------------------------------------------------------------------+
int OnInit()
{
    Print("Initializing ONNX model...");

    // Initialize the ONNX model
    long model = OnnxCreateFromBuffer(ExtModelDouble, ONNX_DEFAULT);
    if (model == INVALID_HANDLE)
    {
        Print("Error loading ONNX model: ", GetLastError());
        return INIT_FAILED;
    }

    // Store the model handle for further use
    GlobalVariableSet("model_handle", model);
    return (INIT_SUCCEEDED);
}

//+------------------------------------------------------------------+
//| Expert tick function                                             |
//+------------------------------------------------------------------+
void OnTick()
{
    if (NewBar()) // Trade at the opening of a new candle
    {
        vector input_vector = input_data();
        vector output_vector;

        // Retrieve the model handle
        long model = GlobalVariableGet("model_handle");
        if (model == INVALID_HANDLE)
        {
            Print("Invalid model handle.");
            return;
        }

        bool prediction_success = RunModel(model, input_vector, output_vector);
        if (!prediction_success || output_vector.Size() == 0)
        {
            Print("Prediction failed.");
            return;
        }

        long signal = output_vector[0]; // The predicted class (0 or 1)

        MqlTick ticks;
        if (!SymbolInfoTick(Symbol(), ticks))
            return;

        if (signal == 1) // Bullish signal
        {
            if (!PosExists(POSITION_TYPE_BUY)) // No buy positions exist
            {
                if (!m_trade.Buy(lotsize, Symbol(), ticks.ask, ticks.bid - stoploss * Point(), ticks.ask + takeprofit * Point())) // Open a buy trade
                    Print("Failed to open a buy position, error = ", GetLastError());
            }
        }
        else if (signal == 0) // Bearish signal
        {
            if (!PosExists(POSITION_TYPE_SELL)) // No sell positions exist
            {
                if (!m_trade.Sell(lotsize, Symbol(), ticks.bid, ticks.ask + stoploss * Point(), ticks.bid - takeprofit * Point())) // Open a sell trade
                    Print("Failed to open a sell position, error = ", GetLastError());
            }
        }
    }
}

//+------------------------------------------------------------------+
//| Script program deinitialization                                  |
//+------------------------------------------------------------------+
void OnDeinit(const int reason)
{
    // Release the ONNX model
    long model = GlobalVariableGet("model_handle");
    if (model != INVALID_HANDLE)
    {
        OnnxRelease(model);
    }
}
在初始化过程中,加载模型并存储其句柄以供以后使用。在“OnTick()”函数中,当检测到新柱时,脚本就会运行模型。我们使用模型的预测(0 表示看跌,1 表示看涨),并据此执行交易。当模型预测看涨趋势时,进行买入交易,而当模型预测看跌趋势时,则进行卖出交易。
结论
总之,我们使用数据处理包(Jupyter Lab)来处理历史数据,使用机器学习开发和训练模型以便能够做出预测。我们探索了无缝集成和运行所必需的关键步骤。然后,我们专注于在 MQL5 中加载和处理模型,将其嵌入为资源,并确保模型在运行时正确初始化并可用。
总之,我们已将 ONNX 模型集成到 MQL5 交易环境中,以使用机器学习增强决策。该过程始于将模型加载到 MQL5 环境中。然后,我们配置了 EA 交易来收集相关的市场数据,将其预处理为特征向量,并将其输入模型进行预测。逻辑被设计用来根据模型的输出来执行交易。仅当检测到新柱且没有冲突交易时才会开仓。此外,该系统还处理头寸检查、错误管理和资源分配,以确保稳健而高效的交易解决方案。这一实现展示了金融分析与人工智能驱动洞察的无缝融合,实现了适应实时市场状况的自动交易策略。
参考
本文由MetaQuotes Ltd译自英文
原文地址: https://www.mql5.com/en/articles/15578
注意: MetaQuotes Ltd.将保留所有关于这些材料的权利。全部或部分复制或者转载这些材料将被禁止。
本文由网站的一位用户撰写,反映了他们的个人观点。MetaQuotes Ltd 不对所提供信息的准确性负责,也不对因使用所述解决方案、策略或建议而产生的任何后果负责。
 因果网络分析(CNA)、随机模型最优控制(SMOC)和纳什博弈论结合深度学习的示例
 您应当知道的 MQL5 向导技术(第 31 部分):选择损失函数


你好
我也遇到了完全相同的错误
,我不知道,但至少应该对提交的最终代码进行一些质量控制。