Rubdfx OBOS

RoboS Indicator Version 1.5

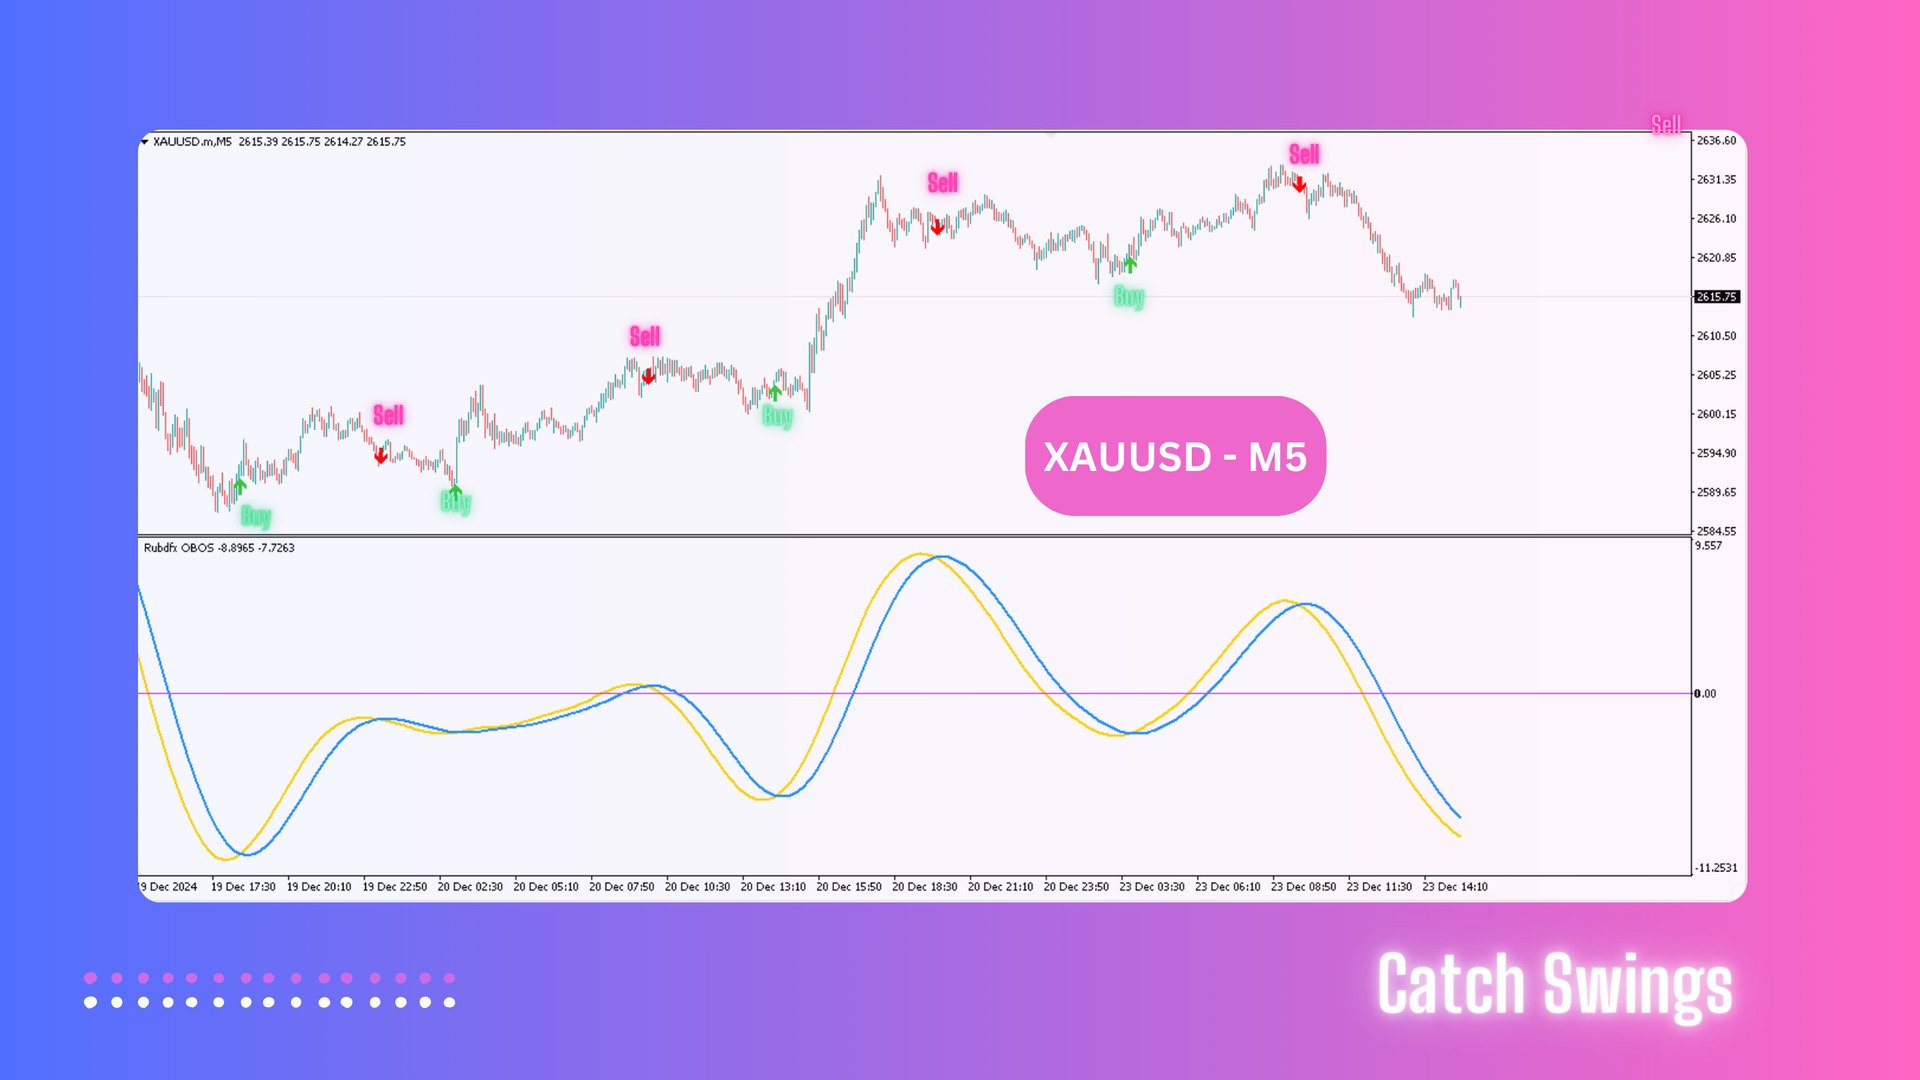
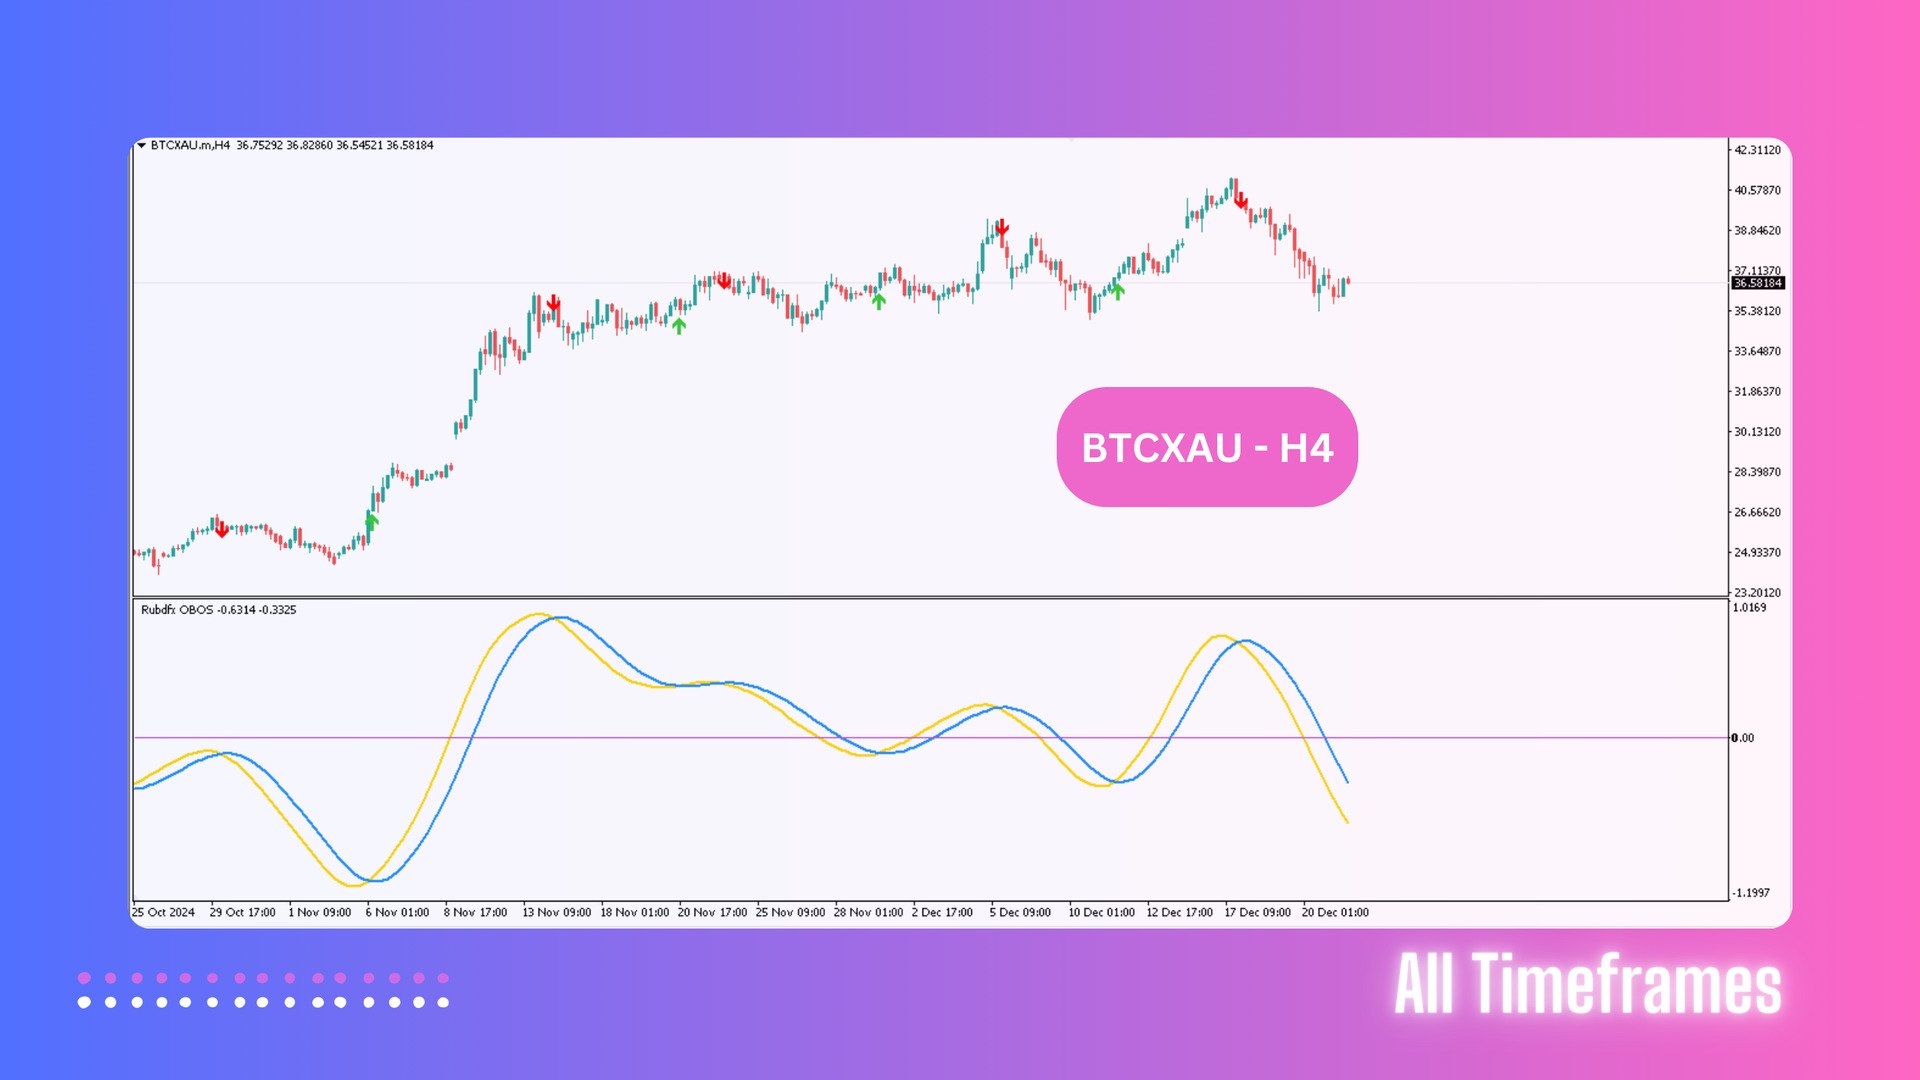
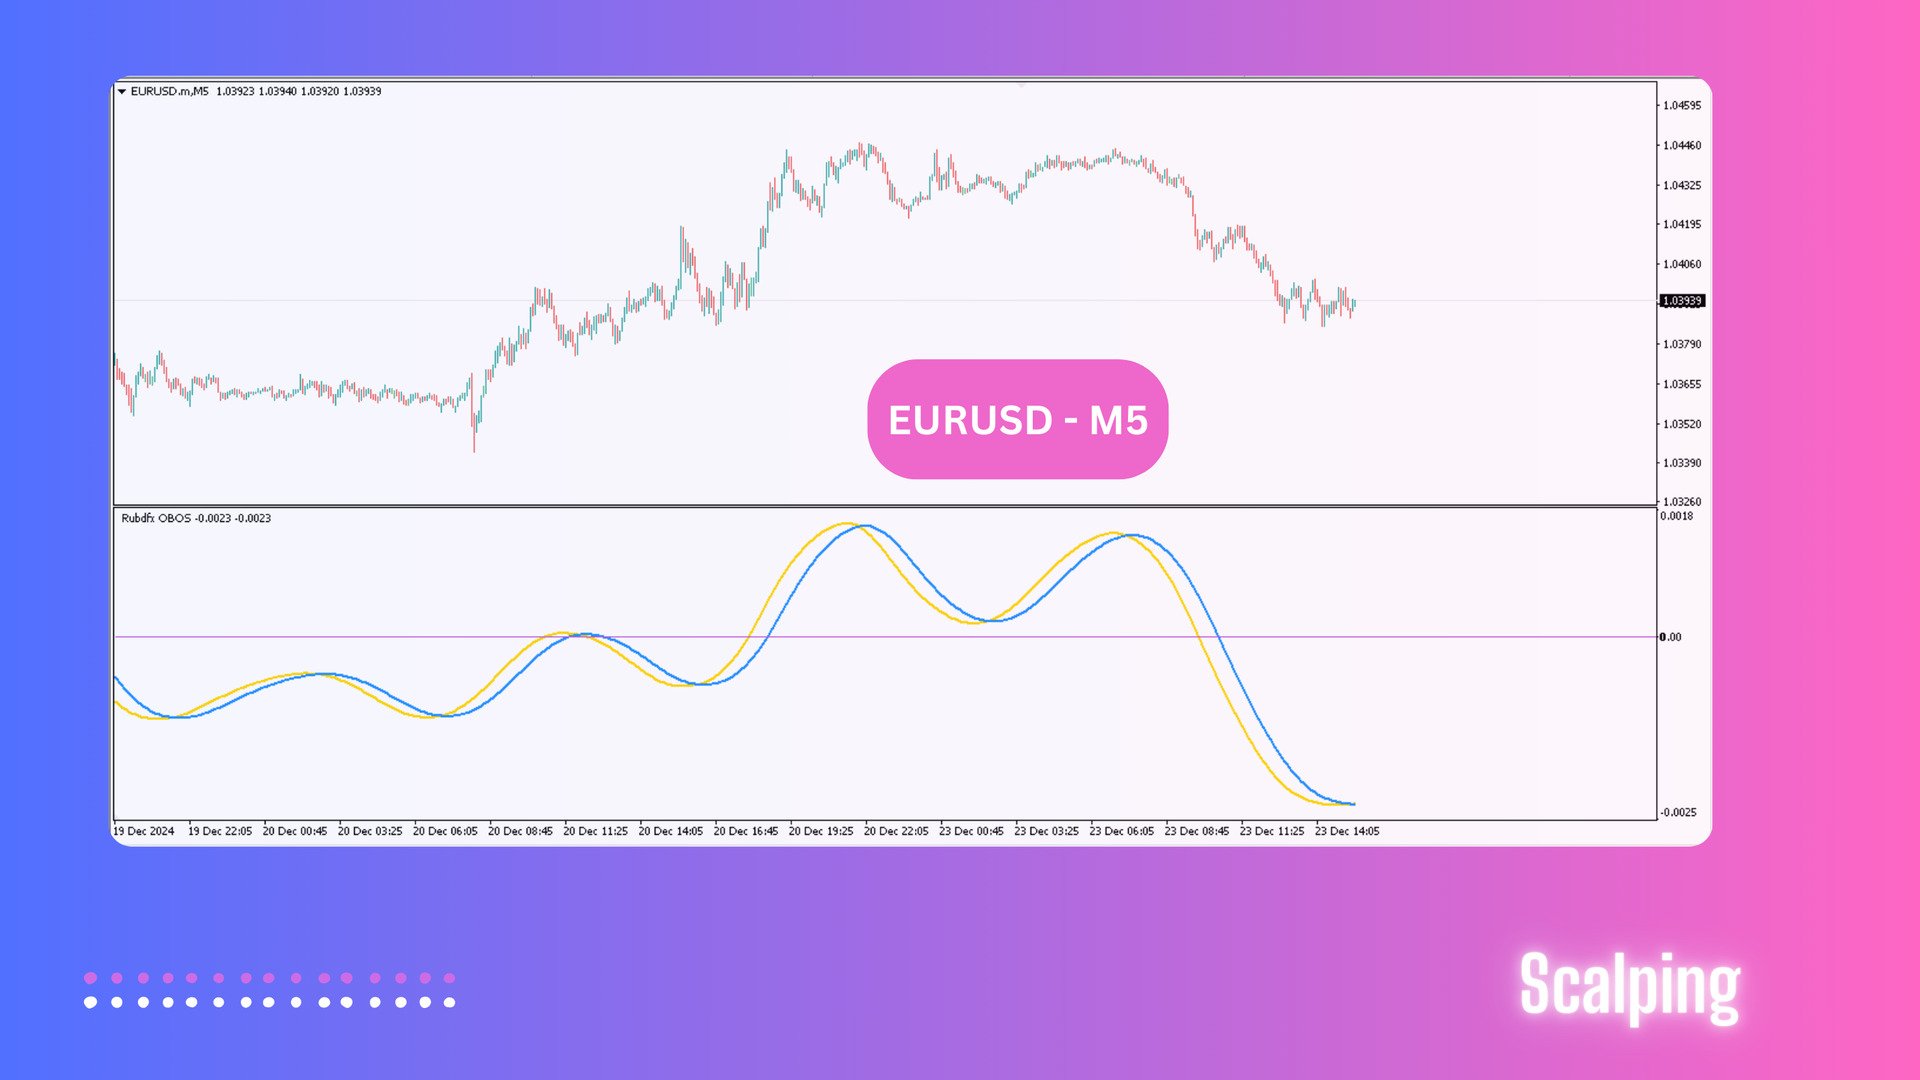
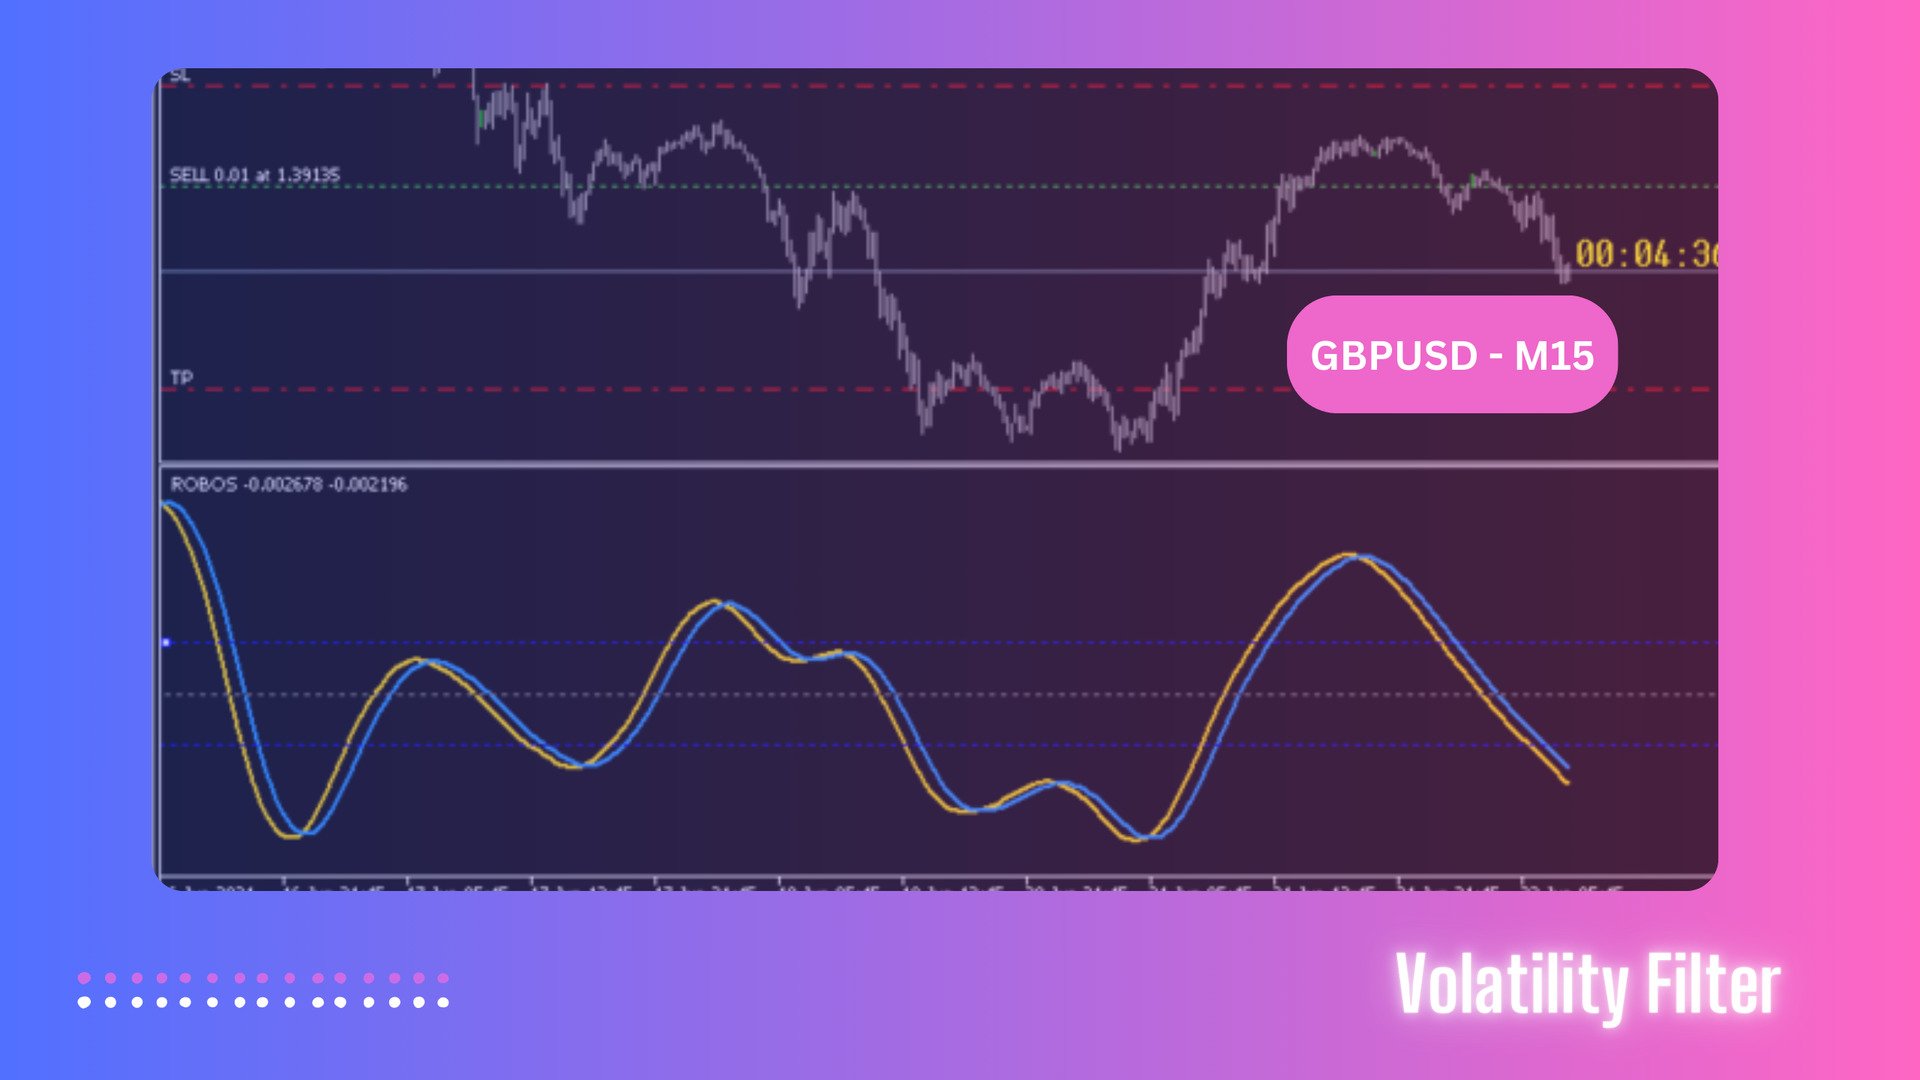
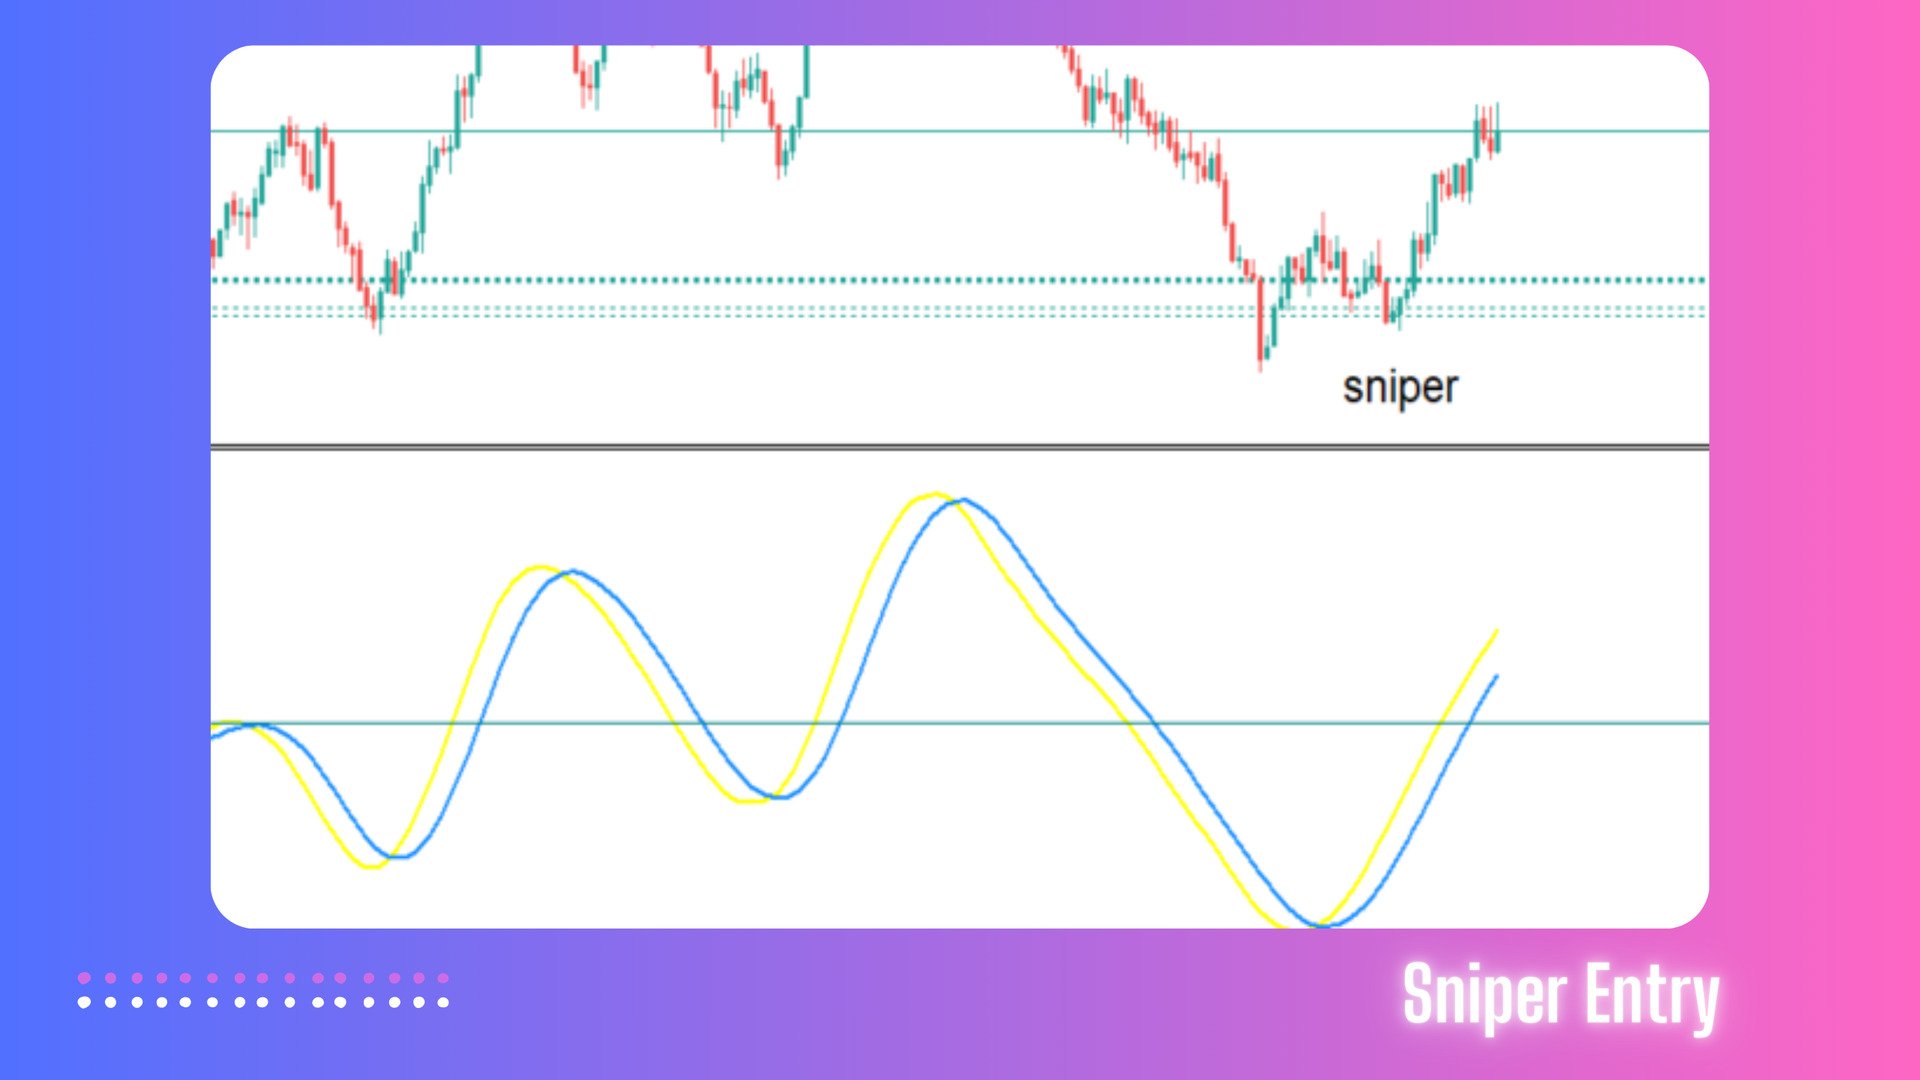
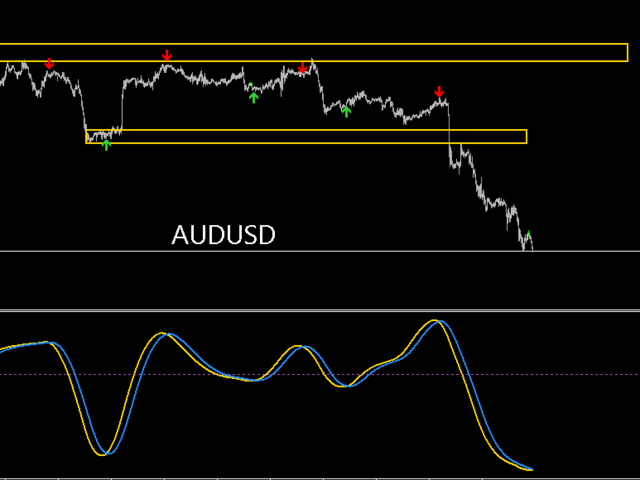
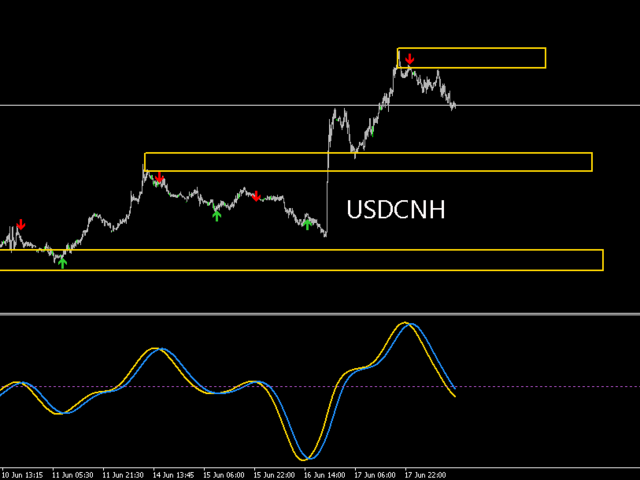
The RoboS Indicator is a trading tool designed to enhance your market analysis. With advanced features such as Buy and Sell signals, it simplifies decision-making for traders across all experience levels. This indicator is compatible with all symbols and timeframes, making it a versatile addition to any trading strategy.


Features

  • Signal Arrows: Clearly identify Buy and Sell opportunities with optional arrows.
  • Customizable Alerts: Receive notifications on your mobile, computer, or via email for timely updates.
  • Flexible Usage: Suitable for scalping, swing trading, or as a confluence tool in strategies involving supply/demand levels or trendlines.
  • Multi-Timeframe Compatibility: Works on all timeframes from M1 to D1.
  • Symbol Compatibility: Tested with XAUUSD, BTCUSD, EURUSD, and GBPUSD across multiple timeframes.

How It Works

  • Buy Signals: A Buy signal occurs when the Yellow line crosses above the Blue line. Suggested use:

    • Place a Stop Loss below the recent swing low.
    • Close the trade when the lines cross back.
    • Optional Buy arrow confirms the signal.
  • Sell Signals: A Sell signal occurs when the Blue line crosses above the Yellow line. Suggested use:

    • Place a Stop Loss above the recent swing high.
    • Close the trade when the lines cross back.
    • Optional Sell arrow confirms the signal.

Who Is It For?

This indicator is suitable for both new and experienced traders seeking tools to complement their strategies.


Key Details

  • Updates: Regular updates to improve performance and add new features.


Important: Before using the indicator, familiarize yourself with its features and test it on demo accounts to identify how it complements your trading style.

Elevate your trading today with RoboS Indicator Version 1.5—an accessible and effective tool for market analysis.


Önerilen ürünler
DayTradingArrow v1
Nedyalka Zhelyazkova
5 (3)
Step into Confident Trading with DayTradingArrow v1 In trading, confidence comes from clarity, structure, and reliable signals . DayTradingArrow v1 is designed to give you exactly that – a tool that highlights opportunities, filters out noise, and supports smart, disciplined decisions. Every signal is confirmed and actionable , allowing you to trade with confidence rather than guesswork. Key Benefits Clear buy and sell signals for fast, confident decision-making Perfect for beginners and exper
VR Cub
Vladimir Pastushak
VR Cub , yüksek kaliteli giriş noktaları elde etmenin bir göstergesidir. Gösterge, matematiksel hesaplamaları kolaylaştırmak ve bir pozisyona giriş noktalarının aranmasını basitleştirmek için geliştirildi. Göstergenin yazıldığı ticaret stratejisi uzun yıllardan beri etkinliğini kanıtlamaktadır. Ticaret stratejisinin basitliği, acemi yatırımcıların bile başarılı bir şekilde ticaret yapmasına olanak tanıyan büyük avantajıdır. VR Cub, pozisyon açılış noktalarını ve Kâr Al ve Zararı Durdur hedef sev
SuperTrend V
Muhammad Hassaan
*This is TradingView indicator converted to mql4* The SuperTrend V indicator is a popular technical analysis tool used to identify trends and potential trend reversals in financial markets. It is based on the concept of the SuperTrend indicator but incorporates additional features and variations. The SuperTrend V indicator uses a combination of price action and volatility to determine the trend direction and generate trading signals. Here are the key components and features of the indicator: Ca
Apollo SR Master , Destek/Direnç bölgelerinde alım satımı daha kolay ve güvenilir hale getiren özelliklere sahip bir Destek/Direnç göstergesidir. Gösterge, yerel fiyat zirvelerini ve diplerini tespit ederek Destek/Direnç bölgelerini herhangi bir gecikme olmadan gerçek zamanlı olarak hesaplar. Ardından, yeni oluşan Destek/Direnç bölgesini doğrulamak için, Destek/Direnç bölgesinin dikkate alınabileceğini ve gerçek bir SAT veya AL sinyali olarak kullanılabileceğini gösteren özel bir sinyal gösterir
Trendiness Index
Libertas LLC
5 (3)
"The trend is your friend" is one of the best known sayings in investing, because capturing large trendy price movements can be extremely profitable. However, trading with the trend is often easier said than done, because many indicators are based on price reversals not trends. These aren't very effective at identifying trendy periods, or predicting whether trends will continue. We developed the Trendiness Index to help address this problem by indicating the strength and direction of price trend
Heiken Ashi Smoothed Strategy is a very simple but powerful system to get forex market trend direction. This indicator is actually 2 indicators in 1 pack, Heiken Ashi and Heiken Ashi Smoothed Moving Average both included. Because HA (Heiken Ashi) and HAS (Heiken Ashi Smoothed) are calculated in the same one system event with necessary buffers and loop only, so it is the FAST, OPTIMIZED and EFFICIENT HA having the combined indicator of MetaTrader 4. You can choose to display HA and HAS in the sam
Alpha Trend sign has been a very popular trading tool in our company for a long time. It can verify our trading system and clearly indicate trading signals, and the signals will not drift. Main functions: Based on the market display of active areas, indicators can be used to intuitively determine whether the current market trend belongs to a trend market or a volatile market. And enter the market according to the indicator arrows, with green arrows indicating buy and red arrows indicating se
Trend Guess
Harun Celik
3 (2)
The ”Trend Guess” is a complex software that does not involve the MACD, RSI or moving averages. It adapts itself to current market conditions using complicated algorithms based on price action and out custom indicators. The indicator will gives you trading signals Buy or Sell stop loss levels indicated in the popup alert window and graphically. You have to do is to press buy or sell button whenever you get a signal Important Rules Identify a current long term trend. Example – if you trade on a
Trend Osilatörü - gelişmiş bir özel Crypto_Forex göstergesi, etkili bir ticaret aracıdır! - Gelişmiş yeni hesaplama yöntemi kullanılır - "Hesaplama için fiyat" parametresi için 20 seçenek. - Şimdiye kadar geliştirilen en akıcı osilatör. - Yükselen trendler için yeşil renk, düşen trendler için kırmızı renk. - Aşırı satım değerleri: 5'in altında, Aşırı alım değerleri: 95'in üzerinde. - Bu göstergeyle standart stratejileri bile yükseltmek için birçok fırsat vardır. - PC ve Mobil uyarılarla. Yüksek
The Th3Eng PipFinite indicator is based on a very excellent analysis of the right trend direction with perfect custom algorithms. It show the true direction and the best point to start trading. With StopLoss point and Three Take Profit points. Also it show the right pivot of the price and small points to order to replace the dynamic support and resistance channel, Which surrounds the price. And Finally it draws a very helpful Box on the left side on the chart includes (take profits and Stop loss
PZ Harmonacci Patterns
PZ TRADING SLU
3.17 (6)
Trade smarter, not harder: Empower your trading with Harmonacci Patterns This is arguably the most complete harmonic price formation auto-recognition indicator you can find for the MetaTrader Platform. It detects 19 different patterns, takes fibonacci projections as seriously as you do, displays the Potential Reversal Zone (PRZ) and finds suitable stop-loss and take-profit levels. [ Installation Guide | Update Guide | Troubleshooting | FAQ | All Products  ] It detects 19 different harmonic pric
Title : Market Bias Indicator - Oscillator-Based Trading Tool Introduction : Discover the potential of the "Market Bias Indicator," a revolutionary oscillator-based trading tool designed for precise market analysis. If you're in search of a robust alternative to traditional bias indicators, your quest ends here. Market Bias Indicator offers unparalleled accuracy in identifying market sentiment and is your gateway to confident trading decisions. Recommended Trading Pairs : Market Bias Indicator i
Trend PA
Mikhail Nazarenko
5 (3)
The Trend PA indicator uses   Price Action   and its own filtering algorithm to determine the trend. This approach helps to accurately determine entry points and the current trend on any timeframe. The indicator uses its own algorithm for analyzing price changes and Price Action. Which gives you the advantage of recognizing, without delay, a new nascent trend with fewer false positives. Trend filtering conditions can be selected in the settings individually for your trading style. The indicator
EZZ Elite Zig Zag is an indicator for the MetaTrader 4 terminal. This indicator traces the peak of the trend based on the market reversal, thus showing various opportunities in the financial market. EZZ Elite Zig Zag is a visual tool, intuitive, and easy to understand and use.  Test it Yourself by Downloading it for Free. Author Paulo Rocha all rights reserved
SX Price Action Patterns is a comprehensive indicator which shows various price action patterns on the chart for those who are interested in price action trading. These patterns are as follows: A Pin Bar is a candlestick price bar, which has a long wick on one side and a small body. It is a powerful signal of price reversal in a currency trading strategy. An Inside Bar is characterized by a bar or candle that is entirely ‘inside’ the range of the preceding one and represents the consolidation o
FREE
MT4 için Crypto_Forex Göstergesi "FORCE endeksi ve 2 Hareketli Ortalama". Yeniden boyama gerektirmez. - Bu gösterge, trend yönünde momentum ticareti için mükemmeldir. - "FORCE endeksi ve 2 Hareketli Ortalama" Göstergesi, Force endeksinin Hızlı ve Yavaş Hareketli Ortalamalarını görmenizi sağlar. - Force endeksi, fiyat ve hacim verilerini tek bir değerde birleştiren en iyi göstergelerden biridir. - Force endeksi, fiyatı hareket ettirmek için kullanılan güç miktarını ölçen güçlü bir osilatördür. -
Capernaum
Andriy Sydoruk
Visually, Capernaum, on the chart, appears as small arrows indicating the direction of the trend movement and the opening of trading positions. The appearance of a blue up arrow indicates that the market is beginning to rise and it is time to buy. And the appearance of a red down arrow means that the market is falling and it is high time to sell. When a suitable moment for buying appears, the indicator generates a signal exactly at the moment of its appearance and not below or above the current
Signal trend indicator. Detects the direction of the trend and is coloured accordingly.  Has built in audible and visual alerts when trends change. Can send notifications to your phone or email. Allows Trend and Counter-Trend trading. Works on all timeframes, all currency pairs, metals, indices and cryptocurrencies. Can be used with binary options. Distinctive features No re-drawing; Simple and clear settings; Four types of alerts; Works on all timeframes and all trading tools; Suitable
Gvs Undefeated Trend   indicator is designed for trend and signal trading. This indicator generates trend signals.  It uses many algorithms and indicators to generate this signal. It tries to generate a signal from the points with the highest trend potential. This indicator is a complete trading product. This indicator does not need any additional indicators.  You can only trade with this indicator. The generated signals are displayed on the graphical screen.  Thanks to the alert features you ca
This indicator depends on High and Low price of Currency in last Week and then i made some secret equations to draw 10 lines. Features: You will know what exactly price you should enter the market . You will know when to be out of market. You will know you what should you do in market: Buy Sell Take profit and there are 3 levels to take your profit Support Resistance Risk to buy Risk to Sell Signal Types and Frame used: You can use this indicator just on H4 frame and you have to download the h
Stochastic Visual MTF for MT4
Naththapach Thanakulchayanan
This MT4 indicator, Stochastic Visual MTF, summarize the oscillator values in color graphic for both  Main and Signal in current market emotion stage which will show you in multi timeframes (9) and sum of the total Main and Signal oscillator values which is an important information for traders especially you can see all oscillator values in visualized graphic easily, You can add more by Shift, Hope it will be helpful tool for you for making a good decision in trading.
Rainbow Price Visualizer v1.21 See where the market really breathes. Turns your MT4 chart into an ultra-precise heatmap that highlights price zones favored by big players. Why it matters 300 price levels at 0.2‑pip resolution — microscopic detail. 8 visual themes (Rainbow, Fire, Ocean…) for instant readibility. Smart opacity: low noise fades, real zones pop. Lightweight rendering with automatic cleanup. Fully customizable: saturation, opacity, resolution, history depth. Bands project into the f
Fibonacci retracement and extension line drawing tool Fibonacci retracement and extended line drawing tool for MT4 platform is suitable for traders who use  golden section trading Advantages: There is no extra line, no too long line, and it is easy to observe and find trading opportunities Trial version: https://www.mql5.com/zh/market/product/35884 Main functions: 1. Multiple groups of Fibonacci turns can be drawn directly, and the relationship between important turning points can be seen
Monster Harmonic Indicator
Paul Geirnaerdt
4.59 (29)
Monster Harmonics Indicator is a harmonic pattern indicator. It recognizes Gartley, Bat, Crab, Butterfly, Cypher, White Swan, Black Swan, Shark and several other patterns. Projected patterns that are not yet completed are recognized, too. Monster even shows the PRZ (Potential Reversal Zone). Users can add their own user defined patterns to Monster. Besides the current pattern, Monster also shows all patterns in the symbols history. Monster will provide alerts for developing patterns. Introduced
[ZhiBiCCI] indicators are suitable for all cycle use, and are also suitable for all market varieties. [ZhiBiCCI] Green solid line is a reversal of bullish divergence. The green dotted line is a classic bullish divergence. [ZhiBiCCI] The solid line to the red is a reverse bearish divergence. The red dotted line is a classical bearish divergence. [ZhiBiCCI] can be set in the parameters (Alert, Send mail, Send notification), set to (true) to send instant signals to the alarm window, email, insta
TradingDesk
Christian Weilinger
4 (1)
TradingDesk – Performance Analyse MT4 To test the indicator download free Demo version here: https://www.mql5.com/en/market/product/40471 TradingDesk analysed MetaTrader 4 historical data by Symbol, Magic Number, Trade or Comment. All these evaluations will be displayed in real time on your MetaTrader 4 chart window. All this information will be displayed in the following dashboards: account info General information about the account is displayed in the account info dashboard. performance inf
Color Stochastic Enhanced Stochastic Oscillator with Cross Detection and Visual Signal Support Overview Color Stochastic is a customized version of the classic Stochastic Oscillator designed for momentum analysis and crossover visualization. The indicator provides color-based signal marking and configurable crossover detection at user-defined overbought and oversold levels. It can be used as part of: Momentum analysis Mean reversion workflows DCA-based strategies Multi-indicator confirmation sys
The indicator displays the data of the Stochastic oscillator from a higher timeframe on the chart. The main and signal lines are displayed in a separate window. The stepped response is not smoothed. The indicator is useful for practicing "manual" forex trading strategies, which use the data from several screens with different timeframes of a single symbol. The indicator uses the settings that are identical to the standard ones, and a drop-down list for selecting the timeframe. Indicator Paramet
Bu, bir mumun kapanış fiyatını tahmin eden bir göstergedir. Gösterge öncelikle D1 çizelgelerinde kullanılmak üzere tasarlanmıştır. Bu gösterge hem geleneksel forex ticareti hem de ikili opsiyon ticareti için uygundur. Gösterge, bağımsız bir ticaret sistemi olarak kullanılabilir veya mevcut ticaret sisteminize ek olarak hareket edebilir. Bu gösterge, mevcut mumu analiz ederek mumun gövdesi içindeki belirli güç faktörlerini ve önceki mumun parametrelerini hesaplar. Böylece gösterge, piyasa hareket
MasterArrow
Pavel Krysanov
5 (1)
Correct market entries and exits are essential for any Forex trader. MasterArrow indicator addresses this issue. It has no redundant elements and draws only buy/sell arrows. The up arrow is a BUY signal, while the down arrow is a SELL one. The indicator is simple to configure. Change the Strength parameter to configure the signals frequency. The product is based on standard indicators (MA, RSI, ATR, etc.). But it also features the custom algorithm allowing to combine them into a single tool and
Bu ürünün alıcıları ayrıca şunları da satın alıyor
Genesis Matrix Pro is a professional multi-timeframe trend detection indicator designed to help traders identify high-quality market alignment with clarity and structure. It combines 12 different technical indicators into one visual alignment matrix, allowing traders to quickly see when market conditions are bullish, bearish, or neutral. A signal is generated only when the selected strategies are aligned, helping reduce noise and improve decision-making. PLEASE CONTACT ME AFTER PURCHASE TO GET
The Propfolio Master Suite is the ultimate all-in-one analytical workstation for professional traders. Combining the power of the Beat The Market Maker (BTMM) methodology, Smart Money Concepts (SND/Liquidity), and Advanced Volume Profile, this suite replaces multiple different indicators with one optimized engine. Monitor up to 14 pairs simultaneously from a single chart, instantly identify market cycles, and seamlessly map institutional footprints with the click of a button. The Command Center
Scalper Inside PRO
Alexey Minkov
4.74 (69)
Scalper Inside PRO Scalper Inside PRO is an intraday trend and scalping indicator for MetaTrader 4 that uses an exclusive algorithm to quickly detect market direction and key target levels. It automatically calculates entry, exit and multiple profit targets, and shows detailed performance statistics so you can see how different instruments and strategies performed. This helps you choose the most suitable trading instruments for the current market conditions. Additionally, you can easily integrat
PRO Renko Sistemi, RENKO grafikleri ticareti için özel olarak tasarlanmış son derece hassas bir ticaret sistemidir. Bu, çeşitli ticaret araçlarına uygulanabilen evrensel bir sistemdir. Sistemi etkin piyasa sana doğru ters sinyallerine erişim hakkı denilen ses nötralize eder. Göstergenin kullanımı çok kolaydır ve sinyal üretiminden sorumlu tek bir parametreye sahiptir. Aracı, seçtiğiniz herhangi bir ticaret aracına ve renko çubuğunun boyutuna kolayca uyarlayabilirsiniz. Yazılımımla karlı bir
NAM Order Blocks
NAM TECH GROUP, CORP.
3.67 (3)
MT4 Multi-timeframe Order Blocks detection indicator. Features - Fully customizable on chart control panel, provides complete interaction. - Hide and show control panel wherever you want. - Detect OBs on multiple timeframes. - Select OBs quantity to display. - Different OBs user interface. - Different filters on OBs. - OB proximity alert. - ADR High and Low lines. - Notification service (Screen alerts | Push notifications). Summary Order block is a market behavior that indicates order collection
Öncelikle, bu Ticaret Aracının Non-Repainting, Non-Redrawing ve Non-Lagging Gösterge olduğunu vurgulamakta fayda var, bu da onu profesyonel ticaret için ideal hale getiriyor. Çevrimiçi kurs, kullanıcı kılavuzu ve demo. Akıllı Fiyat Hareketi Kavramları Göstergesi, hem yeni hem de deneyimli tüccarlar için çok güçlü bir araçtır. İleri ticaret fikirlerini, Inner Circle Trader Analizi ve Smart Money Concepts Ticaret Stratejileri gibi 20'den fazla kullanışlı göstergeyi bir araya getirerek bir araya g
Quants HL Break
Ferhat Mutlu
5 (2)
LH ve HL kesintilerini bulmak için saf fiyat eylemiyle yapılan gelişmiş hesaplama. Piyasada size büyük bir geri dönüş noktası verecektir.LH ve HL sinyalleri trengle çıkışları için de kullanılabilir. Koparma gerçekleştiğinde, güçlü bir geri dönüş olduğunu gösterir.Hareketli Ortalamalar için güzel bir filtre.Bunu trend göstergeleriyle kullanmanızı şiddetle tavsiye ederim. Destek ve direnç, arz talep göstergeleri için ekstra bir onay olarak kullanılabilir. Daha fazla ayrıntı aşağıdaki forex iş p
Dynamic Forex28 Navigator
Bernhard Schweigert
4.43 (7)
Dynamic Forex28 Navigator - Yeni Nesil Forex Ticaret Aracı. ŞU ANDA %49 İNDİRİM. Dynamic Forex28 Navigator, uzun zamandır popüler olan göstergelerimizin evrimidir ve üçünün gücünü tek bir göstergede birleştirir: Gelişmiş Döviz Gücü28 Göstergesi (695 inceleme) + Gelişmiş Döviz İMPULS ve UYARI (520 inceleme) + CS28 Kombo Sinyalleri (Bonus). Gösterge hakkında ayrıntılar https://www.mql5.com/en/blogs/post/758844 Yeni Nesil Güç Göstergesi Ne Sunuyor?  Orijinallerde sevdiğiniz her şey, şimdi yeni
RFI levels PRO
Roman Podpora
5 (1)
Bu gösterge, fiyat dönüş noktalarını ve fiyat geri dönüş bölgelerini doğru bir şekilde gösterir.       Başlıca oyuncular   . Yeni trendlerin nerede oluştuğunu görüyorsunuz ve her işlem üzerinde kontrolü elinizde tutarak, azami hassasiyetle kararlar alıyorsunuz. TREND LINES PRO   göstergesiyle birlikte kullanıldığında maksimum potansiyelini ortaya koyar.  VERSION MT5 Göstergenin gösterdiği şey: Yeni bir trendin başlangıcında aktivasyonla birlikte tersine dönüş yapıları ve tersine dönüş seviyeler
Trend Catcher ind
Ramil Minniakhmetov
TREND YAKALAYICI GÖSTERGE Trend Yakalayıcı Gösterge, yazarın tescilli ve özelleştirilmiş uyarlanabilir trend analiz göstergelerinin bir kombinasyonunu kullanarak piyasa fiyat hareketlerini analiz eder. Kısa vadeli gürültüyü filtreleyerek ve temel momentum gücüne, volatilite genişlemesine ve fiyat yapısı davranışına odaklanarak gerçek piyasa yönünü belirler. Ayrıca, hareketli ortalamalar, RSI ve volatilite filtreleri gibi yumuşatma ve trend filtreleme özelleştirilmiş göstergelerinin bir kombina
Grabber System
Ihor Otkydach
5 (2)
Size mükemmel bir teknik gösterge olan Grabber’ı tanıtıyorum. Bu araç, kullanıma hazır bir “her şey dahil” işlem stratejisi olarak çalışır. Tek bir yazılım kodu içinde güçlü piyasa teknik analiz araçları, işlem sinyalleri (oklar), uyarı işlevleri ve push bildirimleri entegre edilmiştir. Bu göstergeyi satın alan herkes aşağıdaki hediyeleri ücretsiz olarak alır: Açık emirleri otomatik yönetmek için Grabber Yardımcı Aracı Kurulum, yapılandırma ve nasıl işlem yapılacağını adım adım anlatan video kıl
Advanced Supply Demand
Bernhard Schweigert
4.91 (300)
Özel Ticaret –%40 İndirim Yeni Başlayanlar veya Uzman Yatırımcılar İçin En İyi Çözüm! Bu gösterge, bir dizi özel özellik ve yeni bir formül içerdiği için benzersiz, yüksek kaliteli ve uygun fiyatlı bir işlem aracıdır. Bu güncelleme ile çift zaman dilimi bölgeleri gösterebileceksiniz. Sadece daha yüksek bir zaman dilimini değil, hem grafik zaman dilimini hem de daha yüksek zaman dilimini gösterebileceksiniz: İÇ İÇE GEÇMİŞ BÖLGELER GÖSTERİYOR. Tüm Arz Talep yatırımcıları buna bayılacak. :) Önem
GoldRush Trend Ok Sinyali GoldRush Trend Ok Sinyali göstergesi, XAU/USD'de yüksek hızlı, kısa vadeli scalperlar için özel olarak tasarlanmış hassas, gerçek zamanlı trend analizi sağlar. 1 dakikalık zaman dilimi için özel olarak tasarlanan bu araç, net giriş noktaları için yön okları gösterir ve scalper'ların değişken piyasa koşullarında güvenle hareket etmelerini sağlar. Gösterge, PRIMARY ve SECONDARY uyarı oklarından oluşur. PRIMARY sinyalleri, trend yönündeki değişikliği gösteren Beyaz ve
Introduction to Fractal Pattern Scanner Fractal Indicator refers to the technical indicator that makes use of the fractal geometry found in the financial market. Fractal Pattern Scanner is the advanced Fractal Indicator that brings the latest trading technology after the extensive research and development work in the fractal geometry in the financial market. The most important feature in Fractal Pattern Scanner is the ability to measure the turning point probability as well as the trend probabi
Currency Strength Wizard , başarılı ticaret için size hepsi bir arada çözüm sağlayan çok güçlü bir göstergedir. Gösterge, birden çok zaman dilimindeki tüm para birimlerinin verilerini kullanarak şu veya bu forex çiftinin gücünü hesaplar. Bu veriler, şu veya bu para biriminin gücünü görmek için kullanabileceğiniz, kullanımı kolay para birimi endeksi ve para birimi güç hatları biçiminde temsil edilir. İhtiyacınız olan tek şey, işlem yapmak istediğiniz tabloya göstergeyi eklemektir ve gösterge size
ŞU ANDA %40INDIRIMLI Yeni Başlayanlar veya Uzman Tüccarlar için En İyi Çözüm! Bu Gösterge benzersiz, yüksek kaliteli ve uygun fiyatlı bir ticaret aracıdır çünkü bir dizi tescilli özellik ve yeni bir formül ekledik. Sadece BİR grafik ile 28 Forex çifti için Döviz Gücünü okuyabilirsiniz! Yeni bir trendin veya scalping fırsatının tam tetik noktasını belirleyebildiğiniz için ticaretinizin nasıl gelişeceğini hayal edin? Kullanım kılavuzu: buraya tıklayın Bu ilk olan, orijinal! Değersiz bir özent
Cycle Sniper
Elmira Memish
4.39 (36)
Please contact us after your purchase and we will send you the complimentary indicators to complete the system Cycle Sniper is not a holy grail but when you use it in a system which is explained in the videos, you will feel the difference. If you are not willing to focus on the charts designed with Cycle Sniper and other free tools we provide, we recommend not buying this indicator. We recommend watching the videos about the indiactor and system before purchasing. Videos, settings  and descri
Market Structure Patterns MT4
Samuel Manoel De Souza
5 (18)
Market Structure Patterns ,   smart money concepts   (akıllı para kavramları) temelinde geliştirilen ve   SMC/ICT   öğelerini grafik üzerinde gösteren bir göstergedir. Bu öğeler, işlem kararlarınızı bir üst seviyeye taşımanıza yardımcı olur. Grafikte bir unsur oluştuğunda, fiyat bir seviyeyi geçtiğinde veya bir kutu/bölgeye girdiğinde,   uyarılar ,   bildirimler   ve   e-posta mesajları   aracılığıyla anında bilgilendirilirsiniz. Geliştiriciler,   global variables   (küresel değişkenler) aracılı
Bu göstergeye dayalı bonus EA'yı almak için satın aldıktan sonra benimle iletişime geçin. Self Optimizing Double MA Strategy, parametre tahminlerini ortadan kaldırmak için tasarlanmış profesyonel düzeyde bir ticaret aracıdır. Yerleşik bir otomatik optimizasyon motoruyla desteklenen bu sistem, istatistiksel bir avantajı korumak için arka planda binlerce parametre kombinasyonunu simüle ederek değişen piyasa koşullarına sürekli olarak uyum sağlar. Statik ve güncelliğini yitirmiş ayarlara güvenmek
Candle Power Pro
Thushara Dissanayake
4.5 (8)
The       Mum Gücü Pro       çözmek için tasarlanmış sofistike bir ticaret aracıdır       gerçek hacim baskısı, kene verisi dengesizlikleri ve kurumsal sipariş akışı dinamikleri       ölçerek       Boğa keneleri ile ayı keneleri arasındaki savaş       gerçek zamanlı olarak. Bu gösterge ham verileri dönüştürür       hacim verilerini eyleme dönüştürülebilir içgörülere dönüştürerek   , yatırımcıların       Akıllı Para hareketleri, likidite avları ve gizli piyasa psikolojisi       her fiyat mumunun
Eğer Forex piyasasında işlem yapıyorsanız, döviz gücü ve döviz çiftleri arasındaki korelasyon hakkında ayrıntılı bilgi sahibi olmak, işlem performansınızı yeni bir seviyeye taşıyabilir. Korelasyon, riskinizi yarıya indirmenize yardımcı olurken, güç analizi kârınızı maksimize etmenizi sağlar. Bu gösterge, döviz gücü analizi ile döviz çiftleri korelasyonunu birleştirerek en uygun döviz çiftlerini seçmek için hibrit bir yaklaşım sunar. Döviz Gücü Analizi Nasıl Kullanılır Örneğin, işlem stratejiniz
Route Lines Prices - fiyat yönlerini bulmak için tasarlanmış bir göstergedir. Basit arayüzü, fiyat davranışı ve gelecekteki yön hesaplamaları için birden fazla algoritma içerir. Bu algoritmalar, kullanılan zaman dilimlerine bağlı olarak volatilite hesaplamalarını ve fiyat düzeltmesini içerir. Gösterge, " Calculating price values " değerini değiştirmek için tek bir parametreye sahiptir. Varsayılan 1 değeri, dengeli bir otomatik hesaplama sağlar, bu da göstergeyi manuel olarak yapılandırmadan kul
Master head and shoulders patterns for better trading decisions A head and shoulders pattern is a chart formation that resembles a baseline with three peaks, the outside two are close in height and the middle is highest. It predicts a bullish-to-bearish trend reversal and is believed to be one of the most reliable trend reversal patterns. It is one of several top patterns that signal, with varying degrees of accuracy, that a trend is nearing its end. [ Installation Guide | Update Guide | Trouble
Trade double tops and bottoms effectively The PZ Double Top/Bottom Indicator is a technical analysis tool that helps traders identify potential price reversal patterns in the market. These patterns, known as double tops and bottoms, are characterized by two consecutive peaks or valleys in the price of an asset. Double tops and bottoms are often seen as potential reversal patterns because they can signal a change in the direction of the current trend. [ Installation Guide | Update Guide | Troubl
Grafikleri yapılandıran ve döngüsel fiyat hareketlerini belirleyen teknik bir gösterge. Herhangi bir grafik üzerinde çalışabilirim. Birkaç çeşit bildirim var. Grafiğin kendisinde ek oklar var. Tarihe yeniden bakmadan, mumun kapanışına dair çalışmalar. M5 ve üzeri TF önerilir. Kullanımı ve yapılandırması kolay parametreler. Farklı parametrelere sahip 2 indikatörü kullanırken, bunları diğer indikatörler olmadan da kullanabilirsiniz. 2 giriş parametresi vardır Döngüsellik ve Sinyal Süresi Bu 2 pa
KuKl
IGOR KIRIANEN
The indicator is built on a non-standard Zig Zag, it draws accumulations after which if the price leaves this zone and a test of this zone occurs, then a sound signal is given and an arrow appears - after the test candle closes.The indicator does not redraw its signals, it is very easy to use, there are only three settings 1- this is the zig zag parameter 2- this is the minimum price exit from the zone 3- this is the maximum price exit from the zone. The lower the parameter for Zig Zag, the more
The Super Arrow Indicator provides non-repainting buy and sell signals with exceptional accuracy. Key Features No repainting – confirmed signals remain fixed Clear visual arrows: green for buy, red for sell Real-time alerts via pop-up, sound, and optional email Clean chart view with no unnecessary clutter Works on all markets: Forex, gold, oil, indices, crypto Adjustable Parameters TimeFrame Default: "current time frame" Function: Sets the time frame for indicator calculation Options: Can be set
ŞU ANDA %40 INDIRIMLI !!! Yeni Başlayanlar veya Uzman Tüccarlar için En İyi Çözüm! Bu gösterge benzersiz, yüksek kaliteli ve uygun fiyatlı bir ticaret aracıdır çünkü bir dizi tescilli özellik ve gizli bir formül ekledik. Yalnızca BİR grafikle 28 döviz çiftinin tümü için Uyarılar verir. Yeni bir trendin veya scalping fırsatının tam tetik noktasını belirleyebildiğiniz için ticaretinizin nasıl gelişeceğini hayal edin! Yeni temel algoritmalar üzerine inşa edilen bu sistem, potansiyel işlemlerin
Bu indikatörü satın alırsanız, Profesyonel Trade Manager’ımı  + EA   ÜCRETSİZ olarak alacaksınız. Öncelikle, bu Ticaret Sistemi'nin Non-Repainting, Non-Redrawing ve Non-Lagging Göstergesi olduğunu vurgulamak önemlidir, bu da hem manuel hem de robot ticareti için ideal hale getirir. Online kurs, kılavuz ve ön ayarları indir. "Smart Trend Trading System MT5", yeni ve deneyimli tüccarlar için özelleştirilmiş kapsamlı bir ticaret çözümüdür. 10'dan fazla premium göstergeyi birleştiriyor ve 7'den faz
Atomic Analyst
Issam Kassas
5 (6)
Öncelikle belirtmek gerekir ki bu Ticaret Göstergesi Yeniden Çizim Yapmaz, Gecikmez ve Gecikme Göstermez, bu da hem manuel hem de robot ticareti için ideal hale getirir. Kullanıcı kılavuzu: ayarlar, girişler ve strateji. Atom Analisti, Piyasada Daha İyi Bir Avantaj Bulmak İçin Fiyatın Gücünü ve Momentumunu Kullanan PA Fiyat Hareketi Göstergesidir. Gürültüleri ve Yanlış Sinyalleri Kaldırmaya ve Ticaret Potansiyelini Artırmaya Yardımcı Olan Gelişmiş Filtrelerle Donatılmıştır. Birden fazla katman
Yazarın diğer ürünleri
Follow Trend indicator ,   indicator works on Currencies , Indices ,Stocks Gold etc , good for follwoing trend on the markets suitable for scalping  Buy Rules; When the histo changes to Blue you place buy order ,stop loss just below the previous swing low Sell Rules; When the histo changes to Red you place sell order ,stop loss just below the previous swing high Trade on a timeframe which best suits your trading style
Trend Entry Levels Indicator The Entry Levels Indicator is a trend-following tool designed to assist traders by highlighting key levels for trade entries and profit-taking. It is built to support trading strategies by providing information on market trends and levels for Take Profit (TP) and Stop Loss (SL). This indicator can be used by traders of varying experience levels to enhance their market analysis. Features Non-Repainting Signals: Provides signals that remain consistent over time. Mul
Reversals   is a trading tool designed to help traders identify potential trend reversals. Suitable for all experience levels, it provides instant alerts across multiple channels, with customizable settings . Whether you’re a scalper or swing trader, Reversal Pro can be  integrated into your existing strategy. Key Features of Reversals Real-Time Alerts: Receive buy and sell signals directly via email, mobile, or desktop notifications. Non-Repaint Design: Once a signal is generated, it remains
Spot Turning Points with Ease The Catalyst Indicator is a tool designed to assist traders in analyzing potential turning points in price movements. By combining a smoothing technique with an advanced algorithm, this indicator offers signals that can support your trading analysis and decision-making. Parameters: Variable (Defaults) Cycle  14  Period  21 Drag  0.2 Computer Alerts  True Play_Sound   True Send_Email  false Send_Notification  True Signal_Bar   0 How It Works Signal Detection : Gree
Rubdfx Fiyat Takibi Fiyat fiyat bağlılığını göstermek için kullanılır, fiyat neredeyse hiç kanal dışına çıkmaz ve çoğu zaman fiyat kanal limitlerine dokunduğunda tepki verir. Satış yapabileceğiniz en yüksek ve en düşük fiyatları belirler. ve sırasıyla satın al Scalping & swing ticareti için uygun Bir mum kapandıktan sonra görünen okları çizer. Oklar, sırasıyla düşüş ve yükseliş eğilimi için yükseliş veya düşüş baskısını gösterir. Bir ok gördüğünüzde, mumun bir okla kapanıp kapanmayacağını gör
Rubdfx Spike Indikatör Rubdfx Spike Indikatör , yatırımcıların piyasa dönüşlerini ve trendlerini hassas bir şekilde belirlemelerine yardımcı olmak için tasarlanmıştır. Potansiyel yukarı veya aşağı hareketleri gösteren ani yükselişlerle ticaret fırsatlarını işaret eder. Bir satın alma veya satış sinyali oluştuğunda ve bir sonraki ani yükseliş gerçekleşene kadar tutulduğunda trend doğrulanır. Rubdfx Spike Indikatör , giriş doğrulaması için diğer teknik göstergelerle birleştirildiğinde güçlü bir ar
RubdFx Perfect Reversal , The reversal indicator is used to determine areas of support and resistance by Drawing an arrow with a level of supply and demand ( ReversalZones ). - You will catch more swings by reducing the period, and less swings if you increase period - Mobile, computer and email alerts available . it is not pushed by price which means the arrow will stay in one place,suitable for scalping and long term trading  Also Compatible with all forex paris , BUY RULES;  open a buy positio
Robos
Namu Makwembo
3.67 (3)
Big promotion on the Robos, Get yours now Robos Indicator The   ROBOS   indicator is a multi timeframe oscillator that targets the   overbought   and   oversold  regions of a price chart, a signal is indicated by the two lines crossing, compatible with all tradable instruments Latest Release The latest release is the version 4.0 #What's new in version 4.0 ? Features Extreme oversold and overbought levels ROBOS version  4.0  comes with cool new feature , the ability to target only extrem
RUBFX Trend histo mt5 ,   indicator works on synthetic indices, Currencies , Indices ,Stocks Gold etc , good for follwoing trend on the markets suitable for scalping  Buy Rules; When the histo changes to Blue you place buy order ,stop loss just below the previous swing low Sell Rules; When the histo changes to Red you place sell order ,stop loss just below the previous swing high Trade on a timeframe which best suits your trading style
Holiday Sales Zones Indicator The Zones Indicator is your everyday Trading tool that  leverages advanced algorithms, including ICT institutional concepts like order blocks , engulfing candle patterns , and Level interactions , to identify critical levels of supply and demand (Resistance & Support). Visual signals are generated and clearly marked on the chart, providing a straightforward guide for traders to spot key opportunities. Key Features Advanced Algorithmic Analysis : Identifies supply
Trend Assistant Indicator: Your Comprehensive Market Trend Analysis Tool The Trend Assistant Indicator is an advanced and versatile tool designed to help traders analyze market trends across multiple timeframes. By combining RSI, Stochastic, and CCI indicators, it provides valuable insights into market bias, supporting traders in making informed decisions. With its user-friendly interface and clear visual signals, the Trend Assistant Indicator simplifies the process of identifying market sentime
The Rubdfx swing indicator is a useful tool for traders looking to identify trend changes in a particular instrument they are trading. It is designed to draw a line on the main chart, and the signals are indicated by color changes with signal alerts. The color green is used to indicate a bullish trend, while the color pink is used to indicate a bearish trend. These colors can be customized to fit the trader's preferences or theme. The Rubdfx swing indicator has the ability to spot both long-ter
The rubdfx divergence indicator is a technical analysis tool that compares a security's price movement. It is used to identify potential changes in the price trend of a security. The indicator can be applied to any type of chart, including bar charts and candlestick charts. The algorithm is based on MACD, which has been modified to detect multiple positive and negative divergences. Settings  ___settings___ * fastEMA * slowEMA * signalSMA *Alerts:   True/False     #Indicator Usage Buying :
Bobot AI
Namu Makwembo
Bobot AI is a sophisticated automated forex trading program that utilizes advanced algorithms to analyze market data and make predictions about future price movements. Our system is designed to quickly identify patterns and trends in the market, allowing you to make informed trading decisions. With automatic trade execution and a risk management strategy in place, Bobot AI empowers you to trade with confidence and ease Our focus is on helping traders make better-informed decisions and providing
Filtrele:
Değerlendirme yok
Değerlendirmeye yanıt