AIS Money Management MT5
- Yardımcı programlar
- Sürüm: 2.0
- Güncellendi: 23 Mayıs 2019

The script is based on the simulation of trade transactions using a random number generator. This allows you to get completely different
results, even with the same input parameters. When you run the script, a dialog box opens in which you can set the desired values for
external variables.
In the Trading options block, the basic parameters that are necessary for trading modeling are defined.
- Start Balance - sets the initial size of the trade balance.
- Number Trade - sets the number of trade transactions that will be modeled when the script is running. In order to get more or less significant results, it is necessary that this parameter be greater than 30.
- Probability Winning - the probability of a winning trade. Indicated as a percentage, valid value from 1 to 99.
- Min. StopLoss - indicates the minimum StopLoss value in points, which will be used when modeling trading operations.
- Max. StopLoss - sets the maximum value of StopLoss in points.
- Positive Win. - this variable establishes the amendment, with the help of which a positive expectation is obtained in the simulated transaction.
The job of the script is to do the following. First, the expected probability of a winning trade is calculated - PW. After that, randomly set
the value of StopLoss, which will be used in this transaction. Considering that the expected payoff should be positive, the TakeProfit
size is calculated. Taking into account the pip value, the TakeProfit and StopLoss levels are converted to the values of possible
profit and loss - Profit and Loss. In conclusion, the result of the transaction is determined - the win (“1”) or loss (“-1”). All data is
stored in the SpecificationsTrade.csv file in the last line of which indicates the total amount of winnings in this series of
transactions.
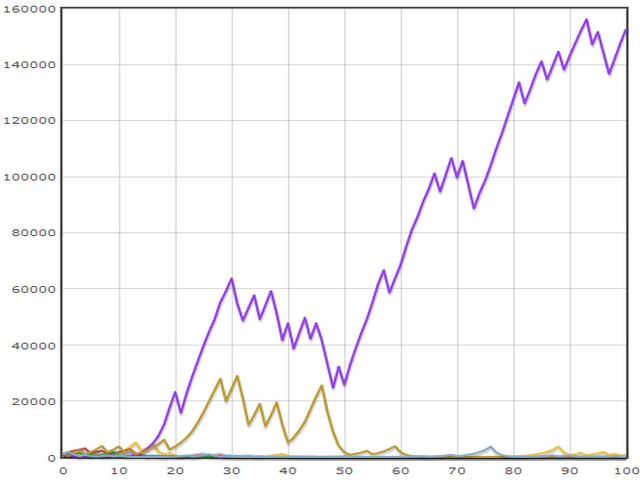
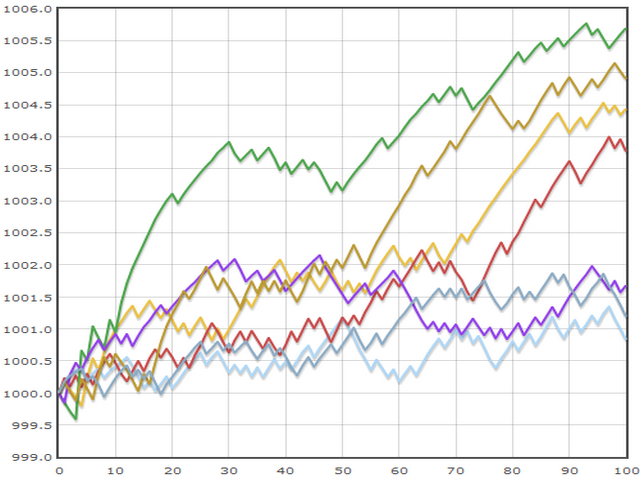
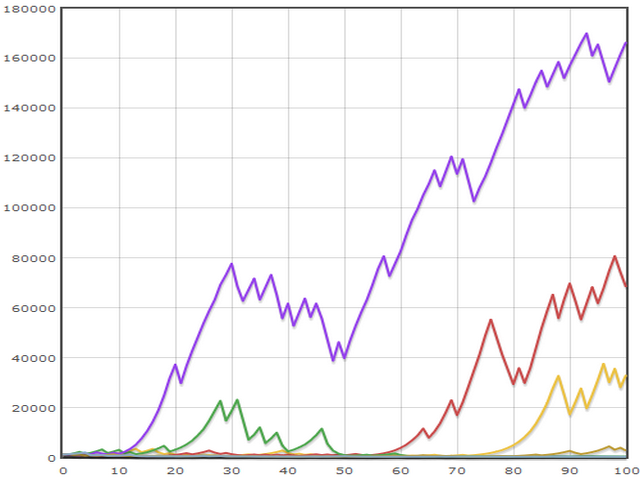
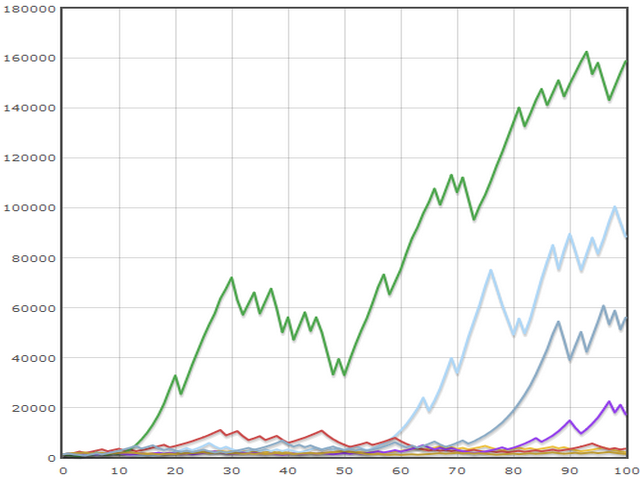
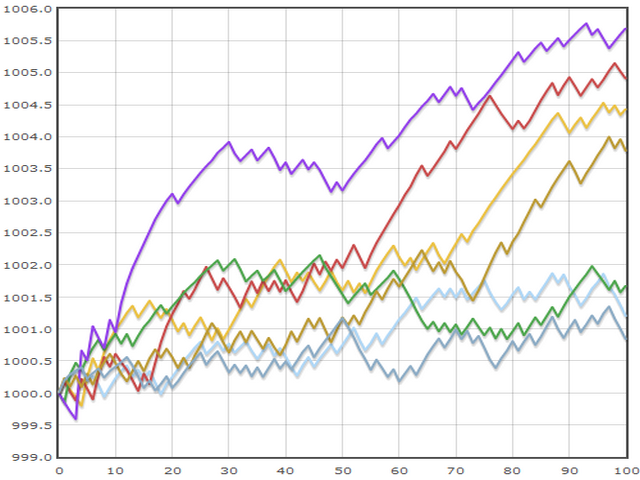
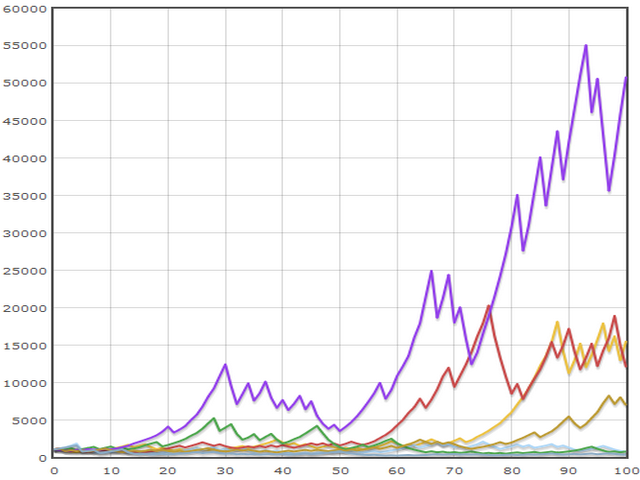
The resulting transaction values are transferred to the Money management systems block, where you can select the
money management systems of interest.
- Fixed Lot - trade in a fixed lot. The results are stored in the file "FixedLot.csv". The “Bal.” Column indicates the value of the trade balance before opening a trade, and the “Rez” column indicates its result.
- Fixed Percentage - fixed percentage trading. The simulation results are recorded in the file "FixedPercentage.csv". In the “Bal.” Column, the balance value is stored, in the “Lot” column - the lot size during the transaction, and in the “Rez” column - its result.
- Moral Expectation - trade based on moral expectations is modeled. When modeling transactions, restrictions on the required number of transactions and the size of the trade balance are not taken into account. Due to this, it is possible to more accurately select the parameters of the trading system for trading with this money management system. The results are recorded in the file “MoralExpectation.csv”.
- Theory Perspective - trading with the use of money management according to the theory of prospects.
- Frac. Linear Growth - trade modeling using fractional linear growth.
- Linear Growth - trading using the linear growth model.
- Power Growth - modeling of power growth in trade.
- Exponential Growth - application of the model of exponential growth.
- Hyperbolic Growth - shows trading when using the hyperbolic growth model.
- Hyperbolic Exponential Growth - models the use of hyperbolic-exponential growth.


Kullanıcı değerlendirmeye herhangi bir yorum bırakmadı