Elder Force Zones
- Göstergeler
- Sürüm: 1.0

MetaTrader's built-in Force Index is not the formula Dr. Alexander Elder published. It multiplies the volume of a bar by the change of a 13-bar moving average of price. Elder defined the force of a bar as its volume times the change of its close, and smoothed that with an exponential moving average. Measured on gold over the last year, the two disagree about which side of zero the market is on roughly one bar in six (M15, H1 and H4).
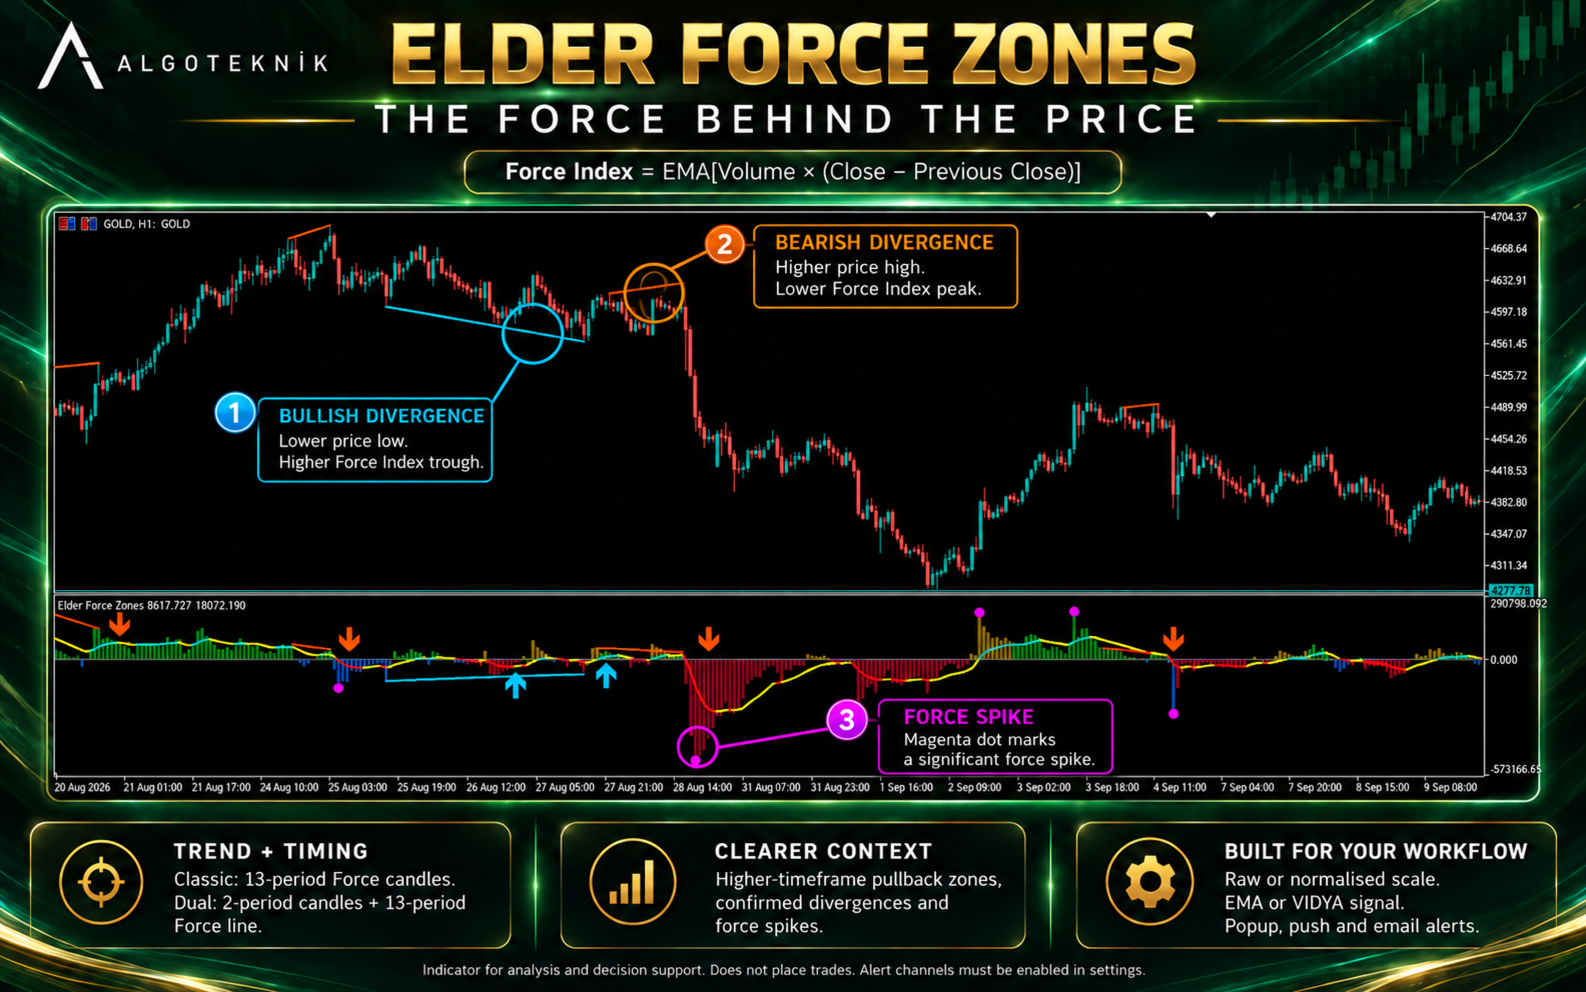
Elder Force Zones computes Elder's own definition and builds his way of working around it: the 13-bar Force Index for the trend of force, the 2-bar Force Index for timing in the Dual view, and the buy and sell zones it is named after, pullbacks judged against the trend of the next higher timeframe (the Triple Screen). On top of that it marks force spikes and divergences on closed bars and can alert on them.
Release notes, chart examples and new product announcements are posted on the TrendTower channel: https://www.mql5.com/en/channels/trendtower
What you see
In the default Classic view the candles are the 13-bar Force Index: who has been in control, and how hard. The thick line over them is the signal line, an EMA or VIDYA of the 13-bar Force Index; a crossing of the two marks a turn. The Dual view adds Elder's pair: the candles become the 2-bar Force Index, who pushed hardest in the last bar or two, and the 13-bar Force Index is drawn as a line of its own, with the signal line under it.
Line colours offers three looks. The default is a traffic light. Green: the line rises, or runs above its signal, with buyers in control, at or above zero. Red: it falls, or runs below its signal, with sellers in control, at or below zero. Both confirm the side in control. Yellow: the two disagree, rising while still below zero or falling while still above it, a caution that the force is heading back toward zero. In the Classic view the signal line carries the colour (for an EMA or VIDYA the Force Index above the signal is the signal rising); in the Dual view the Force Index line carries it, judged against its signal line, and the signal line is silver. The colour changes on the very bar of a crossing. Measured on gold, EURUSD and the Nasdaq (M15 to H4), yellow covers 50 to 60 % of the Classic signal line's bars and 30 to 44 % of the Dual Force Index line's: a line swinging around zero spends about half its time heading back to it. Colour by slope, signal gap widened: the Dual Force Index line follows the same traffic light by its own slope, grey while flat, and the dotted silver signal line is drawn with its distance to the Force Index widened 2.5 times, so a crossing stays on its bar but the drawn signal line no longer sits at its own value and can appear on the other side of zero. One colour each: a gold Force Index line and a silver signal line. The numbers at the top of the window and in the Data Window always show the signal line's own value.
The zero line is a solid line in the colour set on the Inputs tab; None hides it.
Each bar is a candle body drawn from zero to the Force Index value, so it widens and narrows with the chart zoom exactly like the price candles above it. The candles are green above zero and red below it. With the trend colouring on, two more colours mark the bars that matter most in Elder's method: blue for a buy zone and orange for a sell zone. The next section explains what to do with them.
MetaTrader draws indicator colours without transparency, so the candle colours are mixed toward the chart background instead. At the default Candle opacity of 55 %, measured on a black chart against the brightest candle (orange), green keeps 4.3 to 1 contrast, yellow 5.4, gold 4.2 and silver 3.2. Solid red keeps 1.45 against orange and 2.8 against the red candles it mostly runs over below zero; the slope look's green keeps 2.75 and its flat grey 1.06. Lower the opacity for stronger lines, raise it for stronger candles. The four candle colours are set on the Inputs tab.
The bar that is still forming is drawn live and changes with every tick until it closes. Markers and alerts wait for the close, so a marker that has appeared never moves or disappears.
The numbers after the name at the top of the indicator window are, in order: the Force Index line (Dual view only), the signal line and the candle's value. A switched-off signal line leaves out its number.
Reading the colours: buy zones and sell zones
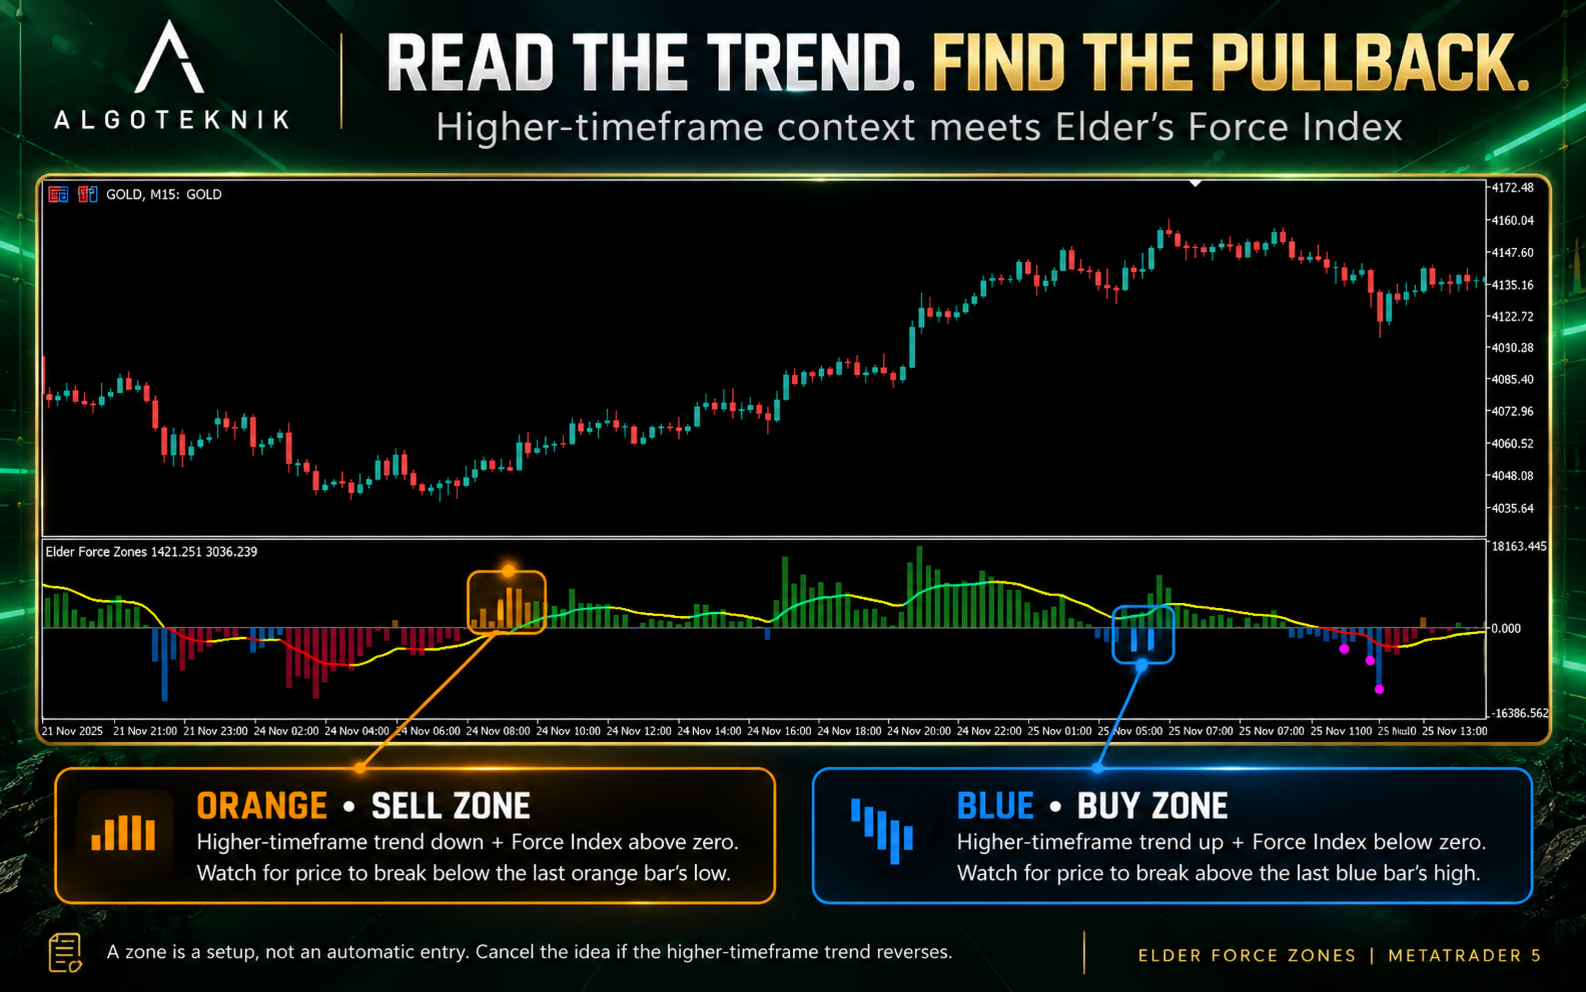
Blue is a buy zone and orange is a sell zone. A bar turns blue when the trend on the higher timeframe is up and the candle has dipped below zero: sellers are briefly in control inside an uptrend, which is a pullback. A bar turns orange in the mirror case, a rally inside a downtrend. These are the bars Elder trades, not the ones he avoids: the higher timeframe tells you which way to trade, and the pullback offers a better price in that direction.
A colour is not an entry on its own. A pullback can deepen, and several blue bars in a row are common. Elder's entry waits for the market to turn: a buy stop just above the high of the last blue bar, lowered to the high of each new blue bar while the pullback lasts, so a position opens only once price moves back in the direction of the trend. If the higher timeframe turns down first, the idea is dropped. Orange works the same way downwards: a sell stop just below the low of the last orange bar.
Green bars in an uptrend and red bars in a downtrend show the trend pushing; Elder does not chase them. Selling on blue or buying on orange would trade against the higher timeframe and is not part of the method. With the trend colouring switched off the candles are only green and red and mark no zones.
The indicator shows where the method looks for trades. It does not place trades, and it does not claim that the method is profitable on any market.
The trend, from the timeframe above
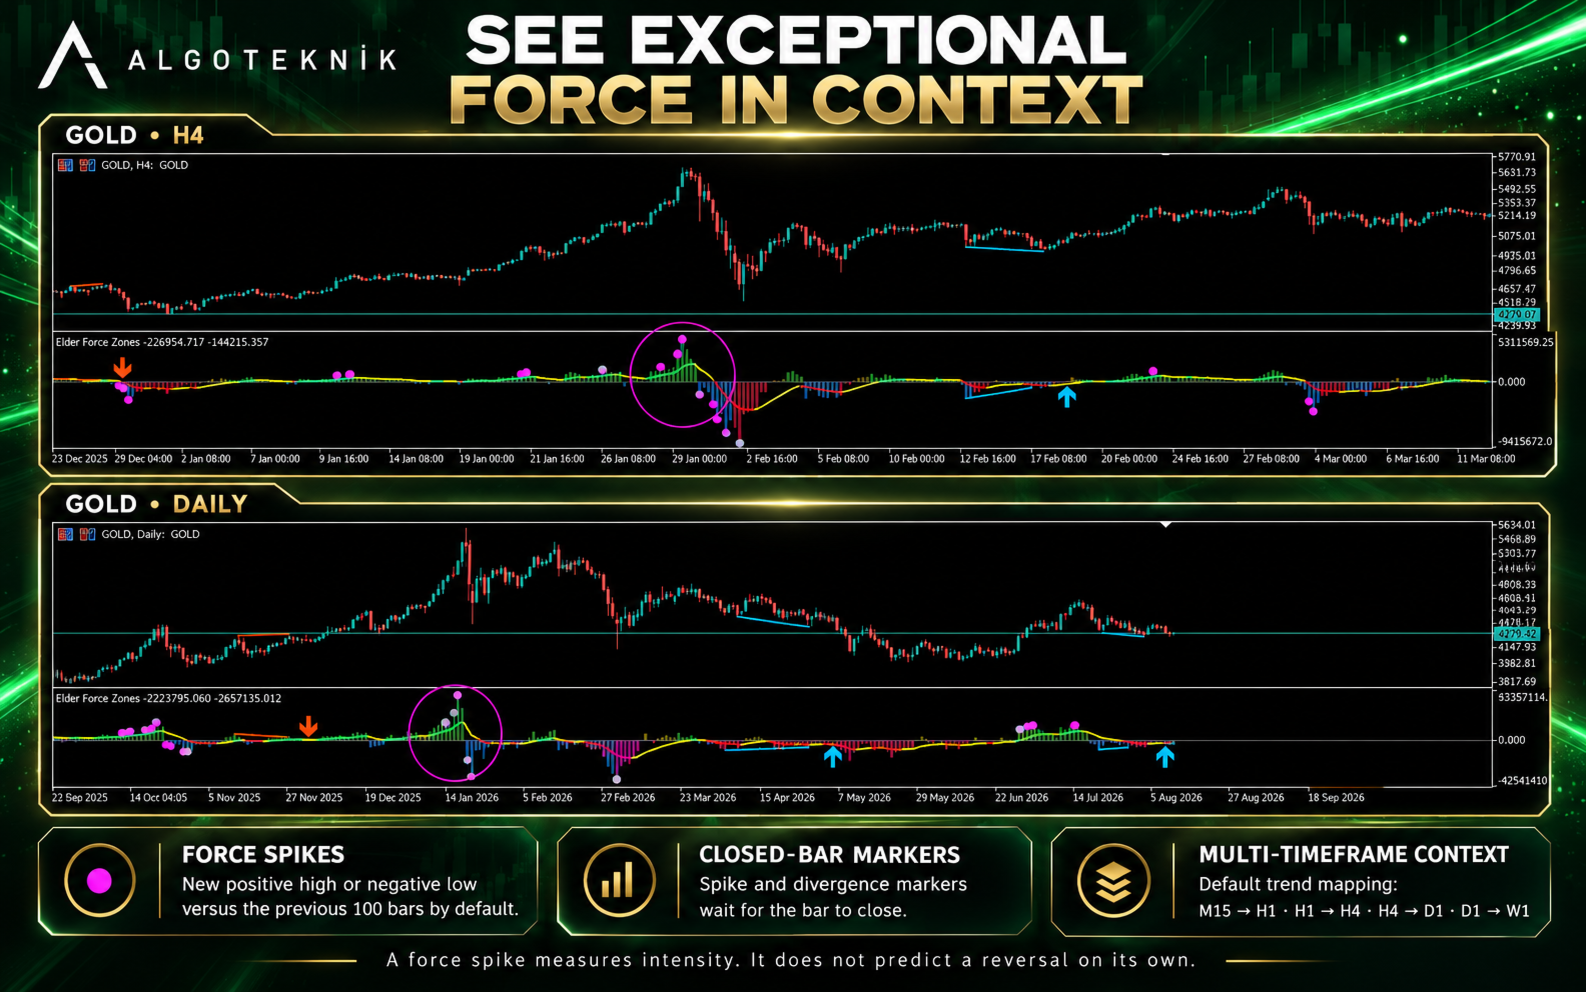
Elder's Triple Screen reads the trend on a timeframe about five times longer than the one you trade and takes entries against short-term moves in that direction. By default the indicator does the same: on M15 the trend comes from H1, on H1 from H4, on H4 from D1 and on D1 from W1. The trend is the slope of a 13-period EMA of closes on that timeframe.
Each bar takes the trend of the last higher-timeframe bar that had already closed when the bar opened. The colour of a bar therefore never changes while it forms, and history shows exactly what was known at the time. While the higher timeframe's history is still loading the colours stay plain, the journal says so, and the history is recoloured once it arrives.
The first bar of a buy or sell zone can raise an alert. With the trend from the next higher timeframe a zone starts on one bar in 11 to 17 in the Classic view and one in five to seven in the Dual view, whose 2-bar Force Index changes sign often (measured on gold, EURUSD and the Nasdaq, M5 to H4). That suits the chart but is frequent for an alert, so this alert is off by default.
Force spikes
A spike is a closed bar whose candle goes beyond every candle of the previous 100 bars: a new high above zero or a new low below zero, compared on the raw values so that both scales mark the same bars. It shows where buying or selling was at its most intense; on its own it does not predict a reversal. Because the test is a rank and not a fixed number, it behaves the same on every market: on gold, EURUSD and the Nasdaq about three bars in a hundred were marked on M15, H1 and H4 in the Classic view and four to five on M5; the Dual view's 2-bar candles mark about two in a hundred, three on M5.
Divergences
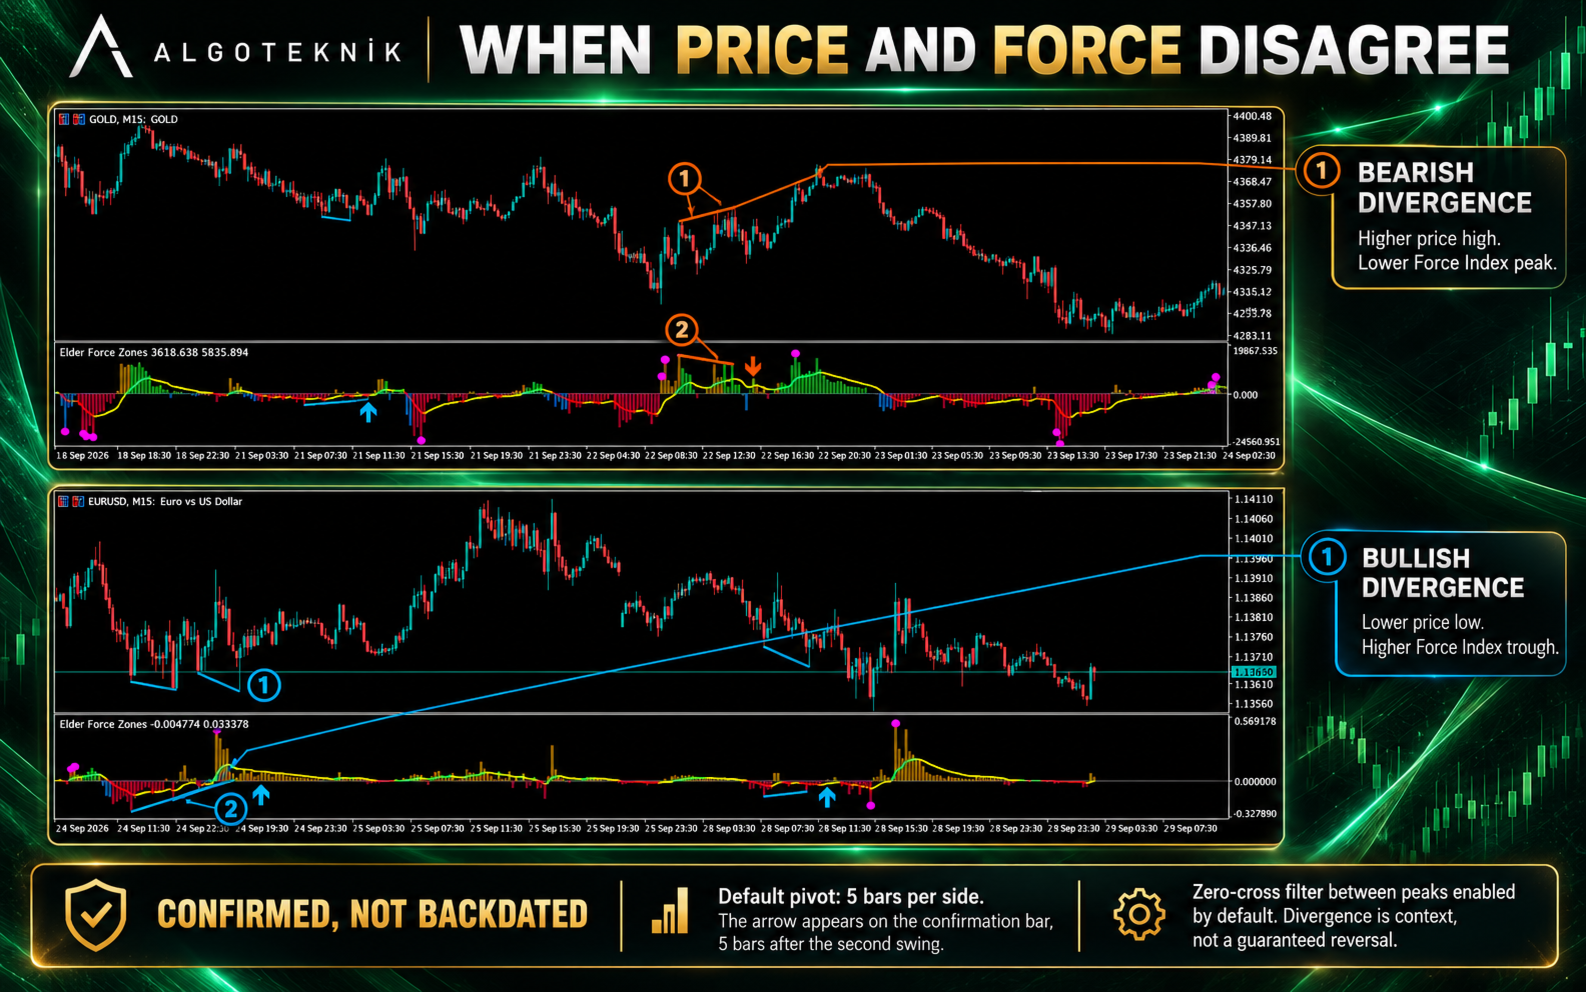
A bearish divergence is a higher swing high in price with a lower peak of the 13-bar Force Index; a bullish one is a lower swing low with a higher trough. A swing high needs five lower highs on its left and no higher high among the five bars on its right, so a divergence is known five bars after its second swing. The arrow sits on that confirming bar, not earlier, and two thick lines connect the price swings and the Force Index extremes. The arrows are large and drawn clear of the bar's candle and lines, above it for a bearish divergence and below it for a bullish one, so they stand on the background. Their two colours are set on the Inputs tab.
By default the Force Index must also cross zero between the two peaks, the condition Elder applies to his oscillator divergences: the bulls' or bears' back has to be broken. It halves the number of signals, measured at 7 to 11 per 1000 bars instead of 16 to 22.
Raw or normalised numbers
Raw values are volume times price change, the numbers Elder used. Their size depends on the symbol and drifts with activity: on gold the typical H1 value grew about ten times in three years, and EURUSD and the Nasdaq differ by five orders of magnitude. The normalised scale divides by the average volume and the average true range of the previous 100 bars, so 1.0 means an average-volume bar moving one average range, on any symbol and in any year. Colours, markers and alerts are identical in both scales; only the numbers on the axis change.
Alerts
Alerts can be sent as a popup, a push notification and an e-mail, each switched on separately. They come once per closed bar and never for a bar that closed before the indicator was attached, so attaching it or restarting the terminal does not replay old signals. Divergence alerts are preselected; the channels are all off until you choose one.
Things that work without a setting
Every line appears only once it no longer depends on how much history the chart holds. An exponential average remembers its starting point, and a chart with 5000 bars would otherwise show different values from one with 100000. The indicator waits until that memory is below one part in a billion: about 150 bars after the first bar on the chart for the 13-bar Force Index, about 280 for the EMA signal line, and 600 to 2900 for a VIDYA signal line. After that the same bar shows the same value on every chart and after every restart.
Most CFD and forex symbols report no real volume. When real volume is selected and the last 100 bars carry none, the indicator uses tick volume instead of drawing a flat line, writes that in the journal and in its name on the chart.
The normalised scale uses the bars before the current one, so it does not move while a bar forms.
The newest 100 divergences keep their arrows and lines. If another copy of the indicator on the same chart removes them, they are redrawn within a second.
Hovering over a divergence arrow or line shows its sentence and nothing else. Over the candles, the lines and a spike MetaTrader adds the indicator's name and the bar's time, and ends the row with the value: the number after the label is that candle's or line's Force Index. The Data Window lists the values under the same short names.
A chart or template saved with an older version can restore the indicator with fewer lines than it has; the missing ones cannot be drawn and their settings seem to do nothing. The indicator notices this and says so in orange in its own window. Remove it from the chart, add it again, and save your templates again.
For Expert Advisors
Buffers 0 to 3 are the candle (open 0, high, low, and close, which is the Force Index value) and buffer 4 its colour index (0 green, 1 red, 2 blue buy zone, 3 orange sell zone). Buffer 5 is the signal line as drawn and buffer 6 its colour index; buffer 7 is the Force Index line of the Dual view and buffer 8 its colour index. Both colour indexes read 0 green (above the signal or rising, at or above zero), 1 red (below or falling, at or below zero), 2 one colour or flat, 3 yellow (the direction against the line's side of zero). Buffer 9 is the spike marker, buffers 10 and 11 the bullish and bearish divergences (the Force Index at the confirming bar; not drawn, the arrows are chart objects), buffer 12 the Force Index line's value, buffer 13 the signal line's own value and buffer 14 the candles' value on its own. Read the signal from buffer 13: with slope colours buffer 5 is widened for the eye. Where nothing is drawn a buffer holds EMPTY_VALUE. Shift 0 is the bar that is still forming; markers exist only on closed bars, so read shift 1. When you pass inputs to iCustom, each input group heading counts as one parameter: give a string for the heading, then the values that follow it.
Settings reference
Every setting below is written exactly as it appears on the Inputs tab, in the same order, with its default.
1. FORCE INDEX
Display mode — default: Classic: Force Index as candles
Classic: the Force Index as the candles. Dual: the short Force Index as the candles and the Force Index as a line, Elder's pair. The signal line is drawn in both.
Force Index period (Elder: 13) — default: 13
EMA period of the Force Index; 13 is Elder's value for the trend of force. The line in Dual, the candles in Classic. 1 to 500.
Short Force Index period, Dual mode (Elder: 2) — default: 2
EMA period of the short Force Index in Dual mode; 2 is Elder's value for timing. Smaller than the Force Index period, 1 to 50.
Volume — default: Tick volume
Tick volume or real volume. Without real volume on the symbol, tick volume is used and the name on the chart says so.
Scale — default: Raw: volume x price change
Raw: volume times price change. Normalised: 1.0 is an average-volume bar moving one average range. Colours, markers and alerts are the same in both.
Normalised scale: average over this many bars — default: 100
Bars averaged for the normalised scale, not counting the current bar. 5 to 1000.
Draw the forming bar live — default: true
On: the forming bar is drawn and changes with every tick. Off: a bar appears when it closes. Markers and alerts always wait for the close.
2. CANDLES
Candle colour: buyers in control (above zero) — default: LimeGreen
Candles above zero when no zone applies.
Candle colour: sellers in control (below zero) — default: Crimson
Candles below zero when no zone applies.
Candle colour: buy zone (pullback in an uptrend) — default: DodgerBlue
Candles below zero while the higher timeframe rises.
Candle colour: sell zone (rally in a downtrend) — default: Orange
Candles above zero while the higher timeframe falls.
Candle opacity, % (lower lets the lines stand out) — default: 55
How strongly the candle colours show, mixed toward the chart background. 55 keeps the lines readable on a black chart. 10 to 100.
3. LINES
Line colours — default: Traffic light: crossings, yellow against zero
Traffic light: green rising above zero, red falling below zero, yellow when the direction is against the line's side of zero; the Classic signal line or the Dual Force Index line carries it. Slope: the same by the line's own slope, grey flat, with the dotted signal line's distance widened 2.5 times. One colour: gold line, silver signal line.
Zero line colour (None hides it) — default: DimGray
Colour of the solid zero line; None hides it.
4. SIGNAL LINE
Signal line method — default: EMA (Exponential Moving Average)
EMA or VIDYA of the Force Index, drawn as the thin signal line in both views; none hides it. On the Force Index a VIDYA runs much slower than its period suggests: VIDYA 13 behaves like an EMA of about 75 bars in the median.
Signal line period (VIDYA: up to 20) — default: 13
EMA 1 to 500, VIDYA 1 to 20: a longer VIDYA forgets its start so slowly that its line would depend on how much history the chart holds.
5. TRIPLE SCREEN TREND
Colour buy and sell zones (pullbacks within the trend) — default: true
Blue marks a buy zone (below zero while the higher timeframe rises), orange a sell zone (above zero while it falls). Off: only green above zero and red below.
Trend timeframe — default: Next higher timeframe (Elder: about x5)
Next higher: M15 to H1, H1 to H4, H4 to D1, D1 to W1 and so on. A timeframe that is not above the chart's uses the chart's own.
Trend EMA period, on closes — default: 13
EMA of closes on the trend timeframe; up while it rises, down while it falls. 2 to 500.
6. FORCE SPIKES
Mark force spikes — default: true
Marks a closed bar whose candle is a new high above zero or a new low below zero compared with the spike window.
Spike: new high or low of the candles over this many bars — default: 100
Bars a spike is measured against; 100 marks about three bars in a hundred in the Classic view. 10 to 1000.
7. DIVERGENCE
Mark divergences — default: true
Arrows on the bar that confirms a divergence between price swings and the Force Index.
Pivot: bars on each side — default: 5
A swing needs this many bars on each side, so a divergence is known this many bars after its second swing. 1 to 20.
Max bars between the two pivots — default: 60
The two swings are at most this many bars apart; more than twice the pivot bars, at most 500.
Force Index must cross zero between the peaks (Elder) — default: true
The Force Index must cross zero between the two peaks. Halves the number of divergences.
Draw divergence lines — default: true
Two lines per divergence, on price and on the indicator. The newest 100 are kept.
Divergence colour: bullish — default: DeepSkyBlue
Arrow and lines of a bullish divergence.
Divergence colour: bearish — default: OrangeRed
Arrow and lines of a bearish divergence.
8. ALERTS (ON CLOSED BARS)
Alert when a buy or sell zone starts — default: false
The first bar of a buy zone or a sell zone.
Alert on a divergence — default: true
A divergence is confirmed.
Alert on a force spike — default: false
A force spike on a closed bar.
Alert when the Force Index crosses zero — default: false
The Force Index crosses zero.
Alert when the Force Index crosses the signal line — default: false
The Force Index crosses its signal line.
Popup — default: false
Alert window in the terminal.
Push notification — default: false
Push notification to the phone set in Tools > Options > Notifications.
E-mail — default: false
E-mail through the account set in Tools > Options > Email.
Version history
1.0: first release.
About the author
Published by algoteknik. Other products and contact details are on the seller profile: https://www.mql5.com/en/users/bugraky123
Questions, bug reports and feature requests are welcome on the TrendTower channel: https://www.mql5.com/en/channels/trendtower
This is an indicator for analysis and decision support. It does not place trades. Always test thoroughly before using any tool in live trading. Trading involves risk.
algoteknik
Support, updates and every other product: mql5.com/en/users/bugraky123
Product channel: mql5.com/en/channels/trendtower
Elder Force Zones version 1.0