Refine OBV
- Göstergeler
- Sürüm: 1.0

Refine OBV
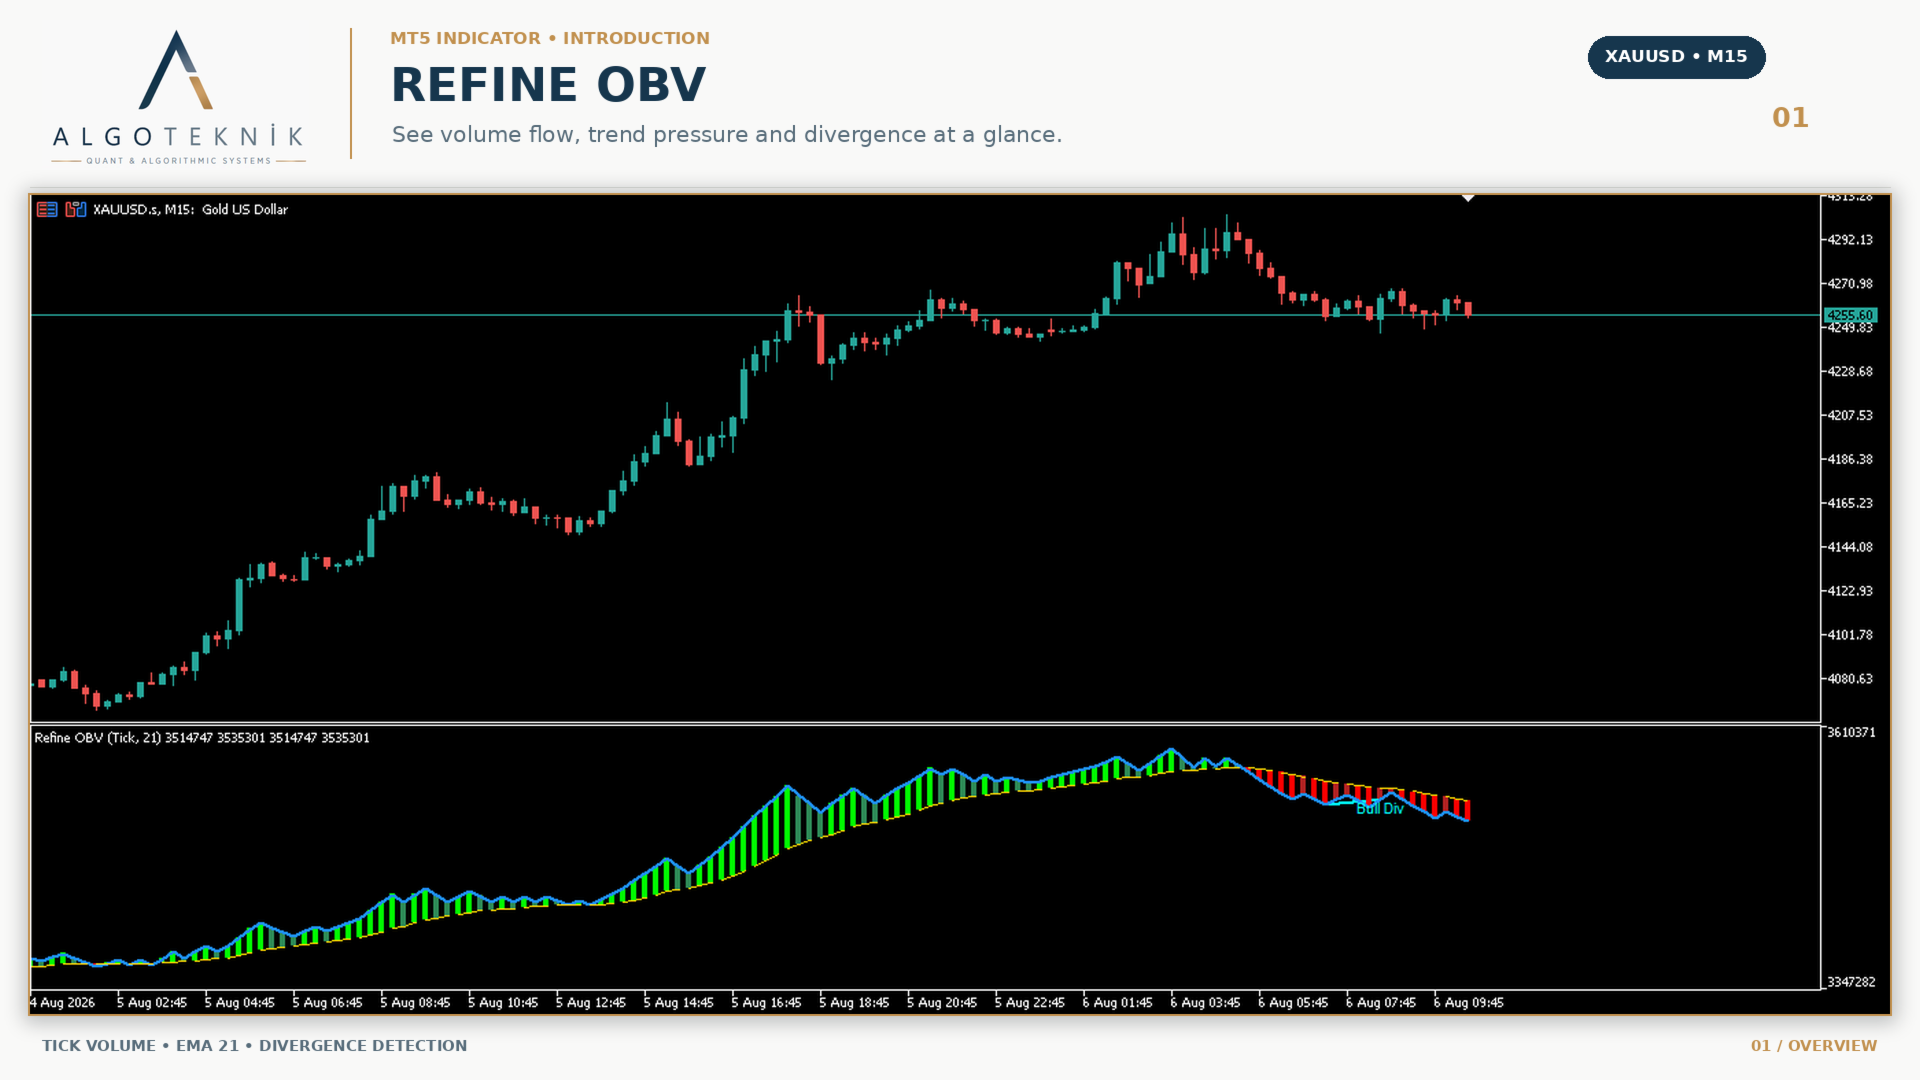
Refine OBV measures cumulative volume flow read against its own adaptive signal line with a color-coded spread and non-repainting divergence detection.
Raw On Balance Volume answers one question: is volume being credited to the buyers or the sellers? While useful, raw OBV is a single wandering line with no reference point. Refine OBV adds an adaptive EMA of the flow itself as a reference line. The distance between the flow and its signal line (the spread) is rendered as a color-coded cloud, allowing you to see at a glance which side holds the flow and whether that conviction is building or fading.
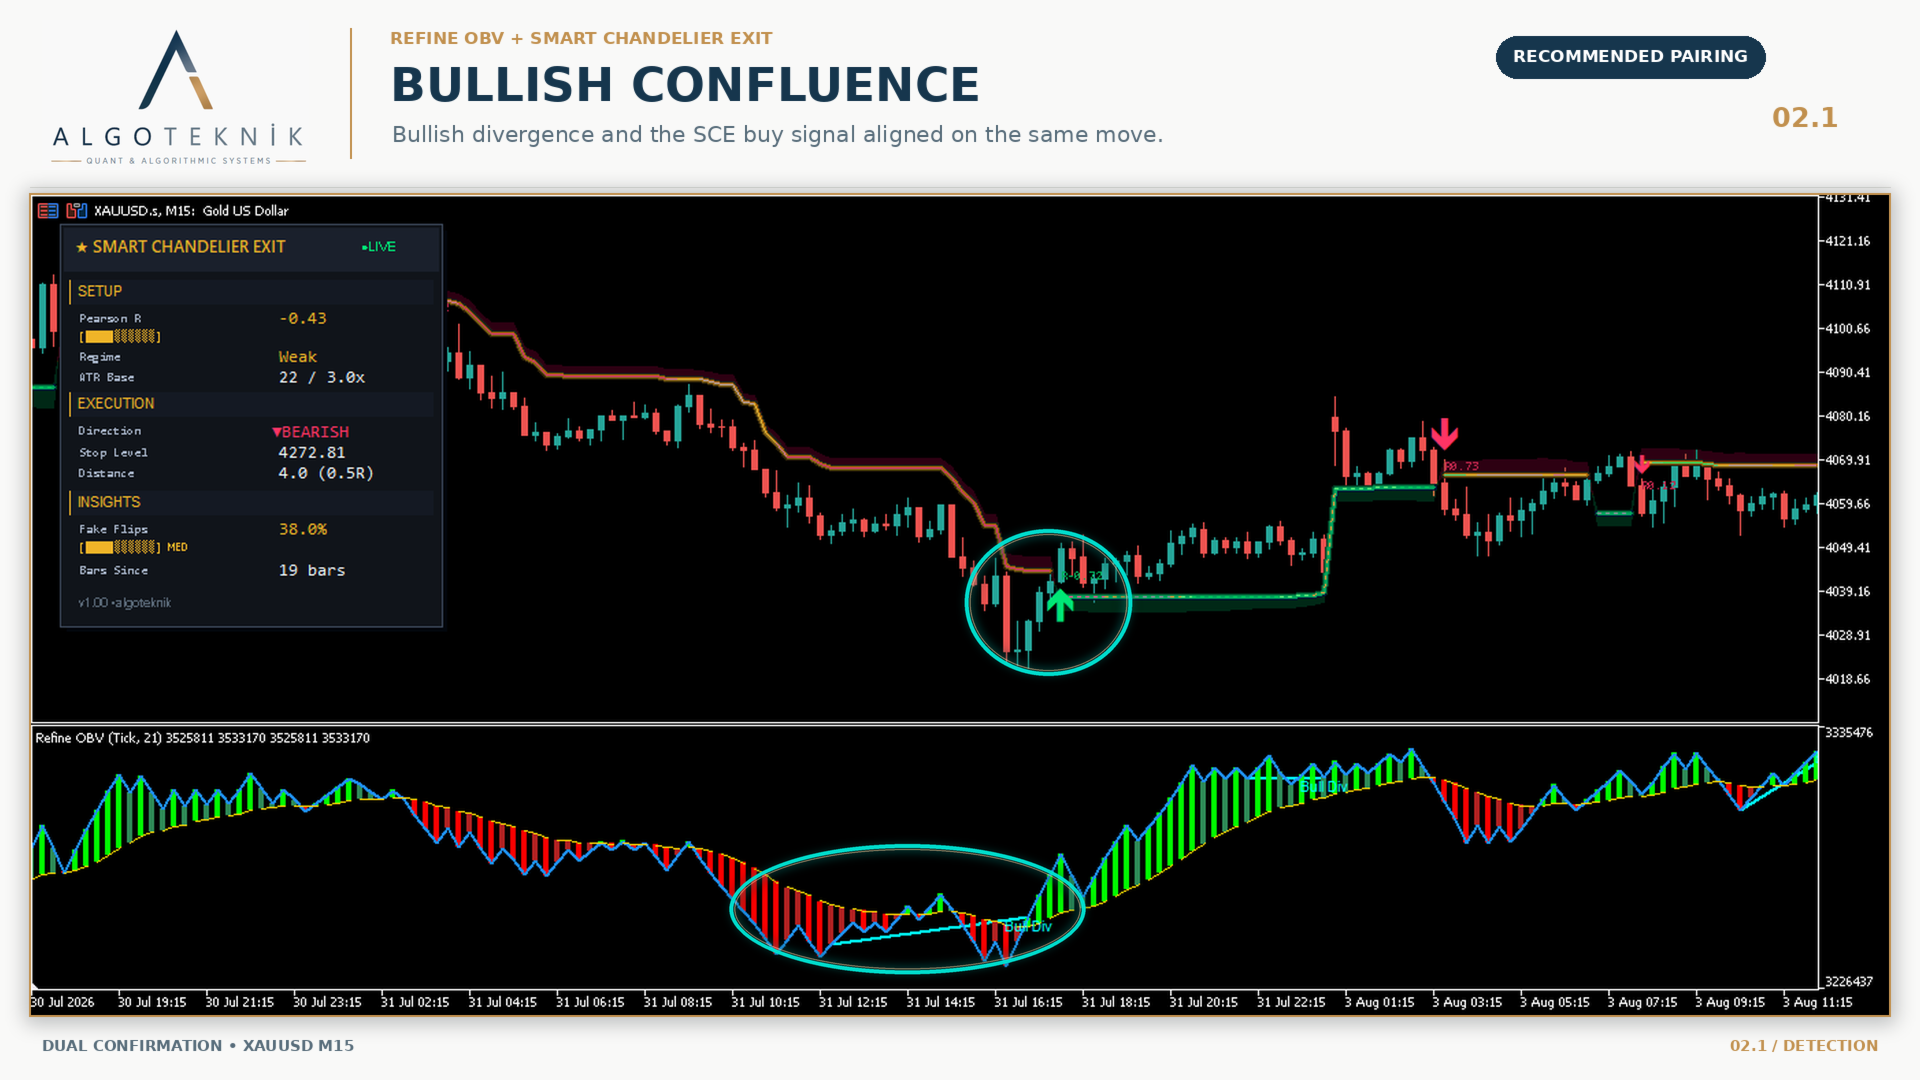
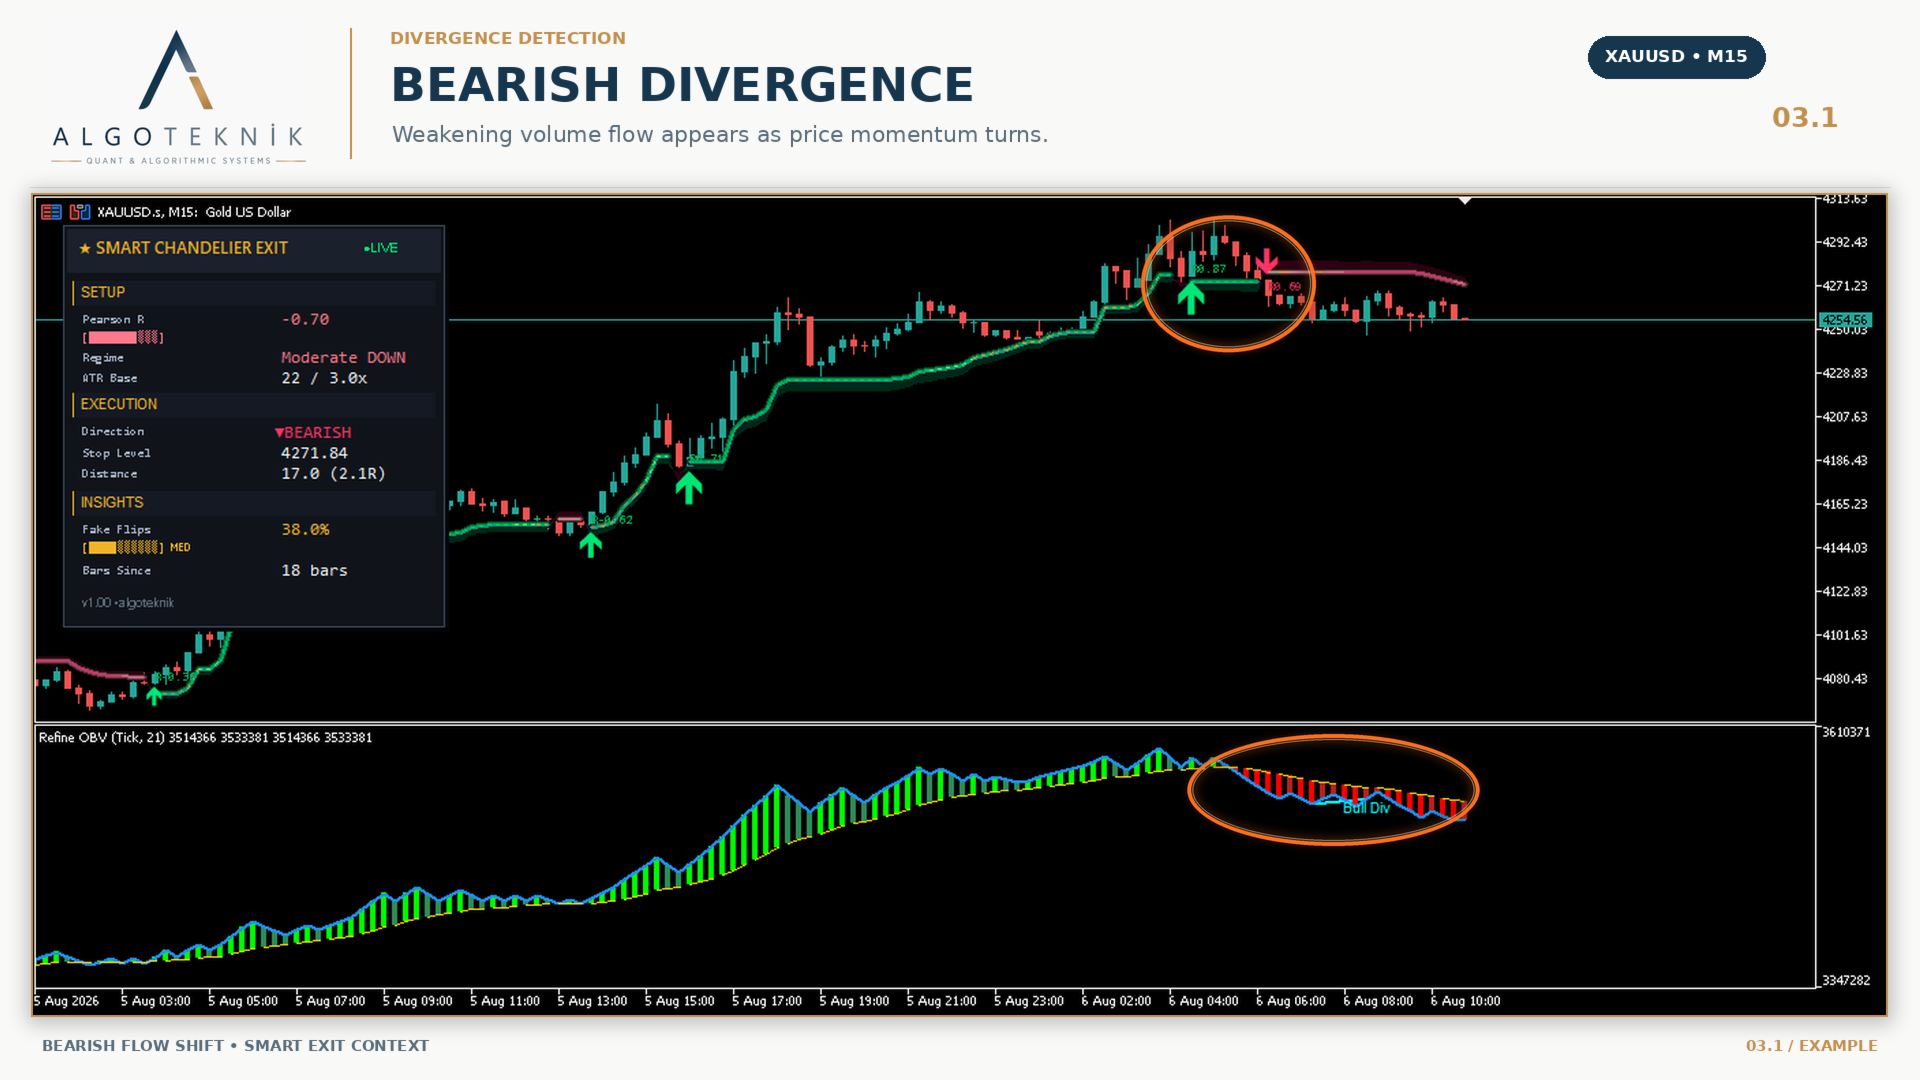
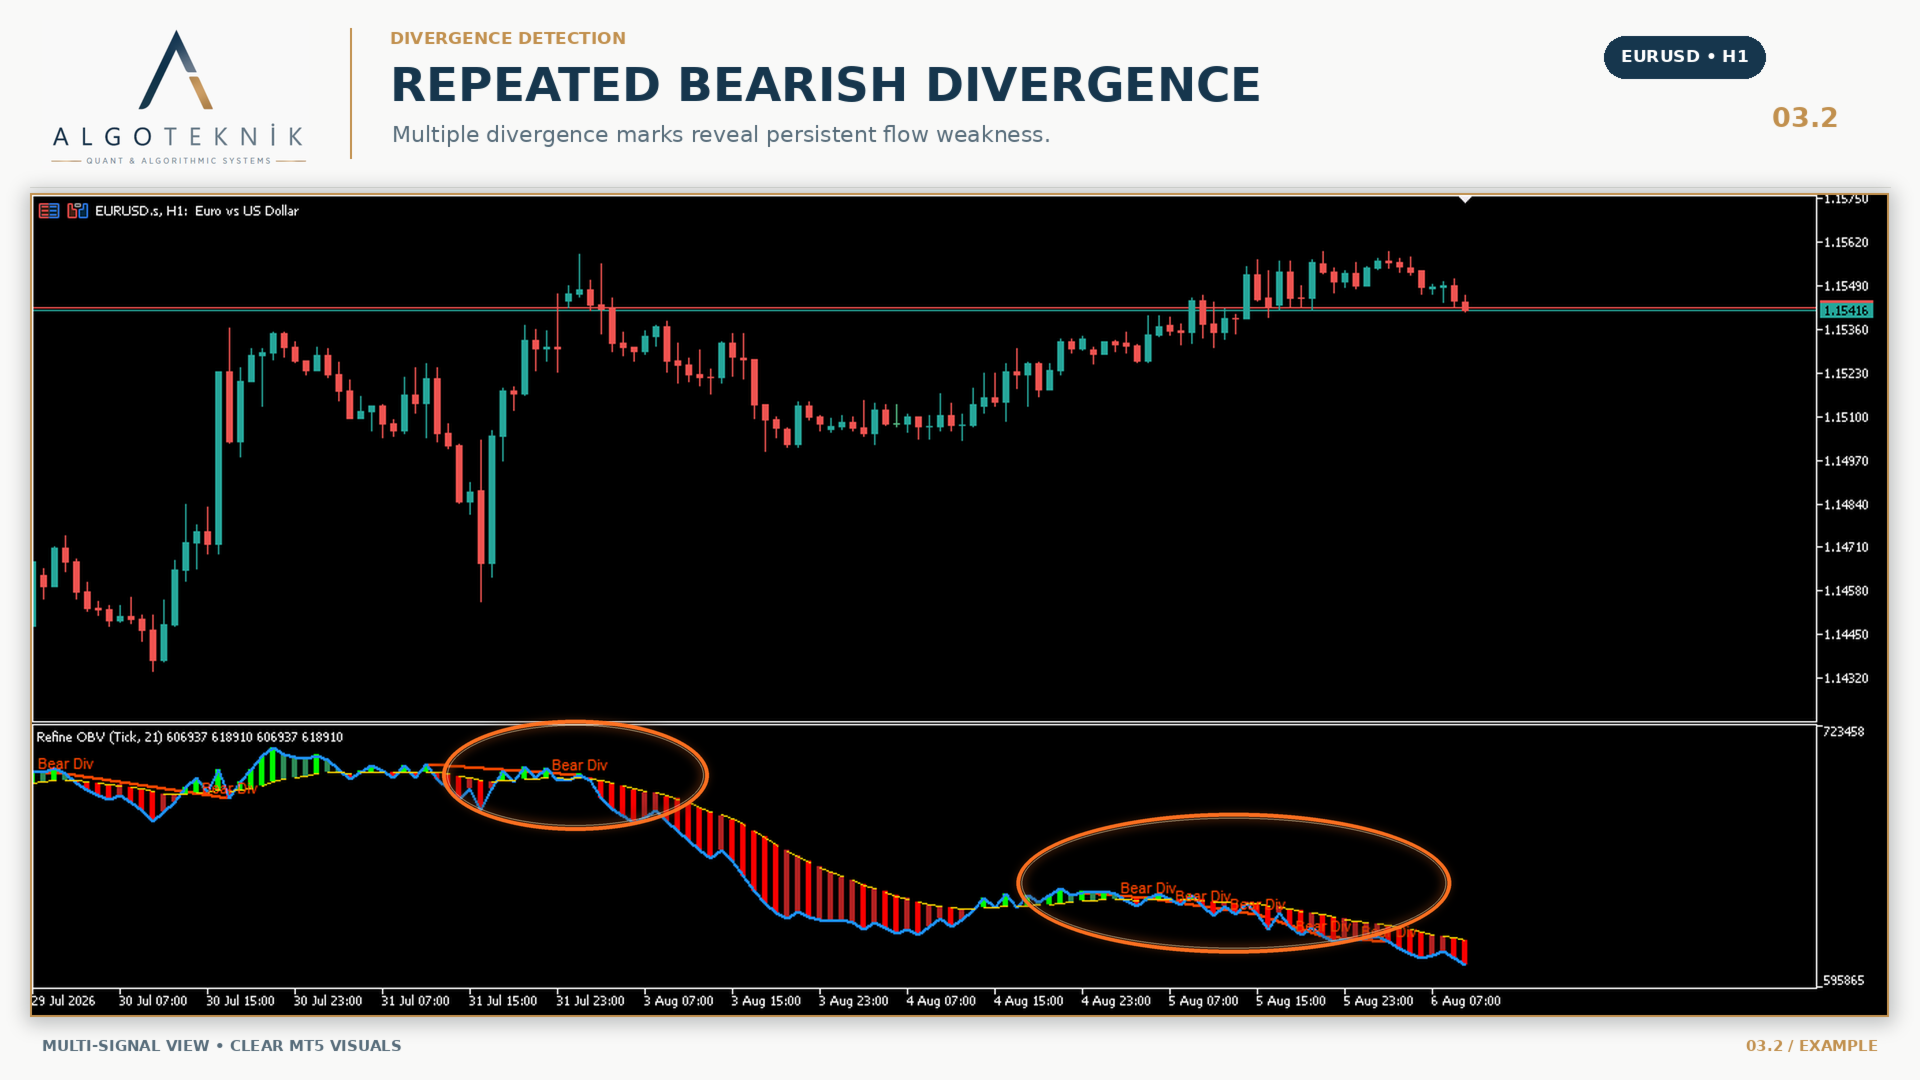
Additionally, confirmed swing pivots in price are compared against the volume flow at the same bars. When price makes a new extreme that volume flow refuses to confirm, a divergence line is drawn and tagged.
Three primary insights provided by the indicator:
1. Which side owns the flow based on whether the cloud is above or below its signal line.
2. Whether conviction is intact based on bright versus dark shading of the cloud.
3. Whether price action is disagreeing with participation via non-repainting divergence markers.
Release notes, chart examples and new product announcements are posted on the TrendTower channel: https://www.mql5.com/en/channels/trendtower
What You See on the Chart
Flow Spread Cloud
Bright Green indicates accumulation building where flow is above its signal line and the gap is widening. Dark Green indicates accumulation fading where flow is above its signal but the gap is narrowing. Bright Red indicates distribution building where flow is below its signal and falling further away. Dark Red indicates distribution fading where flow is below its signal but the gap is closing. Shade changes early while on the same side, providing a timely warning before a full directional cross.
Lines and Divergence Markers
OBV (solid blue) represents cumulative volume flow forming the upper edge of the cloud. Signal (dashed gold) represents the adaptive EMA forming the lower edge. Bearish Divergence (tagged Bear Div) occurs when price prints a higher high while flow prints a lower high. Bullish Divergence (tagged Bull Div) occurs when price prints a lower low while flow prints a higher low.
Input Parameters Reference
Flow Settings
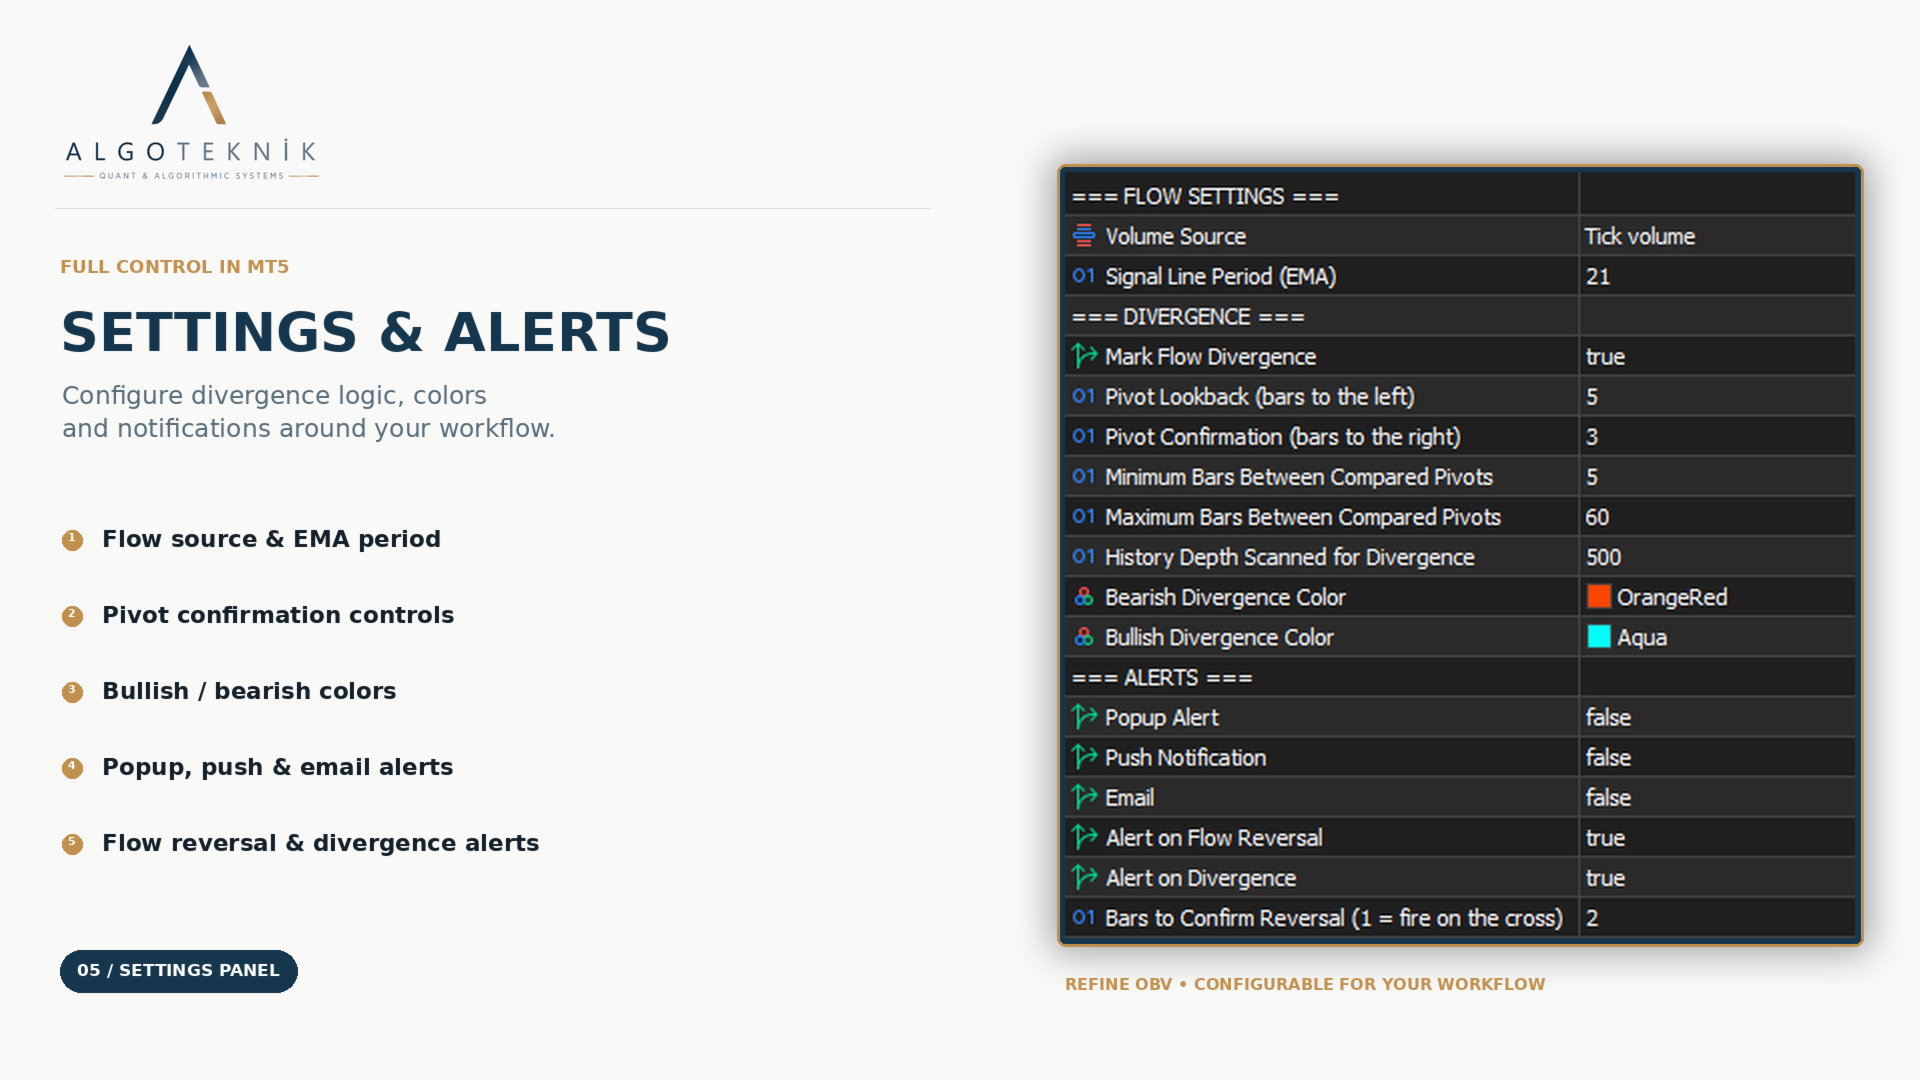
Volume Source: Default Tick. Selects tick volume or real exchange volume. Automatically falls back to tick volume if real volume is unavailable.
Signal Line Period (EMA): Default 21. Smoothing period of the signal line (valid range 2 to 1000).
Divergence Settings
Mark Flow Divergence: Default true. Toggles the divergence detection layer.
Pivot Lookback: Default 5. Left-side bar lookback required to confirm a swing pivot (valid range 1 to 50).
Pivot Confirmation: Default 3. Right-side closed bars required before accepting a pivot (valid range 1 to 50), guaranteeing non-repainting behavior.
Minimum Bars Between Pivots: Default 5. Minimum spacing between compared swing pivots.
Maximum Bars Between Pivots: Default 60. Maximum spacing between compared swing pivots (upper bound 5000).
History Depth Scanned: Default 500. Historical bar depth for divergence scanning at load.
Bearish / Bullish Colors: Default Orange Red / Aqua. Color settings for divergence lines and text labels.
Alert Settings
Popup Alert / Push Notification / Email: Delivery channels for reversal and divergence events.
Alert on Flow Reversal: Default true. Triggers alerts on confirmed cloud crosses.
Alert on Divergence: Default true. Triggers alerts on confirmed divergence patterns.
Bars to Confirm Reversal: Default 2. Required closed bars of hold after a cross before alerting (valid range 1 to 10).
How to Read It & System Mechanics
The cloud indicates current flow ownership while the shade shows whether participation is strengthening or decaying. A cloud crossover marks a change of directional control. Divergence highlights disagreement between price action and volume participation; it serves as a risk management input to tighten stops rather than a standalone entry trigger.
Automatic System Behaviors
Volume Source Fallback: Automatically detects missing real volume and switches to tick volume.
Signal Line Seeding: Uses a simple average seed over the first period to ensure smooth EMA calculation.
Hidden Warm-up: Leaves initial calculation bars unplotted rather than using dummy values.
Non-Repainting Divergence: Pivots and divergence lines are confirmed strictly on closed bars and never repaint.
Chart Cleanup: Sweeps old session objects on load and cleans all drawings upon removal.
Limitations to Keep in Mind
Absolute OBV cumulative values depend on chart history depth and should not be used as fixed thresholds. Focus strictly on cloud shape, color transitions, and relative divergence. Real volume features apply only to exchange-traded instruments publishing volume data.
Suggested Use & Disclaimer
- Attach to any symbol and timeframe using default settings as a baseline.
- Monitor cloud color and shading transitions rather than raw numerical flow values.
- Enable Popup or Push alerts for confirmed reversals and divergences.
- Use divergence markers to qualify trade structure and manage position risk.
Questions, bug reports and feature requests are welcome on the TrendTower channel: https://www.mql5.com/en/channels/trendtower
This is an indicator for analysis and decision support. It does not place trades. Always test thoroughly before using any tool in live trading. Trading involves risk.