Trend Align PRO
- Göstergeler
- Massimiliano Tuzzolino
- Sürüm: 1.0
- Etkinleştirmeler: 5
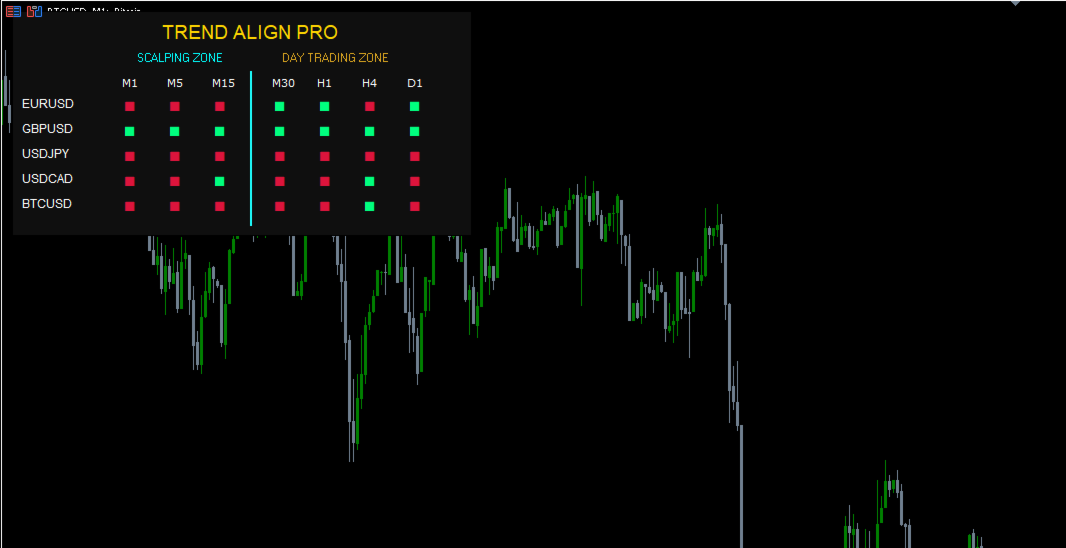
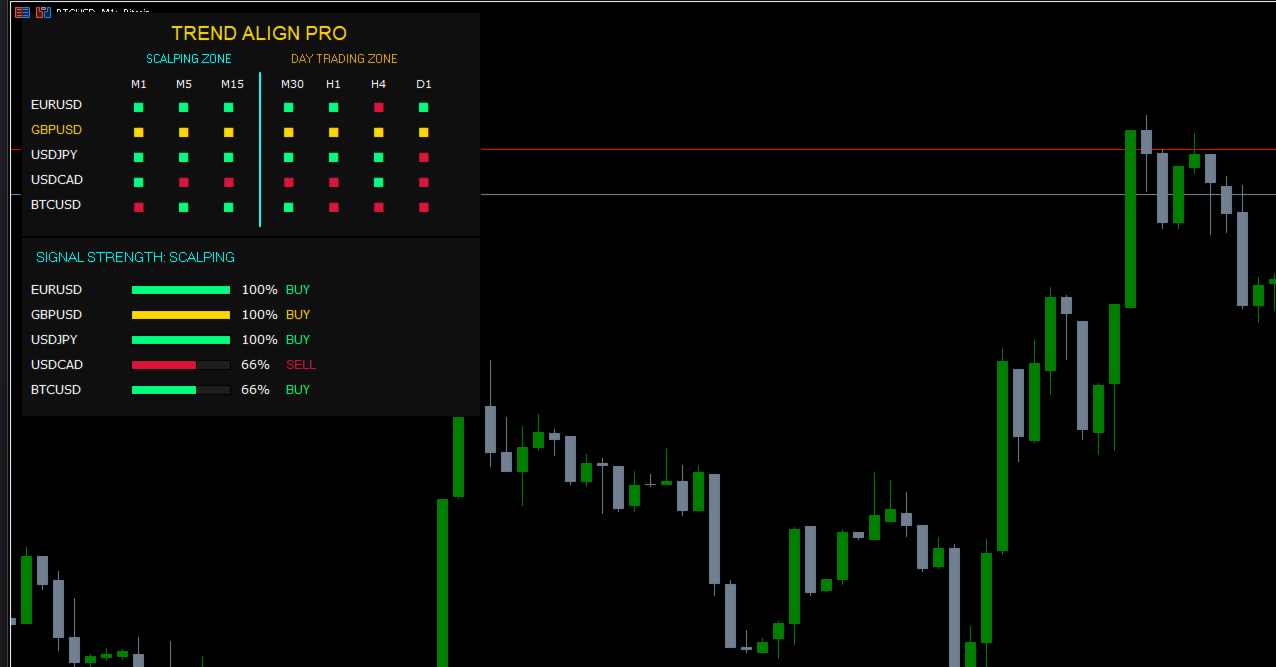
TREND ALIGN PRO is an advanced algorithmic analysis system for MetaTrader 5, designed to provide an immediate and simultaneous view of market direction across multiple instruments and timeframes. The dashboard transforms complex market data into an intuitive visual interface, allowing traders to identify moments of perfect market convergence at a glance. Key Features Convergence Protocol: The system identifies the rare moments when different temporal scales align in the same direction, highlighting the most favorable conditions for trading. Dual Operational Zones: The dashboard organizes the market into two strategic areas for maximum specialization:
Scalping Zone (M1, M5, M15): For capturing rapid moves and immediate liquidity flows. Day Trading Zone (M30, H1, H4, D1): For following structural trends and institutional directions. SUPER TREND Signal: When an asset reaches total alignment across all monitored timeframes (from M1 to D1), the system highlights the instrument in GOLD, signaling a condition of extreme trend strength. Signal Strength Analysis: An integrated module calculates the alignment percentage in real-time, graphically showing how solid a trend is or if it is in an exhaustion phase. Trading Execution Guide The dashboard is designed to act as a Confirmation Filter. For the best results, entries should be executed when the system reaches specific alignment states: Entering a BUY Position Scalping Entry: Enter when the Scalping Zone (M1, M5, M15) turns Triple Green. This indicates a short-term momentum surge. Day Trading Entry: Enter when the Day Trading Zone (M30, H1, H4, D1) turns Quadruple Green. This suggests that institutional buyers are in control. The Gold Entry: The highest probability setup occurs when the symbol name turns GOLD. This means all 7 timeframes are bullish; a massive trend where every dip is likely to be bought. Entering a SELL Position: Scalping Entry: Enter when the Scalping Zone (M1, M5, M15) turns Triple Red. This is ideal for quick drop-and-run trades.
Day Trading Entry: Enter when the Day Trading Zone (M30, H1, H4, D1) turns Quadruple Red. This confirms a solid bearish structure on higher timeframes. The Gold Entry: When the dashboard highlights the symbol in GOLD and the cells are red, it signals a Super Trend to the downside. This is the strongest signal for shorting as the entire market is selling off in sync. Signal Strength Optimization Before executing a trade, verify the Strength Bar at the bottom of the panel: 0% - 33% (Weak Trend): Avoid entry; the market is likely ranging or indecisive. 66% (Developing Trend): Good for aggressive traders entering as momentum builds. 100% (Maximum Strength): All timeframes in your chosen zone are fully aligned. This is the Primary Trigger for a professional entry. Efficiency and Control Smart Switch: Change the active chart symbol with a single click on the instrument name within the panel, drastically speeding up your technical analysis. Intelligent Notifications: Receive pop-up alerts and push notifications on your smartphone for the symbols you care about, ensuring you never miss a critical alignment. Adaptive Interface: Fully customizable colors and dimensions (via the Dashboard Scale parameter) to provide perfect readability on any monitor resolution. Visual Legend: Green Confirmed bullish direction. Red Confirmed bearish direction. GOLD Super Alignment (All 7 timeframes synchronized). Gray: Neutral phase, uncertainty, or data synchronization in progress.